|
시장보고서
상품코드
2119622
프로세서 시장 : 점유율 분석, 업계 동향과 통계, 성장 예측(2026-2031년)Processor - Market Share Analysis, Industry Trends & Statistics, Growth Forecasts (2026 - 2031) |
||||||
 Mordor Intelligence
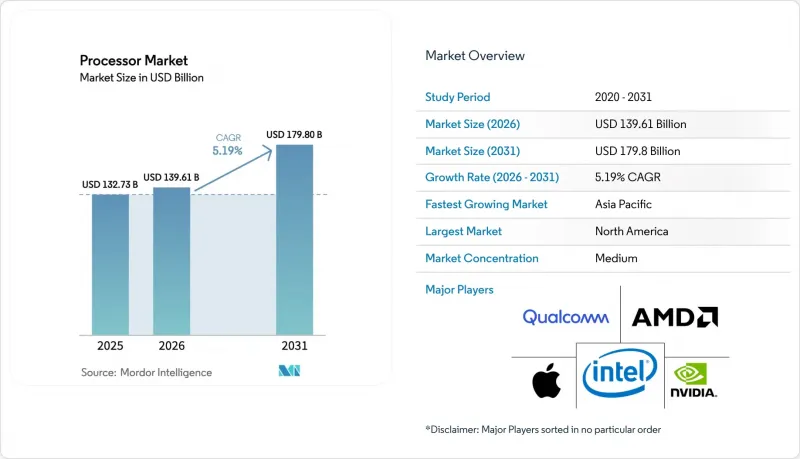
Mordor Intelligence에 의하면, 프로세서 시장 규모는 2025년에 1,327억 3,000만 달러로 평가되었고 2026년 1,396억 1,000만 달러에서 성장하여 2031년까지 1,798억 달러에 이를 것으로 예측됩니다.
예측 기간(2026-2031년) 동안의 연평균 성장률(CAGR)은 5.19%로 예상됩니다.
본 보고서는 제품 유형(CPU, 클라이언트, 서버, APU, 스마트폰, 태블릿, 스마트 TV 등), 마이크로 아키텍처(x86, Arm, RISC-V, Power), 제조 공정(10nm 초과, 7-10nm, 기타), 최종 용도(소비자용 전자기기, 데이터센터 및 클라우드, 산업용 및 IoT 엣지 등), 그리고 지역별로 분류되어 있습니다. 시장 예측은 금액(달러) 기준으로 제시되어 있습니다.
세계 프로세서 시장 동향 및 인사이트력
클라우드, AI, 빅데이터 워크로드의 도입 확대
각 하이퍼스케일러 기업들은 현재 시판되는 반도체에 비해 비용 대비 성능을 향상시키는 맞춤형 칩을 설계 및 도입하고 있습니다. AWS의 Trainium2는 GPU 인스턴스에 비해 AI 훈련의 비용 효율성을 30-40% 향상시켰으며, 한편 구글의 Ironwood TPU는 칩당 4,614 TFLOPS를 달성하고, 포드당 최대 42.5 엑사플롭스까지 확장 가능합니다. 그 결과, 450억 달러 규모의 맞춤형 칩 시장이 형성되었으며, 클라우드 사업자들이 실리콘 설계를 자체 제작함에 따라 기존 CPU 벤더들의 이익률이 압박받고 있습니다. 또한, 유럽 및 아시아 일부 지역의 데이터 주권 관련 규제가 지역별 프로세서 선호도를 강화하여 수요 패턴을 더욱 세분화하고 있습니다.
스마트폰의 보급 확대
휴대폰 제조업체들이 단말기 내 AI를 추진하는 가운데, 애플리케이션 프로세서에는 현재 전용 NPU가 탑재되어 있습니다. 애플의 A18 Pro는 행렬 연산 코프로세서를 통합하고 있으며, 퀄컴의 스냅드래곤 8 Gen 4는 NPU의 진화를 통해 40%의 성능 향상을 목표로 하고 있습니다. 5G 모뎀의 모노리식 통합으로 부품 원가가 15-20% 절감되었으며, 배터리 효율도 향상되었습니다. 기기 교체 주기가 길어짐에 따라 지속적인 효율성이 중요시되면서, 5nm 이하의 최첨단 공정 기술이 프리미엄 시장을 대상으로 양산되고 있습니다.
첨단 노드 설계 분야의 인력 부족
각 칩 제조업체들은 3nm 이하 공정에 대응할 수 있는 자격을 갖춘 엔지니어 채용에 어려움을 겪고 있습니다. 인텔은 초임 연봉 20만 달러를 제시하고 있음에도 불구하고 3,000건의 채용 공고가 채워지지 않았다고 보고했으며, TSMC는 현지 채용 인력을 육성하기 위해 대만인 직원 1,000명을 애리조나주로 전근시켰습니다. 학계의 커리큘럼 갱신 주기가 느리기 때문에 특히 칩릿 수가 급증하는 가운데 극히 중요한 검증 분야에서 5-7년의 기술 격차가 발생하고 있습니다. 미국의 비자 발급 상한선으로 인해 공급이 더욱 핍박되고 있어, 각사는 설계 센터를 인도나 동남아시아로 이전하기 시작했습니다.
부문별 분석
2025년, CPU는 프로세서 시장 점유율 63.70%를 유지했으나, APU의 연평균 성장률(CAGR) 6.32%는 AI 추론을 로컬에서 처리하는 통합형 CPU-GPU 패브릭에 대한 수요 증가를 뒷받침하고 있습니다. APU의 프로세서 시장 규모는 온칩 그래픽 가속화가 필요한 크리에이터용 워크로드 증가에 따라 확대될 것으로 예측됩니다. 스마트폰용 SoC는 자동차 및 IoT 분야로 확장되며, 그 수명 주기 가치를 확대되고 있습니다. 한편, 스마트 TV용 프로세서는 8K 컨텐츠와 AI를 통한 업스케일링이라는 호재를 누리고 있습니다. 태블릿 시장에서는 스마트폰급 반도체로 인해 성능 격차가 줄어들고 있어, 여전히 상품화 압력이 지속되고 있습니다.
애플의 M 시리즈는 PCIe 병목 현상을 해소하는 공유 메모리 아키텍처로의 전환을 구현하고 있는 반면, 인텔의 코어 울트라(Core Ultra)는 48 TOPS의 NPU를 통합하여 AI PC에서 x86의 중요성을 유지하고 있습니다. 스마트 워치, AR/VR, 자동차와 같은 특수 분야는 안전성 및 운전 지원 관련 규제의 추진으로 시장 점유율을 확대되고 있습니다. ISO 26262 등의 인증 절차는 개발 기간을 최대 24개월 연장하지만, 프리미엄 가격 책정과 높은 이익률 유지를 가능하게 합니다.
x86은 여전히 프로세서 시장을 독점하고 있으며, 2025년에는 54.10%의 점유율을 차지하지만, ARM 및 RISC-V 아키텍처는 효율성과 라이선싱의 유연성을 무기로 성장을 거듭하고 있습니다. ARM 코어 프로세서 시장 규모는 하이퍼스케일러들의 채택으로 인해 혜택을 보고 있습니다. AWS Graviton4와 Google Axion은 동급의 x86 인스턴스에 비해 최대 60% 더 높은 에너지 효율을 실현하고 있습니다. 인텔의 AMX 확장 기능은 이러한 격차를 해소하는 것을 목표로 하고 있지만, 이를 실현하기 위해서는 2년간의 소프트웨어 대응 기간이 필요합니다.
RISC-V의 연평균 성장률(CAGR) 6.47%는 그 개방성에 힘입은 것입니다. SiFive와 GlobalFoundries는 고신뢰성 시스템에서 Power 아키텍처의 틈새 시장에 도전하는 자동차 등급 설계를 제공합니다. 그러나 툴 부족으로 인해 주류 워크로드로의 도입은 3년에서 5년 정도 지연될 전망입니다. 수출 규제 대상에서 제외되는 IP를 우대하는 규제 변경에 따라 시범 도입이 가속화되고 있으며, 2028년 이후에는 시장 침투가 더욱 진행될 것으로 예측됩니다.
지역별 분석
북미는 CHIPS 법에 따른 자금 지원과 하이퍼스케일러의 집중으로 2025년에 프로세서 시장 점유율의 41.75%를 차지했습니다. 2025년 초, TSMC의 애리조나주 4nm 라인에서 양산이 본격화되어 Apple과 NVIDIA에 공급되는 한편, Intel은 2029년까지 파운드리 확장을 위해 1,000억 달러를 투자하겠다고 약속했습니다. 인력 부족과 비자 제한은 여전히 구조적인 장애물로 작용하고 있어, 기업들은 아시아에서 전문 인력을 수입할 수밖에 없는 상황입니다.
아시아태평양은 중국의 독자적인 설계와 인도의 100억 달러 규모의 인센티브 정책이 지역 자립을 촉진하여 8.25%라는 가장 높은 연평균 성장률(CAGR)을 기록하고 있습니다. 일본의 TSMC-JASM 팹과 한국의 ‘시스템 반도체 비전 2030’에 힘입어 전 세계 생산량은 더욱 동쪽으로 이동하고 있습니다. 수출 규제로 인해 중국 기업에 대한 하이엔드 EDA 툴 공급이 제한됨에 따라, 국내 설계 분야에서 RISC-V의 채택이 촉진되고 있습니다.
유럽에서는 430억 유로 규모의 ‘칩법’에 힘입어 성장이 유지되고 있으며, 이 법은 세계파운드리(GlobalFoundries)의 드레스덴 공장 확장 및 인텔이 계획 중인 마그데부르크 공장을 뒷받침하고 있습니다. 자동차용 프로세서가 이 대륙의 주요 수요원이 되고 있으며, 견고한 1차 공급망과 연동되고 있습니다. 환경 규제 및 GDPR(EU 개인정보보호규정) 요건으로 인해 인건비가 높음에도 불구하고, 각 OEM 업체들은 해당 지역에 위치한 공장을 우선적으로 선택하고 있습니다.
중동 및 아프리카는 정부계 투자 펀드를 활용해 조립·테스트 분야에 진출하고 있으나, 첨단 제조 기술은 여전히 초기 단계에 머물러 있습니다.
기타 혜택:
- 엑셀 형식 시장 예측(ME) 시트
- 3개월간 애널리스트 지원
자주 묻는 질문
목차
제1장 서론
제2장 조사 방법
제3장 개요
제4장 시장 구도
제5장 시장 규모와 성장 예측
제6장 경쟁 구도
제7장 시장 기회와 향후 전망
JHS 26.09.03According to Mordor Intelligence, the processor market size was valued at USD 132.73 billion in 2025 and estimated to grow from USD 139.61 billion in 2026 to reach USD 179.8 billion by 2031, at a CAGR of 5.19% during the forecast period (2026-2031).
This report is Segmented by Product Type (CPU, Client, Server, APU, Smartphone, Tablet, Smart Television, and More), Micro-Architecture (x86, Arm, RISC-V, and Power), Fabrication Node (More Than 10 Nm, 7-10 Nm, and More), End-Use Application (Consumer Electronics, Data Center and Cloud, Industrial and IoT Edge, and More), and Geography. The Market Forecasts are Provided in Terms of Value (USD).
Global Processor Market Trends and Insights
Growing adoption of cloud, AI and big-data workloads
Hyperscalers now design and deploy custom chips that lift performance-per-dollar versus merchant silicon. AWS Trainium2 improves AI training cost efficiency by 30-40% compared with GPU instances, while Google's Ironwood TPU hits 4,614 TFLOPS per chip and scales to 42.5 exaflops per pod. The resulting USD 45 billion custom-chip opportunity is eroding margins for traditional CPU vendors as cloud operators internalize silicon design. Data-sovereignty mandates in Europe and parts of Asia are reinforcing regional processor preferences, further segmenting demand patterns.
Rising penetration of smartphones
Application processors now ship with dedicated NPUs as handset makers push on-device AI. Apple's A18 Pro integrates matrix coprocessors, and Qualcomm's Snapdragon 8 Gen 4 targets a 40% performance uplift through NPU advancements. The monolithic integration of 5G modems has cut the bill-of-materials cost by 15-20% and lifted battery efficiency. Slower replacement cycles shift emphasis to sustained efficiency, pushing leading-edge nodes below 5 nm into volume for premium tiers.
Talent shortage in advanced node design
Chipmakers face difficulty hiring engineers qualified for 3 nm and below. Intel reported 3,000 open roles despite USD 200,000 starting packages, and TSMC moved 1,000 Taiwanese staff to Arizona to train local hires. Academia's slower curriculum cycles add a 5-7 year skills lag, especially in verification, critical as chiplet counts soar. Visa caps in the U.S. further tighten supply, prompting companies to relocate design centers to India and Southeast Asia.
Other drivers and restraints analyzed in the detailed report include:
- Expanding edge-computing deployments
- Government incentives for semiconductor capacity
- Geopolitical export controls on EDA/IP
For complete list of drivers and restraints, kindly check the Table Of Contents.
Segment Analysis
CPUs retained 63.70% of the processor market share in 2025, yet APUs' 6.32% CAGR underscores demand for unified CPU-GPU fabrics that handle AI inference locally. The processor market size for APUs is projected to increase in tandem with rising creator workloads that need on-chip graphics acceleration. Smartphone SoCs branch into automotive and IoT, extending their lifetime value, while smart-TV processors ride 8 K content and AI upscaling tailwinds. Commodity pressure on tablets persists as phone-class silicon narrows the performance delta.
Apple's M-series exemplifies a shift toward shared-memory architectures that erase PCIe bottlenecks, while Intel's Core Ultra integrates a 48 TOPS NPU to preserve x86 relevance in AI PCs. Specialty categories, smartwatch, AR/VR, and automotive, gain share from regulatory pushes on safety and assisted driving. Certification paths such as ISO 26262 lengthen development by up to 24 months but allow premium pricing and higher margin retention.
x86 still dominates the processor market, holding 54.10% in 2025, but ARM and RISC-V architectures thrive on efficiency and licensing flexibility. Processor market size for ARM cores benefits from hyperscaler adoption: AWS Graviton4 and Google Axion yield up to 60% better energy efficiency over equivalent x86 instances. Intel's AMX extensions aim to offset the gap but hinge on a two-year software-enablement curve.
RISC-V's 6.47% CAGR rests on openness; SiFive and GlobalFoundries bring automotive-grade designs that challenge Power architecture's niche in high-reliability systems. However, tooling gaps delay mainstream workloads by three to five years. Regulatory shifts that favor export-control-free IP accelerate pilot deployments, hinting at deeper market penetration after 2028.
Complete Report Scope:
- By Product Type
- CPU
- Client (Desktop and Laptop)
- Server
- APU
- Smartphone
- Tablet
- Smart Television
- Smart Speakers
- Other (Smartwatch, Notebook, AR/VR, Automotive)
- By Micro-Architecture
- x86
- Arm
- RISC-V
- Power
- By Fabrication Node
- More than 10 nm
- 7-10 nm
- 5-6 nm
- Equal to and less than 4 nm
- By End-Use Application
- Consumer Electronics
- Data Center and Cloud
- Industrial and IoT Edge
- Automotive and ADAS
- Aerospace and Defense
- By Geography
- North America
- United States
- Canada
- Mexico
- South America
- Brazil
- Argentina
- Rest of South America
- Europe
- Germany
- United Kingdom
- France
- Italy
- Spain
- Russia
- Rest of Europe
- Asia-Pacific
- China
- Japan
- India
- South Korea
- South-East Asia
- Rest of Asia-Pacific
- Middle East and Africa
- Middle East
- Saudi Arabia
- United Arab Emirates
- Turkey
- Rest of Middle East
- Africa
- South Africa
- Nigeria
- Rest of Africa
- Middle East
- North America
Geography Analysis
North America controlled 41.75% of the processor market share in 2025, thanks to the CHIPS Act funding and hyperscaler concentration. Volume ramped at TSMC Arizona's 4 nm line in early 2025, supplying Apple and NVIDIA, while Intel pledged USD 100 billion through 2029 for foundry expansion. Talent gaps and visa limits remain structural impediments, forcing companies to import expertise from Asia.
Asia-Pacific posts the fastest 8.25% CAGR as China's indigenous designs and India's USD 10 billion incentives build regional self-reliance. Japan's TSMC-JASM fab and South Korea's System Semiconductor Vision 2030 further tilt global output eastward. Export controls restrict high-end EDA flows to Chinese firms, spurring RISC-V adoption in domestic designs.
Europe sustains growth via the EUR 43 billion Chips Act that backs GlobalFoundries' Dresden expansion and Intel's prospective Magdeburg fab. Automotive processors form the continent's core demand, aligning with a robust Tier-1 supply chain. Environmental and GDPR rules steer OEMs toward regionally located fabs despite higher labor costs.
The Middle East and Africa enter assembly-and-test segments using sovereign investment funds, but advanced fabrication remains nascent.
- Advanced Micro Devices Inc. (AMD)
- Intel Corporation
- Qualcomm Technologies Inc.
- Apple Inc.
- NVIDIA Corporation
- MediaTek Inc.
- Samsung Electronics Co. Ltd.
- Huawei Technologies Co. Ltd. (HiSilicon)
- Broadcom Inc.
- Marvell Technology Group Ltd.
- UNISOC (Shanghai) Technologies Co. Ltd.
- Texas Instruments Inc.
- Renesas Electronics Corporation
- NXP Semiconductors N.V.
- STMicroelectronics N.V.
- VIA Technologies Inc.
- SiFive Inc.
- Ampere Computing LLC
- Alibaba Pingtouge (T-Head)
- Esperanto Technologies Inc.
Additional Benefits:
- The market estimate (ME) sheet in Excel format
- 3 months of analyst support
TABLE OF CONTENTS
1 INTRODUCTION
- 1.1 Study Assumptions and Market Definition
- 1.2 Scope of the Study
2 RESEARCH METHODOLOGY
3 EXECUTIVE SUMMARY
4 MARKET LANDSCAPE
- 4.1 Market Overview
- 4.2 Market Drivers
- 4.2.1 Rising penetration of smartphones
- 4.2.2 Growing adoption of cloud, AI and big-data workloads
- 4.2.3 Expanding edge-computing deployments
- 4.2.4 Government incentives for semiconductor capacity
- 4.2.5 AI-optimized instruction-set extensions (e.g., AMX, SVE2)
- 4.2.6 Chiplet-based heterogeneous integration cost savings
- 4.3 Market Restraints
- 4.3.1 Talent shortage in advanced node design
- 4.3.2 Geopolitical export controls on EDA/IP
- 4.3.3 Thermal design limits in sub-3 nm nodes
- 4.3.4 Supply-chain emissions compliance costs
- 4.4 Impact of Macroeconomic Factors
- 4.5 Regulatory Landscape
- 4.6 Technology Outlook
- 4.7 Industry Supply Chain Analysis
- 4.8 Porter's Five Forces Analysis
- 4.8.1 Bargaining Power of Suppliers
- 4.8.2 Bargaining Power of Consumers
- 4.8.3 Threat of New Entrants
- 4.8.4 Threat of Substitutes
- 4.8.5 Intensity of Competitive Rivalry
5 MARKET SIZE AND GROWTH FORECASTS (VALUE)
- 5.1 By Product Type
- 5.1.1 CPU
- 5.1.2 Client (Desktop and Laptop)
- 5.1.3 Server
- 5.1.4 APU
- 5.1.5 Smartphone
- 5.1.6 Tablet
- 5.1.7 Smart Television
- 5.1.8 Smart Speakers
- 5.1.9 Other (Smartwatch, Notebook, AR/VR, Automotive)
- 5.2 By Micro-Architecture
- 5.2.1 x86
- 5.2.2 Arm
- 5.2.3 RISC-V
- 5.2.4 Power
- 5.3 By Fabrication Node
- 5.3.1 More than 10 nm
- 5.3.2 7-10 nm
- 5.3.3 5-6 nm
- 5.3.4 Equal to and less than 4 nm
- 5.4 By End-Use Application
- 5.4.1 Consumer Electronics
- 5.4.2 Data Center and Cloud
- 5.4.3 Industrial and IoT Edge
- 5.4.4 Automotive and ADAS
- 5.4.5 Aerospace and Defense
- 5.5 By Geography
- 5.5.1 North America
- 5.5.1.1 United States
- 5.5.1.2 Canada
- 5.5.1.3 Mexico
- 5.5.2 South America
- 5.5.2.1 Brazil
- 5.5.2.2 Argentina
- 5.5.2.3 Rest of South America
- 5.5.3 Europe
- 5.5.3.1 Germany
- 5.5.3.2 United Kingdom
- 5.5.3.3 France
- 5.5.3.4 Italy
- 5.5.3.5 Spain
- 5.5.3.6 Russia
- 5.5.3.7 Rest of Europe
- 5.5.4 Asia-Pacific
- 5.5.4.1 China
- 5.5.4.2 Japan
- 5.5.4.3 India
- 5.5.4.4 South Korea
- 5.5.4.5 South-East Asia
- 5.5.4.6 Rest of Asia-Pacific
- 5.5.5 Middle East and Africa
- 5.5.5.1 Middle East
- 5.5.5.1.1 Saudi Arabia
- 5.5.5.1.2 United Arab Emirates
- 5.5.5.1.3 Turkey
- 5.5.5.1.4 Rest of Middle East
- 5.5.5.2 Africa
- 5.5.5.2.1 South Africa
- 5.5.5.2.2 Nigeria
- 5.5.5.2.3 Rest of Africa
- 5.5.5.1 Middle East
- 5.5.1 North America
6 COMPETITIVE LANDSCAPE
- 6.1 Market Concentration
- 6.2 Strategic Moves
- 6.3 Market Share Analysis
- 6.4 Company Profiles (includes Global level Overview, Market level overview, Core Segments, Financials as available, Strategic Information, Market Rank/Share for key companies, Products and Services, and Recent Developments)
- 6.4.1 Advanced Micro Devices Inc. (AMD)
- 6.4.2 Intel Corporation
- 6.4.3 Qualcomm Technologies Inc.
- 6.4.4 Apple Inc.
- 6.4.5 NVIDIA Corporation
- 6.4.6 MediaTek Inc.
- 6.4.7 Samsung Electronics Co. Ltd.
- 6.4.8 Huawei Technologies Co. Ltd. (HiSilicon)
- 6.4.9 Broadcom Inc.
- 6.4.10 Marvell Technology Group Ltd.
- 6.4.11 UNISOC (Shanghai) Technologies Co. Ltd.
- 6.4.12 Texas Instruments Inc.
- 6.4.13 Renesas Electronics Corporation
- 6.4.14 NXP Semiconductors N.V.
- 6.4.15 STMicroelectronics N.V.
- 6.4.16 VIA Technologies Inc.
- 6.4.17 SiFive Inc.
- 6.4.18 Ampere Computing LLC
- 6.4.19 Alibaba Pingtouge (T-Head)
- 6.4.20 Esperanto Technologies Inc.
7 MARKET OPPORTUNITIES AND FUTURE OUTLOOK
- 7.1 White-space and Unmet-need Assessment