

|
시장보고서
상품코드
2119904
LED 디스플레이 시장 : 점유율 분석, 업계 동향과 통계, 성장 예측(2026-2031년)LED Display - Market Share Analysis, Industry Trends & Statistics, Growth Forecasts (2026 - 2031) |
||||||
 Mordor Intelligence
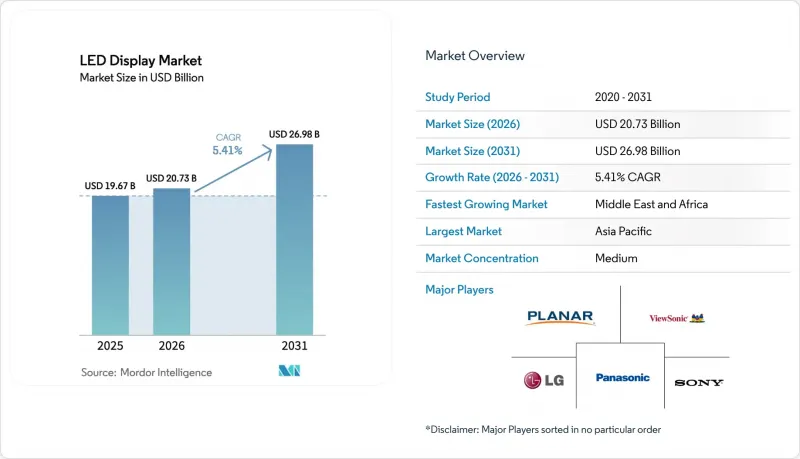
Mordor Intelligence에 의하면, LED 디스플레이 시장 규모는 2025년에 196억 7,000만 달러로 평가되었고 2026년 207억 3,000만 달러에서 2031년까지 269억 8,000만 달러에 이를 것으로 예측되며, 예측 기간(2026-2031년)에서 CAGR은 5.41%를 나타낼 전망입니다.
본 보고서는 설치 유형(고정식 등), 디스플레이 유형(실외용 등), 기술(마이크로 LED, OLED 등), 픽셀 피치(1.5mm 미만 및 1.5mm 이하), 컬러 디스플레이(흑백 등), 화면 크기(10제곱미터 미만, 기타),용도(광고·미디어, 기타), 최종 사용자 산업(상업용, 기타), 지역별로 분류되어 있습니다. 시장 예측은 금액(달러) 기준으로 제시되어 있습니다.
세계 LED 디스플레이 시장 동향 및 인사이트
GCC 지역 제어실의 미세 픽셀 피치 실내 벽면 디스플레이로의 전환
현재 GCC 지역의 신규 제어실 사양에서는 1.5mm 미만의 초미세 픽셀 피치 디스플레이가 주류를 이루고 있으며, 에너지, 교통, 보안 거점에서는 타일 형태로 배치된 LCD 월을 대체하고 있습니다. 사우디아라비아와 UAE는 연간 150억 달러 규모의 디지털 인프라 예산 중 상당 부분을 여러 데이터 스트림을 실시간으로 표시하는 베젤리스 시각화 시스템에 할당했습니다. 2024년에 공고된 제어실 입찰 프로젝트의 60% 이상에서 직접 뷰 LED가 요구되고 있으며, 그 이유로 기존 솔루션에 비해 5년간 총 소유 비용(TCO)이 22% 절감된다는 점이 꼽히고 있습니다. 이러한 추가 비용은 운영의 명확성, 소음 감소, 그리고 중요한 데이터를 가리는 이음매를 없앤 점으로 정당화됩니다. 통합 서비스는 여전히 병목 현상을 일으키고 있으므로, 각 벤더들은 시운전 주기를 단축하기 위해 자동 정렬 기능과 원격 보정 기능을 통합하고 있습니다.
중국 2선 도시에서 디지털 아웃 오브 홈(DOOH) 광고의 급속한 확산
2024년 중국 DOOH 네트워크의 광고비는 74억 달러에 달할 전망이며, 이 중 38%는 이미 2선 도시가 차지하고 있습니다. 광고주들은 정지 화상 광고판에 비해 캠페인 효과를 27% 향상시키는 AI 기반 오디언스 분석을 높이 평가했습니다. 설치 장소의 임대료가 저렴하고 현지 허가 절차도 간소화되어 있어, 포화 상태에 이른 1급 도시 시장보다 신속한 확장이 가능합니다. 각 디스플레이 공급업체들은 픽셀 피치 가격 하락과 옥상 및 도로변 설치를 간소화하는 모듈식 프레임에 힘입어 사이니지 매출이 두 자릿수 성장을 보이고 있다고 보고하고 있습니다. 이러한 성장세는 중국 미디어 투자자들이 검증된 운영 모델을 재현하고 있는 동남아시아의 대도시권으로도 파급되고 있습니다.
마이크로 LED 대량 전사 장비에 드는 고액의 설비 투자
상용 전사 장비는 라인당 5,000만-7,500만 달러의 비용이 들기 때문에 2024년 마이크로 LED의 규모 확대는 전 세계 12개 사업자로 제한될 전망입니다. 6,400칩 전사 시 현재 99.3%의 수율률은 비용 효율적인 양산 수준에는 아직 미치지 못해, 주류로 보급되는 데 지연을 겪고 있습니다. 레이저 유도 방식의 포워드 전사나 유체 조립과 같은 혁신 기술은 단위당 자본 집약도를 낮추는 측면에서 유망하지만, 공장 전환에는 여러 번의 계획 주기가 필요합니다. 그 결과, 각 제조업체는 뛰어난 밝기와 명암비로 인해 고가 책정이 정당화되는 초프리미엄 제품에 마이크로 LED 생산 할당량을 배정하고 있습니다.
부문 분석
고정형 부문은 2.9mm 미만의 해상도를 요구하는 소매점, 기업 및 제어실로의 영구적인 도입에 힘입어 2025년 매출의 62.35%를 차지했습니다. 멀티 소스 대시보드나 브랜드 월에서는 매끄러운 영상이 요구되기 때문에 LED 디스플레이 시장에서 이러한 장치의 가동률은 계속해서 높은 수준을 유지하고 있습니다. 한편, 라이브 이벤트, 무역 박람회,하이브리드 형식의 기업 회의가 회복됨에 따라, 렌탈 및 모바일 솔루션은 2031년까지 연평균 성장률(CAGR) 6.78%로 성장할 전망입니다. 공구 없이 조립 가능한 프레임 덕분에 설치 작업이 40% 단축되었으며, 자동 보정 기능이 내장되어 있어 상설 설비와의 품질 격차가 줄어들고 있습니다. 또한, 각 벤더사는 플라이트 케이스를 활용한 물류 시스템과 퀵락 커넥터를 도입하여, 렌탈 사업자가 프로젝트 리드타임을 단축하고 자산 회전율을 높일 수 있도록 지원하고 있습니다.
전문 이벤트 기획자들은 현대 기업 행사의 유연한 특성에 맞추어, 설비 투자(Capex)를 운영비(OpEx)로 전환하는 구독 모델을 점점 더 선호하고 있습니다. 기술 공급업체들은 스크린 상태를 원격으로 모니터링하고 있어, 숙련된 인력 부족이 지속되는 가운데 현장에서 기술자의 필요성을 최소화하고 있습니다. 이러한 동향으로 인해, 특히 임시 무대에서도 초고화질 컨텐츠를 투사할 수 있는 2.9mm 미만의 픽셀 피치 제품에 대한 잠재적 수요가 확대되고 있습니다. 그 결과, LED 디스플레이 시장에서 렌탈 솔루션은 최첨단 픽셀 기술을 선보이는 최전선의 쇼케이스로 환영받고 있으며, 이러한 솔루션은 이후 고정 설치로 전환되고 있습니다.
2025년에는 5,000-8,000니트의 밝기 수준과 광고 및 교통 허브에 적합한 견고한 케이스를 갖춘 실외용 시스템이 매출의 55.30%를 차지했습니다. 한편, 실내용 유닛은 2031년까지 연평균 성장률(CAGR) 6.5%를 기록하며 더 빠른 성장률을 보일 전망입니다. 1.5mm 이하의 미세 피치는 베젤이 없어 선명한 영상을 구현하며, 회의실, 방송 스튜디오, 플래그십 스토어 등 소매점에서 LCD 비디오월을 능가하고 있습니다. 표면 처리를 통해 눈부심이 억제될 뿐만 아니라, 패널의 두께가 40 mm 미만으로 얇아져 벽면과 수평을 이루도록 설치할 수 있게 되었습니다.
기업의 부동산 담당자들은 바닥 면적을 확보하고 현대적인 업무 공간 디자인과 조화를 이루는 이러한 슬림한 프로파일을 높이 평가했습니다. 캐비닛에 내장된 스마트 빌딩용 센서 덕분에 이용 사례는 재실 상황 분석 및 환경 모니터링으로 더욱 확대됩니다. 이러한 다기능적 이점은 실내 시장에서의 비즈니스 사례를 강화하며, LED 디스플레이 시장을 단순한 시각 매체가 아닌 풀스택 업무 공간 솔루션으로 자리매김하고 있습니다.
기존 SMD 아키텍처는 수십 년에 걸친 공급망과 입증된 신뢰성을 바탕으로 2025년 출하량의 77.20%를 차지했습니다. 미니 LED는 중저가 시장에서 유연성을 높이고 있지만, 마이크로 LED의 예상 연평균 성장률(CAGR) 8.75%는 자동차용 헤드업 디스플레이를 선명하게 표시하는 1,000만 닛의 녹색 픽셀 등 극한의 성능에 대한 수요 증가를 반영하고 있습니다. 레이저 리소그래피 및 웨이퍼 레벨 본딩을 통해 향후 비용 절감이 예상되지만, 단기적인 생산량은 여전히 고급 홈 시네마, 항공우주 분야의 조종석, 증강현실(AR) 웨어러블 기기에 편중되어 있습니다.
현재의 생태계는 계층적인 피라미드 구조를 띠고 있습니다. SMD는 폭넓은 상용화를 담당하고, Mini-LED는 프리미엄 중급 사이니지를 담당하며, Micro-LED는 가격 민감도를 상회하는 전력 효율과 명암비가 요구되는 최상위 용도를 정의하고 있습니다. 수율이 향상됨에 따라 마이크로 LED 제품의 LED 디스플레이 시장 규모는 고급 틈새 시장을 넘어 확장될 것이며, 자동차, 방위, 전문 소매 환경에서 목표 매출이 확대될 전망입니다.
지역별 분석
2025년, 아시아태평양은 생산 및 국내 도입에서 중국의 압도적인 우위 덕분에 전 세계 매출의 47.60%를 차지했습니다. 이 지역은 전 세계 제조 능력의 약 80%를 차지하고 있으며, 이를 통해 규모의 경제가 실현되어 단가 인하와 신속한 연구 개발 및 제품 출시 주기를 추진할 수 있게 되었습니다. 중국의 LED 디스플레이 시장 규모는 2024년에 6,600억 위안으로 도달할 것으로 예측되며, 연평균 15.79%의 복합 성장률로 확대되어 세계 평균을 크게 상회하고 있습니다. 중국의 2선 도시에서는 DOOH(디지털 옥외 광고) 도입이 지속적으로 진행되고 있는 반면, 인도와 인도네시아에서는 유틸리티용으로 경제적인 모듈이 수입되어 해당 지역의 성장세를 더욱 강화하고 있습니다.
북미와 유럽은 여전히 하이엔드 기술 혁신의 중심지입니다. 미국의 스포츠 경기장, 영화 촬영 세트장, 기업 로비는 방송 등급의 색상 정확도를 충족하는 Micro-LED, Mini-LED 및 파인 피치 모듈에 대한 수요의 주축이 되고 있습니다. EU의 에너지 지침에 따라 제조업체들은 전력 소비와 재활용성을 최적화해야 하는 압박을 받고 있으며, 이로 인해 드라이버 회로 및 재활용 가능한 알루미늄 케이스 설계 분야에서 획기적인 진전이 촉진되고 있습니다. 출하량은 아시아에 미치지 못하지만, 평균 판매 가격은 높은 수준을 유지하고 있어, 첨단 제조 노하우를 보유한 공급업체에 막대한 이익을 가져다주고 있습니다.
중동 및 아프리카는 규모는 작지만, 2026년부터 2031년까지 연평균 성장률(CAGR) 6.78%라는 가장 빠른 성장 궤도를 그리고 있습니다. GCC 국가들, 특히 사우디아라비아와 UAE는 보안 관제실, 스마트 시티용 디스플레이, 그리고 국가의 위상을 보여주는 랜드마크 역할을 겸하는 호스피탈리티 프로젝트에 막대한 자본을 투자하고 있습니다. Philips 프로페셔널 디스플레이 솔루션즈가 2024년에 풀 LED 제품군을 도입한 것은 이 지역이 실력 있는 상업 허브로 성숙해 가고 있음을 보여줍니다. 아프리카의 주요 도시들도 점차 이를 따르고 있으며, 이동통신 사업자들이 제시하는 디지털 아웃 오브 홈(DOOH) 구상을 활용하여 기존의 정적인 간판을 뛰어넘는 발전을 이루고 있습니다. 이러한 신흥 시장에서는 결정적인 선정 기준으로 가격보다 프리미엄 포지셔닝이나 턴키 서비스 제공이 더 중요하게 여겨지는 경우가 많습니다.
기타 혜택:
- 엑셀 형식 시장 예측(ME) 시트
- 3개월간의 애널리스트 지원
자주 묻는 질문
목차
제1장 서론
제2장 조사 방법
제3장 개요
제4장 시장 구도
제5장 시장 규모와 성장 예측
제6장 경쟁 구도
제7장 시장 기회와 향후 전망
JHS 26.09.03According to Mordor Intelligence, the LED display market size was valued at USD 19.67 billion in 2025 and estimated to grow from USD 20.73 billion in 2026 to reach USD 26.98 billion by 2031, at a CAGR of 5.41% during the forecast period (2026-2031).
This report is Segmented by Installation Type (Fixed, and More), Display Type (Outdoor, and More), Technology (Micro-LED, OLED, and More), Pixel Pitch (Sub and Up To 1. 5 Mm), Color Display (Monochrome, and More), Screen Size (Sub 10 Sq. M., and More), Application (Advertising and Media, and More), End-User Industry (Commercial, and More), and Geography. The Market Forecasts are Provided in Terms of Value (USD).
Global LED Display Market Trends and Insights
Shift to Fine-Pixel-Pitch Indoor Walls in GCC Control Rooms
Fine-pixel-pitch displays below 1.5 mm now dominate new GCC control room specifications, replacing tiled LCD walls in energy, transport, and security hubs. Saudi Arabia and the UAE allocated sizable portions of their USD 15 billion annual digital-infrastructure budgets to bezel-free visualization suites that show multiple data streams in real time. Over 60% of control room tenders released in 2024 required direct-view LED, citing 22% lower five-year total cost of ownership compared with legacy solutions. The premium is justified by operational clarity, noise reduction, and the elimination of seams that obscure critical data. Integration services remain a bottleneck, so vendors are embedding auto-alignment and remote calibration to shorten commissioning cycles.
Rapid Adoption of Digital-Out-of-Home Advertising in Tier-2 Chinese Cities
DOOH networks in China posted USD 7.4 billion in 2024 spend, and tier-2 cities already contribute 38% of that outlay. Advertisers value AI-driven audience analytics that raise campaign effectiveness 27% compared with static boards. Lower site rents and streamlined local approvals unlock faster rollouts than in saturated tier-1 markets. Display suppliers report double-digit signage growth, helped by falling pixel-pitch prices and modular frames that simplify rooftop and street-level mounting. Scaling momentum is also spilling over to Southeast Asian metros where Chinese media investors replicate proven operating models.
High CapEx for Micro-LED Mass-Transfer Equipment
Commercial transfer tools cost USD 50-75 million per line, restricting Micro-LED scale-up to 12 global operators in 2024.Current yields of 99.3% for 6,400-chip transfers remain shy of cost-effective mass production, delaying mainstream adoption. Innovations such as laser-induced forward transfer and fluidic assembly show promise by lowering per-unit capital intensity, yet factory conversions will take several planning cycles. Consequently, manufacturers allocate Micro-LED output to ultra-premium products where superior brightness and contrast warrant higher pricing.
Other drivers and restraints analyzed in the detailed report include:
- Stadium-Scale LED Megascreens Driving U.S. Sports Fan Engagement
- Surge in Traffic-Management Variable-Message Signs Across ASEAN Smart-City Corridors
- Supply Bottlenecks of Red and Green Micro Chips Sub 10 µm
For complete list of drivers and restraints, kindly check the Table Of Contents.
Segment Analysis
The fixed segment generated 62.35% of 2025 revenue, driven by permanent retail, corporate, and control-room deployments that specify sub-2.9 mm resolutions. The LED display market continues to see high utilization of these units because multi-source dashboards and brand walls demand seamless visuals. Conversely, rental and mobile solutions will add 6.78% CAGR through 2031 as live events, trade shows, and hybrid corporate meetings rebound. Tool-free frames now reduce set-up labor 40% and incorporate auto-calibration that narrows quality gaps with permanent structures. Vendors also embed flight-case logistics and quick-lock connectors, supporting shorter project lead times and higher asset turns for rental operators.
Professional event planners increasingly prefer subscription models that convert capex to opex, aligning with the flexible nature of modern corporate gatherings. Technology suppliers track screen health remotely, minimizing on-site technician requirements amid skilled-labor shortages. These trends widen addressable demand, especially for pixel pitches below 2.9 mm that can present ultra-high-definition content even on temporary stages. As a result, the LED display market welcomes rental solutions as a frontline showcase for cutting-edge pixels that later transition into fixed installations.
Outdoor systems retained 55.30% of revenue in 2025 based on brightness levels of 5,000-8,000 nits and ruggedized cabinets suited to advertising and transit hubs. Yet indoor units will secure a faster 6.5% CAGR through 2031. Fine pitches of <= 1.5 mm deliver bezel-free clarity that eclipses LCD videowalls in boardrooms, broadcast studios, and flagship retail venues. Surface treatments now suppress glare, while panel depths drop below 40 mm for flush wall integration.
Corporate real estate sponsors value such slim profiles that preserve floor space and align with contemporary workplace design. Smart-building sensors embedded in the cabinets further broaden the use case to occupancy analytics and environmental monitoring. These multifunctional benefits heighten the indoor business case, positioning the LED display market as a full-stack workplace solution rather than a pure visual medium.
Conventional SMD architectures retained 77.20% of 2025 shipments, benefiting from decades-long supply chains and proven reliability. Mini-LED adds mid-market flexibility, yet Micro-LED's 8.75% forecast CAGR reflects rising appetite for performance extremes such as 10-million-nit green pixels that enable clear automotive head-up display. Laser lithography and wafer-level bonding promise future cost deflation, but near-term output remains skewed to luxury home cinema, aerospace cockpits, and augmented-reality wearables.
The ecosystem now resembles a tiered pyramid. SMD fulfills broad commercial rollouts, Mini-LED addresses premium mid-tier signage, and Micro-LED defines pinnacle applications where power efficiency and contrast overshadow price sensitivity. As yields improve, the LED display market size for Micro-LED products is likely to widen beyond prestige niches, expanding addressable revenues across automotive, defense, and specialty retail environments.
Complete Report Scope:
- By Installation Type
- Fixed LED Display
- Rental/Mobile LED Display
- By Display Type
- Outdoor LED Display
- Indoor LED Display
- By Technology
- Conventional SMD LED
- Micro-LED
- Mini-LED
- OLED
- Chip-on-Board (COB) LED
- By Pixel Pitch
- Sub and Up to 1.5 mm (Fine Pixel Pitch)
- 1.6 - 2.9 mm
- 3 - 6 mm
- Above 6 mm
- By Color Display
- Monochrome
- Tricolor
- Full Color
- By Screen Size
- Less than 10 Square Meter
- 10 - 50 Square Meter
- Above 50 Square Meter
- By Application
- Advertising and Media
- Sports and Stadiums
- Transportation and Traffic Control
- Retail and Hospitality
- Corporate and Control Rooms
- Education and Healthcare
- Public Spaces and Smart-City Furniture
- By End-use Industry
- Commercial
- Government and Defense
- Industrial
- Entertainment
- By Geography
- North America
- United States
- Canada
- Mexico
- Europe
- Germany
- United Kingdom
- France
- Italy
- Spain
- Rest of Europe
- Asia-Pacific
- China
- Japan
- South Korea
- India
- South East Asia
- Rest of Asia-Pacific
- South America
- Brazil
- Rest of South America
- Middle East and Africa
- Middle East
- United Arab Emirates
- Saudi Arabia
- Rest of Middle East
- Africa
- South Africa
- Rest of Africa
- Middle East
- North America
Geography Analysis
Asia Pacific generated 47.60% of global revenue in 2025 thanks to China's dominance in production and domestic deployment. The region hosts roughly 80% of worldwide manufacturing capacity, enabling economies of scale that compress unit pricing while funding rapid R&D release cycles. China's LED display market size is projected to reach 660 billion RMB in 2024, expanding at 15.79% annual compound growth, significantly ahead of global averages. Tier-2 Chinese cities fuel sustained DOOH rollouts, while India and Indonesia import economical modules for civic projects, further amplifying regional momentum.
North America and Europe remain centers of premium innovation. U.S. sports arenas, film production sets, and corporate lobbies anchor demand for Micro-LED, Mini-LED, and fine-pitch modules that meet broadcast-grade color accuracy. EU energy directives push manufacturers to optimize power consumption and recyclability, spurring breakthroughs in driver circuitry and recyclable aluminum chassis designs. Although shipment volumes lag Asia, average selling prices stay higher, securing substantial profit pools for vendors with advanced manufacturing know-how.
The Middle East and Africa region, though smaller, represents the fastest growth trajectory at 6.78% CAGR between 2026 and 2031. GCC states, particularly Saudi Arabia and the UAE, allocate sizeable capital to security control rooms, smart-city displays, and hospitality projects that double as national prestige landmarks. Philips Professional Display Solutions' 2024 introduction of a full LED portfolio illustrates the region's maturation as a viable commercial hub. African metros follow gradually, leveraging mobile network operators' digital-out-of-home ambitions to leapfrog legacy static signage. Across these emerging markets, premium positioning and turnkey service offerings often outweigh price as the decisive selection criteria.
- Samsung Electronics Co. Ltd.
- LG Electronics Inc.
- Leyard Optoelectronic Co. Ltd.
- Unilumin Group Co. Ltd.
- Absen Optoelectronics Co. Ltd.
- Daktronics Inc.
- Barco NV
- Sony Group Corp.
- Toshiba Corp.
- Panasonic Holdings Corp.
- NEC Corp.
- Planar Systems Inc.
- Christie Digital Systems USA Inc.
- ROE Visual Co. Ltd.
- AOTO Electronics Co. Ltd.
- Infiled Electronics Co. Ltd.
- Liantronics Co. Ltd.
- Lighthouse Technologies Ltd.
- ViewSonic Corp.
- Delta Electronics Inc.
- Sansi Technology Co. Ltd.
Additional Benefits:
- The market estimate (ME) sheet in Excel format
- 3 months of analyst support
TABLE OF CONTENTS
1 INTRODUCTION
- 1.1 Study Assumptions and Market Definition
- 1.2 Scope of the Study
2 RESEARCH METHODOLOGY
3 EXECUTIVE SUMMARY
4 MARKET LANDSCAPE
- 4.1 Market Overview
- 4.2 Market Drivers
- 4.2.1 Shift to Fine-Pixel-Pitch Indoor Walls in Gulf Cooperation Council Countries Control Rooms
- 4.2.2 Rapid Adoption of Digital-Out-of-Home (DOOH) advertising in Tier-2 Chinese Cities
- 4.2.3 Stadium-Scale LED Megascreens Driving United States Sports Franchises' Fan-Engagement
- 4.2.4 Surge in Traffic-Management Variable-Message Signs (VMS) Installations Across ASEAN Smart-City Corridors
- 4.2.5 8K-Ready Broadcast Studios Upgrading to Direct-View LED in Europe
- 4.2.6 Energy-Efficient Mini-LED Retrofits in Japanese Retail Chains
- 4.3 Market Restraints
- 4.3.1 High CapEx for Micro-LED Mass-Transfer Equipment
- 4.3.2 Supply Bottlenecks of Red and Green Micro Chips Sub 10 µm
- 4.3.3 Regulatory Limits on Digital-Signage Brightness in EU City Centers
- 4.3.4 Skilled-Installer Shortage in Sub-Saharan Africa
- 4.4 Industry Ecosystem Analysis
- 4.5 Technological Outlook
- 4.6 Porter's Five Forces Analysis
- 4.6.1 Bargaining Power of Suppliers
- 4.6.2 Bargaining Power of Buyers
- 4.6.3 Threat of New Entrants
- 4.6.4 Threat of Substitutes
- 4.6.5 Competitive Rivalry
5 MARKET SIZE AND GROWTH FORECASTS (VALUES)
- 5.1 By Installation Type
- 5.1.1 Fixed LED Display
- 5.1.2 Rental/Mobile LED Display
- 5.2 By Display Type
- 5.2.1 Outdoor LED Display
- 5.2.2 Indoor LED Display
- 5.3 By Technology
- 5.3.1 Conventional SMD LED
- 5.3.2 Micro-LED
- 5.3.3 Mini-LED
- 5.3.4 OLED
- 5.3.5 Chip-on-Board (COB) LED
- 5.4 By Pixel Pitch
- 5.4.1 Sub and Up to 1.5 mm (Fine Pixel Pitch)
- 5.4.2 1.6 - 2.9 mm
- 5.4.3 3 - 6 mm
- 5.4.4 Above 6 mm
- 5.5 By Color Display
- 5.5.1 Monochrome
- 5.5.2 Tricolor
- 5.5.3 Full Color
- 5.6 By Screen Size
- 5.6.1 Less than 10 Square Meter
- 5.6.2 10 - 50 Square Meter
- 5.6.3 Above 50 Square Meter
- 5.7 By Application
- 5.7.1 Advertising and Media
- 5.7.2 Sports and Stadiums
- 5.7.3 Transportation and Traffic Control
- 5.7.4 Retail and Hospitality
- 5.7.5 Corporate and Control Rooms
- 5.7.6 Education and Healthcare
- 5.7.7 Public Spaces and Smart-City Furniture
- 5.8 By End-use Industry
- 5.8.1 Commercial
- 5.8.2 Government and Defense
- 5.8.3 Industrial
- 5.8.4 Entertainment
- 5.9 By Geography
- 5.9.1 North America
- 5.9.1.1 United States
- 5.9.1.2 Canada
- 5.9.1.3 Mexico
- 5.9.2 Europe
- 5.9.2.1 Germany
- 5.9.2.2 United Kingdom
- 5.9.2.3 France
- 5.9.2.4 Italy
- 5.9.2.5 Spain
- 5.9.2.6 Rest of Europe
- 5.9.3 Asia-Pacific
- 5.9.3.1 China
- 5.9.3.2 Japan
- 5.9.3.3 South Korea
- 5.9.3.4 India
- 5.9.3.5 South East Asia
- 5.9.3.6 Rest of Asia-Pacific
- 5.9.4 South America
- 5.9.4.1 Brazil
- 5.9.4.2 Rest of South America
- 5.9.5 Middle East and Africa
- 5.9.5.1 Middle East
- 5.9.5.1.1 United Arab Emirates
- 5.9.5.1.2 Saudi Arabia
- 5.9.5.1.3 Rest of Middle East
- 5.9.5.2 Africa
- 5.9.5.2.1 South Africa
- 5.9.5.2.2 Rest of Africa
- 5.9.5.1 Middle East
- 5.9.1 North America
6 COMPETITIVE LANDSCAPE
- 6.1 Market Concentration
- 6.2 Strategic Moves
- 6.3 Market Share Analysis
- 6.4 Company Profiles (includes Global-level Overview, Market-level Overview, Core Segments, Financials as available, Strategic Information, Market Rank/Share, Products and Services, Recent Developments)
- 6.4.1 Samsung Electronics Co. Ltd.
- 6.4.2 LG Electronics Inc.
- 6.4.3 Leyard Optoelectronic Co. Ltd.
- 6.4.4 Unilumin Group Co. Ltd.
- 6.4.5 Absen Optoelectronics Co. Ltd.
- 6.4.6 Daktronics Inc.
- 6.4.7 Barco NV
- 6.4.8 Sony Group Corp.
- 6.4.9 Toshiba Corp.
- 6.4.10 Panasonic Holdings Corp.
- 6.4.11 NEC Corp.
- 6.4.12 Planar Systems Inc.
- 6.4.13 Christie Digital Systems USA Inc.
- 6.4.14 ROE Visual Co. Ltd.
- 6.4.15 AOTO Electronics Co. Ltd.
- 6.4.16 Infiled Electronics Co. Ltd.
- 6.4.17 Liantronics Co. Ltd.
- 6.4.18 Lighthouse Technologies Ltd.
- 6.4.19 ViewSonic Corp.
- 6.4.20 Delta Electronics Inc.
- 6.4.21 Sansi Technology Co. Ltd.
7 MARKET OPPORTUNITIES AND FUTURE OUTLOOK
- 7.1 White-Space and Unmet-Need Assessment


