

|
시장보고서
상품코드
2120371
북미의 자동차 : 시장 점유율 분석, 업계 동향과 통계, 성장 예측(2026-2031년)North America Automotive - Market Share Analysis, Industry Trends & Statistics, Growth Forecasts (2026 - 2031) |
||||||
 Mordor Intelligence
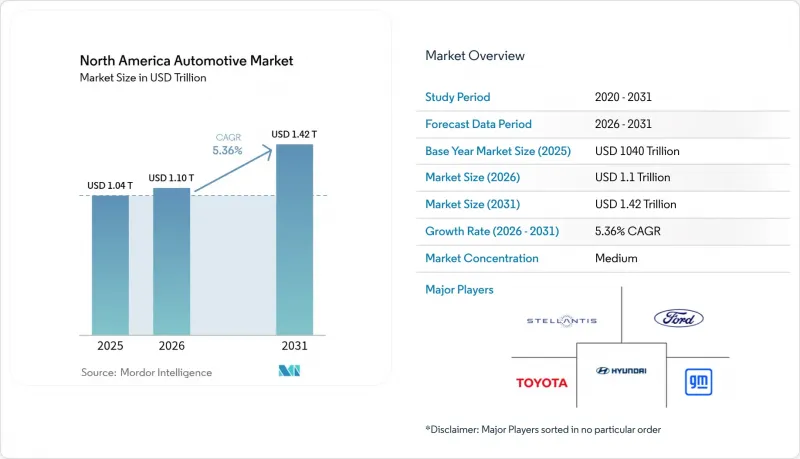
Mordor Intelligence에 따르면 북미의 자동차 시장 규모는 2025년에 1조 400억 달러로 평가되며, 2026년 1조 957억 달러에서 2031년까지 1조 4,222억 달러에 달할 것으로 예측되고 있으며, 예측 기간(2026-2031년)에 CAGR은 5.36%에 달할 전망입니다.
이 보고서는 차종(승용차, 소형 상용차 등), 구동 방식(내연기관(ICE) 등), 판매 채널(OEM 직영 딜러 등), 자동화 수준(레벨 0-1, 레벨 2, 레벨 3, 레벨 4-5), 그리고 국가(미국, 캐나다, 기타 북미 지역)별로 분류되어 있습니다. 시장 예측은 금액(달러) 및 판매 대수(단위)로 제시되어 있습니다.
북미 자동차 시장의 동향 및 인사이트
연방 및 주 차원의 ZEV 규제
캘리포니아주의 ‘Advanced Clean Cars II’ 규제는 2026년까지 제로 배출 차량의 판매 비율을 35%, 2035년까지 100%로 할 것을 의무화하고 있으며, 11개 주와 워싱턴 D.C.도 유사한 일정을 채택하고 있습니다. 캐나다의 연방 ZEV 규제 역시 2035년이라는 기한을 반영하고 있으며, 2026년과 2030년에는 각각 20% 및 60%라는 중간 목표가 설정되어 있습니다. 미국 환경보호청(EPA)이 제안한 규제안에서는 2030년까지 중대형 트럭 판매 대수의 30%를 제로 에미션 차량으로 하고, 2040년까지 100%로 끌어올릴 것을 요구하고 있습니다. 크레딧 뱅킹 제도를 통해 조기에 대응을 시작한 기업은 규정 준수를 통해 이익을 얻을 수 있는 반면, 대응이 늦어진 기업은 강화된 제재를 받게 됩니다. 따라서 이 규제 체계는 적극적인 전동화 투자를 장려하고, 북미 자동차 시장에 진출한 기업 전반에 걸쳐 공급업체의 재편을 가속화할 것입니다.
배터리 ‘오토 앨리’의 현지화
2023년 말 기준, 북미 배터리 공급망에 대한 누적 투자액은 2,500억 달러를 넘어섰으며, 셀 공장은 최종 조립 거점에서 중앙값으로 284마일 떨어진 곳에 위치해 있습니다. 지출의 약 절반은 셀 제조에 할당되어 있으며, 나머지는 상류 단계인 광물 가공과 하류 단계인 전기자동차 조립에 균등하게 분배됩니다. 캐나다는 2028년 가동을 예정하고 있는 혼다의 150억 캐나다 달러 규모의 통합 복합 단지에 힘입어 리튬이온 배터리 공급망 순위에서 1위로 부상했습니다. BMW의 8억 달러 규모의 산 루이스 포토시 확장 계획 등 멕시코의 병행 프로젝트들은 USMCA(미국-멕시코-캐나다 협정)의 무역 적격성을 유지하면서 비용 경쟁력 있는 생산 능력을 확보하고 있습니다. 이 지역에 집적된 클러스터는 북미 자동차 시장 전체의 물류 비용과 관세 리스크를 경감시킵니다.
자동차 가격 급등으로 인한 구매 어려움
사상 최고치를 기록한 차량 가격은 월평균 지불액을 사상 최고 수준으로 끌어올려, 많은 일반 구매자들을 시장에서 멀어지게 하고 있습니다. 인센티브 증가는 이익률을 압박하는 한편, 구매 편의성을 회복시키는 데에는 미치지 못하고 있습니다. 2023년 이후 리스 비용이 급등하면서 소비자들은 중고차로 눈을 돌리고 있습니다. 이러한 어려움이 가장 심각한 분야는 배터리식 전기자동차(BEV) 모델로, 많은 가정에 있으며, 높은 초기 비용이 수명 주기 비용 절감 효과를 상쇄하고 있습니다. 금리 인하에 대한 기대가 호재로 작용하더라도, 가격에 대한 민감성으로 인해 북미 자동차 시장의 단기 판매량 증가에는 한계가 있을 것입니다.
부문 분석
중형·대형 상용차는 절대적인 판매 대수는 적지만, 2031년까지 연평균 성장률(CAGR) 8.22%로 확대되며 북미 자동차 시장에서 승용차가 차지하는 비중을 크게 웃도는 속도로 성장하고 있습니다. 캘리포니아주의 ‘첨단 청정 트럭 규정’이나 미국 환경보호청(EPA)의 제안과 같은 규제적 노력은 2040년까지 트럭 판매 대수를 100% 제로 배출로 전환하는 것을 목표로 하고 있습니다. 플릿 구매자들은 충전을 일원화할 수 있고 가동 주기를 예측할 수 있는 전기화를 적극적으로 도입하고 있습니다.
승용차는 2025년 매출의 68.63%를 계속 차지하고 있지만, 가격 압박과 규정 준수 관련 비용 증가에 직면해 있습니다. 여러 유형의 파워트레인을 지원할 수 있는 유연성을 갖춘 공장 설비의 재구축을 통해 제조사는 수요 변동에 따라 생산량을 조정할 수 있게 됩니다. 2035년까지 제로 배출 트럭의 총 소유 비용(TCO)이 동일한 수준에 도달함에 따라 투자는 상업용 분야로 더욱 이동할 것이며, 북미 자동차 시장의 이 부문에서 구조적인 성장이 더욱 강화될 것입니다.
2025년에는 내연기관 파워트레인이 82.11%의 점유율을 차지하겠지만, 최대 7,500달러의 청정 차량 세액 공제의 지원에 힘입어 배터리 전기자동차(BEV)는 연평균 성장률(CAGR) 9.58%로 점유율을 확대해 나갈 전망입니다. 하이브리드차량은 과도기적 기술로서의 역할을 하고 있으며, 포드사는 2024년에 하이브리드차량 판매 대수가 두 자릿수 성장을 기록했다고 보고했습니다.
플러그인 하이브리드차량은 장거리 운전자에게 주행 거리에 대한 안정감을 제공하는 동시에, 부분적인 전동화 요건도 충족시키고 있습니다. 수소연료전지차는 수소 인프라의 미비로 인해 여전히 틈새 시장으로 남아 있습니다. 추진 시스템의 다양화를 통해 자동차 제조사들은 자본 배분의 위험을 줄이면서, 진화하는 북미 자동차 시장의 핵심이 될 배터리 및 소프트웨어 플랫폼의 확장을 도모할 수 있습니다.
기타 혜택:
- 엑셀 형식의 시장 예측(ME) 시트
- 3개월간의 애널리스트 지원
자주 묻는 질문
목차
제1장 서론
제2장 조사 방법
제3장 개요
제4장 시장 구도
제5장 시장 규모와 성장 예측
제6장 경쟁 구도
제7장 시장 기회와 향후 전망
KSA 26.09.02According to Mordor Intelligence, the North America automotive market size was valued at USD 1040 billion in 2025 and estimated to grow from USD 1095.7 billion in 2026 to reach USD 1422.2 billion by 2031, at a CAGR of 5.36% during the forecast period (2026-2031).
This report is Segmented by Vehicle Type (Passenger Cars, Light Commercial Vehicles, and More), Propulsion Type (ICE, and More), Sales Channel (OEM-Franchised Dealer, and More), Level of Automation (Level 0-1, Level 2, Level 3, and Level 4-5), and Country (United States, Canada, Rest of North America). The Market Forecasts are Provided in Terms of Value (USD) and Volume in Units.
North America Automotive Market Trends and Insights
Federal and State ZEV Mandates
California's Advanced Clean Cars II regulation requires 35% zero-emission sales by 2026 and 100% by 2035; eleven additional states and Washington, D.C. have adopted identical timelines. Canada's federal ZEV rule mirrors the 2035 deadline with interim 20% and 60% milestones for 2026 and 2030, respectively. Proposed U.S. EPA limits push 30% zero-emission medium- and heavy-truck sales by 2030, rising to 100% by 2040. Credit banking lets early movers monetize compliance, whereas laggards face increasing penalties. The mandate architecture, therefore, rewards proactive electrification investments and accelerates supplier realignment across North America automotive market participants.
Battery "Auto-Alley" Localization
Cumulative North American battery supply-chain commitments topped USD 250 billion by end-2023, with cell plants positioned a median 284 miles from final assembly sites. Cell fabrication absorbs roughly half of the outlays, with upstream mineral processing and downstream EV assembly splitting the remainder. Canada rose first in the lithium-ion supply-chain ranking, buoyed by Honda's CAD 15 billion integrated complex slated for 2028. Parallel Mexican projects, such as BMW's USD 800 million San Luis Potosi expansion, secure cost-competitive capacity while preserving USMCA trade eligibility. Localized clusters mitigate logistics expense and tariff risk across the North America automotive market.
Vehicle Affordability Squeeze
Record transaction prices have pushed average monthly payments to historic highs, sidelining a swath of mainstream buyers. Rising incentives strain margins yet fail to restore affordability. Leasing costs have climbed sharply since 2023, nudging consumers toward used-vehicle substitutes. The pinch is most acute for battery-electric models whose upfront premiums outweigh lifetime savings for many households. Although falling interest-rate expectations offer relief, price sensitivity will cap near-term volume upside in the North America automotive market.
Other drivers and restraints analyzed in the detailed report include:
- NEVI-Funded EV-Charging Build-Out
- Software-Defined-Vehicle Revenue Model
- Peak-Hour "Charging-Queue" Anxiety
For complete list of drivers and restraints, kindly check the Table Of Contents.
Segment Analysis
Medium-and heavy-commercial vehicles, though smaller in absolute volume, expand at 8.22% CAGR through 2031, materially outpacing passenger cars' dominion in the North American automotive market. A regulatory push-California's Advanced Clean Trucks rule and U.S. EPA proposals-targets 100% zero-emission truck sales by 2040. Fleet buyers embrace electrification, where charging can be centralized and duty cycles predictable.
Passenger cars still anchor 68.63% 2025 revenue but contend with affordability pressures and rising compliance outlays. Plant retooling for multi-powertrain flexibility enables manufacturers to modulate output amid shifting demand. Total cost-of-ownership parity for zero-emission trucks by 2035 will further tilt investment toward commercial applications, reinforcing structural growth in this segment of the North America automotive market.
Internal-combustion powertrains command an 82.11% share in 2025; however, battery-electric vehicles will capture incremental gains at 9.58% CAGR, supported by up to USD 7,500 clean-vehicle tax credits. Hybrid models act as a bridge technology, with Ford reporting double-digit hybrid sales gains in 2024.
Plug-in hybrids provide range assurance for long-distance drivers while meeting partial electrification quotas. Fuel-cell offerings remain niche, limited by hydrogen infrastructure gaps. Propulsion diversification allows OEMs to de-risk capital allocation while scaling batteries and software platforms central to the evolving North America automotive market size.
Complete Report Scope:
- By Vehicle Type
- Passenger Cars
- Light Commercial Vehicles
- Medium & Heavy Commercial Vehicles
- Two-Wheelers
- By Propulsion Type
- Internal Combustion Engine (ICE)
- Hybrid Electric Vehicles (HEV)
- Plug-in Hybrid Vehicles (PHEV)
- Battery Electric Vehicles (BEV)
- Fuel-Cell Electric Vehicles (FCEV)
- Natural-Gas Vehicles (NGV)
- By Sales Channel
- OEM-Franchised Dealer Sales
- Direct-to-Consumer (Online)
- Fleet and Rental Sales
- By Level of Automation (Value)
- Level 0 - 1 (Basic / No ADAS)
- Level 2 (Partial Automation)
- Level 3 (Conditional Automation)
- Level 4 - 5 (High / Full Automation)
- By Country
- United States
- Canada
- Rest of North America
List of Companies Covered in this Report:
- General Motors Company
- Toyota Motor Corporation
- Ford Motor Company
- Stellantis N.V.
- Hyundai Motor Company
- Honda Motor Co., Ltd.
- Nissan Motor Co., Ltd.
- BMW AG
- Tesla, Inc.
- Volkswagen AG
- Mercedes-Benz Group AG
- Kia Corporation
- Subaru Corporation
- Mazda Motor Corporation
- Rivian Automotive, Inc.
- Lucid Group, Inc.
- BYD Company Ltd.
- Volvo Car Corporation
- Mitsubishi Motors Corporation
- Daimler Truck Holding AG
- PACCAR Inc.
- Navistar International Corp.
- Harley-Davidson, Inc.
- Yamaha Motor Co., Ltd.
Additional Benefits:
- The market estimate (ME) sheet in Excel format
- 3 months of analyst support
TABLE OF CONTENTS
1 Introduction
- 1.1 Study Assumptions and Market Definition
- 1.2 Scope of the Study
2 Research Methodology
3 Executive Summary
4 Market Landscape
- 4.1 Market Overview
- 4.2 Market Drivers
- 4.2.1 Federal and State ZEV Mandates
- 4.2.2 Falling Auto-Loan Rates and Pent-Up Demand
- 4.2.3 NEVI-Funded EV-Charging Build-Out
- 4.2.4 Light-Truck/SUV Mix Shift Lifts Margins.
- 4.2.5 Battery "Auto-Alley" Localization
- 4.2.6 Software-Defined-Vehicle Revenue Model
- 4.3 Market Restraints
- 4.3.1 Vehicle Affordability Squeeze
- 4.3.2 Chip and Battery-Grade Mineral Bottlenecks
- 4.3.3 Tariff Brinkmanship Under USMCA Review
- 4.3.4 Peak-Hour "Charging-Queue" Anxiety
- 4.4 Value / Supply-Chain Analysis
- 4.5 Regulatory Landscape
- 4.6 Technological Outlook
- 4.7 Porter's Five Forces
- 4.7.1 Threat of New Entrants
- 4.7.2 Bargaining Power of Buyers
- 4.7.3 Bargaining Power of Suppliers
- 4.7.4 Threat of Substitutes
- 4.7.5 Intensity of Competitive Rivalry
5 Market Size and Growth Forecasts
- 5.1 By Vehicle Type
- 5.1.1 Passenger Cars
- 5.1.2 Light Commercial Vehicles
- 5.1.3 Medium & Heavy Commercial Vehicles
- 5.1.4 Two-Wheelers
- 5.2 By Propulsion Type
- 5.2.1 Internal Combustion Engine (ICE)
- 5.2.2 Hybrid Electric Vehicles (HEV)
- 5.2.3 Plug-in Hybrid Vehicles (PHEV)
- 5.2.4 Battery Electric Vehicles (BEV)
- 5.2.5 Fuel-Cell Electric Vehicles (FCEV)
- 5.2.6 Natural-Gas Vehicles (NGV)
- 5.3 By Sales Channel
- 5.3.1 OEM-Franchised Dealer Sales
- 5.3.2 Direct-to-Consumer (Online)
- 5.3.3 Fleet and Rental Sales
- 5.4 By Level of Automation (Value)
- 5.4.1 Level 0 - 1 (Basic / No ADAS)
- 5.4.2 Level 2 (Partial Automation)
- 5.4.3 Level 3 (Conditional Automation)
- 5.4.4 Level 4 - 5 (High / Full Automation)
- 5.5 By Country
- 5.5.1 United States
- 5.5.2 Canada
- 5.5.3 Rest of North America
6 Competitive Landscape
- 6.1 Market Concentration
- 6.2 Strategic Moves
- 6.3 Market Share Analysis
- 6.4 Company Profiles (includes Global level Overview, Market level overview, Core Segments, Financials as available, Strategic Information, Market Rank/Share for key companies, Products & Services, and Recent Developments)
- 6.4.1 General Motors Company
- 6.4.2 Toyota Motor Corporation
- 6.4.3 Ford Motor Company
- 6.4.4 Stellantis N.V.
- 6.4.5 Hyundai Motor Company
- 6.4.6 Honda Motor Co., Ltd.
- 6.4.7 Nissan Motor Co., Ltd.
- 6.4.8 BMW AG
- 6.4.9 Tesla, Inc.
- 6.4.10 Volkswagen AG
- 6.4.11 Mercedes-Benz Group AG
- 6.4.12 Kia Corporation
- 6.4.13 Subaru Corporation
- 6.4.14 Mazda Motor Corporation
- 6.4.15 Rivian Automotive, Inc.
- 6.4.16 Lucid Group, Inc.
- 6.4.17 BYD Company Ltd.
- 6.4.18 Volvo Car Corporation
- 6.4.19 Mitsubishi Motors Corporation
- 6.4.20 Daimler Truck Holding AG
- 6.4.21 PACCAR Inc.
- 6.4.22 Navistar International Corp.
- 6.4.23 Harley-Davidson, Inc.
- 6.4.24 Yamaha Motor Co., Ltd.


