

|
시장보고서
상품코드
2120374
돼지 사료 : 시장 점유율 분석, 업계 동향과 통계, 성장 예측(2026-2031년)Swine Feed - Market Share Analysis, Industry Trends & Statistics, Growth Forecasts (2026 - 2031) |
||||||
 Mordor Intelligence
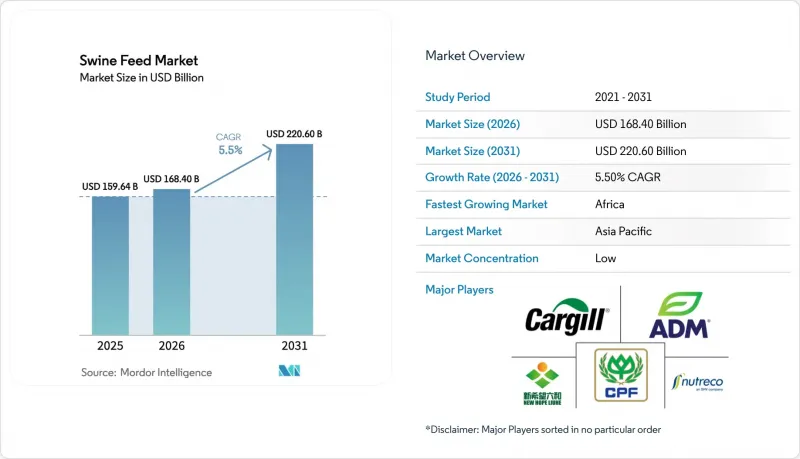
Mordor Intelligence에 따르면 돼지 사료 시장 규모는 2025년 1,596억 4,000만 달러, 2026년 1,684억 달러에서 2031년까지 2,206억 달러로 확대할 것으로 예측되고 있으며, 2026-2031년까지 사이 CAGR은 5.50%에 달할 전망입니다.
이 보고서는 원료(곡물, 곡물 제품별, 지방종자박, 유지, 당밀 등), 보충제(항생제, 비타민, 항산화제,아미노산, 효소, 산미료 등), 성장 단계별(스타터, 그로워, 피니셔) 및 지역별(북미, 유럽, 아시아태평양, 남미, 중동 및 아프리카)로 분류되어 있습니다. 시장 예측은 금액(달러) 기준으로 제시되어 있습니다.
세계 돼지 사료 시장의 동향 및 인사이트
사료용 효소를 통한 비용 효율성 향상
다중 효소 칵테일은 사료 전환율을 4-6% 개선합니다. 이는 옥수수 가격이 부셸당 6달러를 초과할 경우, 출하 돼지 1두당 8-12달러의 추가 이익에 해당합니다. 2025년부터 중국 각 성에서는 소화성 인의 기준치가 의무화되어, 사실상 등록된 모든 배합 사료에 피타아제 첨가가 요구됨에 따라 아시아태평양의 채택률이 35%를 넘는 수준으로 가속화되고 있습니다. 85°C의 펠릿화 공정을 견딜 수 있는 액상 안정형 제품이 신제품의 주류를 이루며, 기존의 기술적 장벽이 해소되었습니다. 유럽의 사료 제조업체에 따르면 성장기용 사료에서 효소의 투자 수익률(ROI)은 합성 아미노산을 상회하고 있으며, 특정 곡물 배합에 맞춘 맞춤형 블렌드에 대한 집중이 진행되고 있습니다. 효소 공급업체들은 특허로 보호된 내열성 변이체를 활용하여 경쟁 우위를 높이고 있으며, 매출 총이익률을 상품형 보충제의 8-10%에 비해 25% 수준으로 끌어올리고 있습니다. 이러한 기술의 물결은 남미로도 확산되고 있으며, 통합 기업은 농작물 가격 변동에 대한 비용 완충책을 모색하고 있으며, 중기적으로는 안정적인 수요가 유지될 전망입니다. 효소는 총 인의 배설량을 감소시켜 환경 규정 준수 목표 달성에 기여하므로 규제 당국의 반응은 계속해서 긍정적입니다.
마이코톡신 위험 관리 의무화
2025년에는 아플라톡신 및 데옥시니발레놀로 인한 손실이 전 세계에서 60억-180억 달러에 달함에 따라 규제 당국은 기준치를 강화할 수밖에 없었습니다. 유럽연합(EU)은 완전 사료내 아플라톡신 B1의 허용 한도를 15µg/kg로 낮춘 반면, 중국은성 경계에서 마이코톡신 무작위 검사를 시행하고 있으며, 과거에는 항구에서의 통관 절차에만 의존하던 수입업자들에게 업무상의 혼란을 초래하고 있습니다. 효모 세포벽 추출물 및 알루미노규산염 점토를 포함한 독소 흡착제의 출하량은 전년 대비 12% 증가하여, 첨가물 전체의 성장률을 상회했습니다. ISO 17025 인증 검사 기관의 처리 능력은 여전히 제약 요인으로 작용하고 있으며, 수확 성수기에는 7-10일이 소요되므로 제분업자들은 인증된 곡물의 가격 프리미엄을 수용할지, 아니면 거부당할 위험을 감수할지 선택해야 하는 상황에 처해 있습니다. 마이코톡신 함량이 낮음이 검증된 제분업체들은 수출용 육추용 사료에서 3-5%의 가격 프리미엄을 얻고 있습니다. 장비 공급업체들은 현장용 신속 검사 키트를 판매하고 있지만, 위음성률이 높기 때문에 실험실에서의 완전한 확인에 대한 수요는 여전히 지속되고 있습니다. 베트남과 필리핀에서 정부가 신속 검사 기술에 대한 보조금을 지원함에 따라 검출 시간이 단축되어, 아시아태평양 전체의 소규모 농가에서 도입이 확대될 가능성이 있습니다.
부문 분석
2025년, 곡물은 원료 점유율 58.4%를 유지하고 있으며, 이는 에너지 공급과 펠릿의 구조 형성이라는 두 가지 역할을 담당하고 있음을 반영합니다. 유럽에서는 현지 농업 사정이 우선시되므로 밀과 보리가 배합량의 35-40%를 차지하고 있지만, 아메리카 대륙과 아시아에서는 옥수수가 70% 이상을 차지하며 주류를 이루고 있습니다. 보충제 하위 부문은 시장 가치에서 차지하는 비중은 낮지만, 영양사들이 추가 비용을 상회하는 미미한 사료 전환율 개선을 추구하고 있으며, 연평균 성장률(CAGR) 6.5%로 성장하고 있습니다.
지방종자박은 큰 점유율을 차지하고 있지만, 비용이 비슷한 수준에 가까워짐에 따라 곤충 분말이나 단세포 단백질로의 점진적인 대체가 진행되고 있습니다. 곡물 제품별로는 곡물 가격이 정점에 달했을 때 비용 완화제 역할을 합니다. 그러나 영양 프로파일의 편차와 마이코톡신에 대한 민감도가 높기 때문에 프리미엄 배합 사료에서의 점유율은 제한적입니다. 유지류는 취급량은 적지만, 에너지 밀도와 분진 억제 두 측면에서 주목받고 있으며, 한편 당밀은 액체 급여 시스템의 보급을 배경으로 크게 성장하고 있습니다. 인캡슐레이션된 부티르산, 중쇄 트리글리세라이드, 오레가노 추출물 등의 고수익성 틈새 제품은 ‘기타’ 범주에 분류되며, 범용 첨가제의 매출 총이익률 5-8%에 비해 30-50%의 매출 총이익률을 기록하고 있습니다.
지역별 분석
2025년, 아시아태평양은 전 세계 돼지 사료 시장 가치의 46.3%를 차지했습니다. 이는 주로 전 세계 돼지 사육 두수의 약 절반에 해당하는 약 4억-4억 5,000만 마리에 달하는 중국의 돼지 사육 두수에 힘입은 결과입니다[3]. 이 지역의 시장은 베트남과 필리핀 등 국가들의 산업화 진전에 힘입어 2031년까지 높은 연평균 성장률(CAGR)로 확대될 것으로 예측됩니다. 이들 국가에서는 소규모 농가가 500-1,000두 규모의 상업적 양돈 경영으로 전환하고 있으며, 농장에서 혼합한 사료 대신 품질이 안정적인 배합 사료에 대한 수요가 발생하고 있습니다. 아프리카돼지열병(ASF)에서 회복 중인 중국에서는 생물 보안과 추적 가능성이 중시되고 있으며, 뉴호프 그룹이나 광동 하이더 그룹과 같은 대규모 통합 기업에 혜택을 주는 한편, 마을 단위의 제분소에 대한 의존도는 낮아지고 있습니다. 그러나 지역별 분산화는 여전히 과제로 남아 있습니다. 예를 들어 인도네시아와 태국에서는 농장내 자가 배합 비율이 30-40%에 그치고 있으며, 이것이 시판 사료의 보급을 저해하고 있습니다. 이는 비용 의식이 높은 생산자들에게 투자 수익률(ROI)을 효과적으로 제시할 수 있는 공급업체에게 비즈니스 기회가 됩니다.
남미는 브라질의 돼지고기 수출 능력 확대와 아르헨티나의 동물 영양 관련 규제 현대화에 힘입어 가장 빠르게 성장하는 지역 중 하나로 부상하고 있습니다. 브라질의 돼지고기 수출량은 2025년에 6.6% 증가하여 122만 톤에 달할 것으로 예상되며, 사육 사업을 지원하고 국내 및 국제 수요를 충족시키기 위해서는 국내 사료 생산을 약 2.8% 확대해야 합니다. 이 지역의 경쟁 우위는 낮은 인건비와 사료 비용에서 비롯되며, GSI와 같은 기업은 사체 처리 시스템을 위한 자동화 솔루션 확장을 통해 5년 이내에 약 2억 달러의 매출을 목표로 하고 있습니다.
아프리카는 시장의 상당 부분을 차지하고 있지만, 도시화, 돼지고기 수요 증가, 인프라의 점진적인 개선에 힘입어 연평균 성장률(CAGR) 6.9%라는 세계 최고 속도로 성장하고 있습니다. 남아프리카공화국과 나이지리아는 이 지역 사료 수요의 60%를 차지하고 있습니다. 도시화와 단백질 소비량 증가가 성장을 지원하고 있는 반면, 전력 공급의 불안정성, 콜드 체인 시스템의 미비, 유통 네트워크의 파편화 등의 과제로 인해 상업용 사료의 보급률은 돼지 생산 총량의 25-30%에 그치고 있습니다. 그러나 물류가 개선됨에 따라 추가적인 확장을 위한 큰 기회가 남아 있습니다.
기타 혜택:
- 엑셀 형식의 시장 예측(ME) 시트
- 3개월간의 애널리스트 지원
자주 묻는 질문
목차
제1장 서론
제2장 조사 방법
제3장 개요
제4장 시장 구도
제5장 시장 규모와 성장 예측
제6장 경쟁 구도
제7장 시장 기회와 향후 전망
KSA 26.09.02According to Mordor Intelligence, the swine feed market size is projected to expand from USD 159.64 billion in 2025 and USD 168.40 billion in 2026 to USD 220.60 billion by 2031, registering a CAGR of 5.50% between 2026 to 2031.
This report is Segmented by Ingredients (Cereals, Cereals by Products, Oilseed Meal, Oils, Molasses, and More), by Supplements (Antibiotics, Vitamins, Antioxidants, Amino Acids, Enzymes, Acidifiers, and More), by Life Stage (Starter, Grower, and Finisher) and by Geography (North America, Europe, Asia-Pacific, South America, Middle East and Africa). The Market Forecasts are Provided in Terms of Value (USD).
Global Swine Feed Market Trends and Insights
Feed Enzyme Cost-Efficiency Gains
Multi-enzyme cocktails deliver a 4-6% feed-conversion improvement, equivalent to a USD 8-12 extra margin per finished pig when corn exceeds USD 6 per bushel. Chinese provinces mandated digestible-phosphorus thresholds in 2025, effectively requiring phytase in every registered formula and accelerating adoption beyond 35% penetration levels in the Asia-Pacific region. Liquid-stable formats that withstand 85 °C pelleting now dominate launches, eliminating a former technical barrier. European feed mills report that enzyme ROI surpasses that of synthetic amino acids in grower diets, shifting their focus toward customized blends that match specific grain matrices. Enzyme suppliers leverage patent-protected thermostable variants, improving competitive insulation and nudging margins toward 25% gross levels compared with 8-10% for commodity supplements. The technology cascade arrives in South America as integrators seek cost buffers against crop-price swings, sustaining steady demand over the medium term. Regulatory acceptance remains favorable because enzymes lower total phosphorus excretion, supporting environmental compliance targets.
Mycotoxin Risk-Management Mandates
Aflatoxin and deoxynivalenol losses reached USD 6-18 billion globally in 2025, prompting regulators to tighten thresholds. The European Union has reduced aflatoxin B1 limits in complete feed to 15 µg/kg, while China imposes random mycotoxin checks at provincial borders, creating operational disruptions for importers that once relied solely on port clearance. Toxin-binder volumes, encompassing yeast cell wall extracts and aluminosilicate clays, expanded 12% year on year, outpacing overall additive growth. The ISO 17025 laboratory capacity remains a constraint; a seven- to ten-day turnaround during harvest peaks forces mills to choose between accepting price premiums on certified grain and incurring rejection risk. Mills achieving verified low-mycotoxin status command 3-5% price premiums in export-oriented nursery feeds. Equipment vendors market on-site rapid test kits, but their higher false-negative rates keep full-lab confirmation in demand. Government subsidies for rapid-test technology in Vietnam and the Philippines could shorten detection times and broaden adoption among smallholders across the Asia-Pacific region.
Other drivers and restraints analyzed in the detailed report include:
- Precision-Feeding Sensor Adoption
- Antibiotic-Reduction Policies
- Volatile Corn and Soybean Prices
- Tight Vitamin A and E Supply Chains
For complete list of drivers and restraints, kindly check the Table Of Contents.
Segment Analysis
Cereals maintained 58.4% ingredient share in 2025, reflecting their dual role in supplying energy and pellet structure. Wheat and barley account for 35-40% of European inclusion, where local agronomics prevail, while corn dominates at over 70% in the Americas and Asia. The supplements sub-segment, although accounting for a low share of the value, is growing at a 6.5% CAGR as nutritionists seek marginal feed-conversion improvements that outweigh the additional cost.
Oilseed meals hold a major share but face gradual substitution by insect meal and single-cell proteins as cost parity nears. Cereal by-products serve as cost buffers when grain prices peak. However, variable nutrient profiles and higher mycotoxin susceptibility limit their share of the premium formula. Oils and fats, though small by tonnage, earn attention for both energy density and dust suppression, while molasses grows significantly on the back of liquid-feeding systems. High-margin niche items, such as encapsulated butyrate, medium-chain triglycerides, and oregano extract, cluster in the "Others" basket and deliver gross margins of 30-50%, compared with commodity additions' 5-8%.
Complete Report Scope:
- By Ingredient Type
- Cereals
- Cereal By-products
- Oilseed Meals
- Oil
- Molasses
- Supplements
- Others
- By Supplement Type
- Vitamins
- Amino Acids
- Antibiotics
- Enzymes
- Anti-oxidants
- Acidifiers
- Probiotics and Prebiotics
- Others
- By Life Stage
- Starter
- Grower
- Finisher
- By Geography
- North America
- United States
- Canada
- Mexico
- Rest of North America
- South America
- Brazil
- Argentina
- Rest of South America
- Europe
- Germany
- Spain
- Russia
- Rest of Europe
- Asia-Pacific
- China
- Vietnam
- Philippines
- Rest of Asia-Pacific
- Middle East
- Saudi Arabia
- Iran
- Rest of Middle East
- Africa
- South Africa
- Nigeria
- Rest of Africa
- North America
Geography Analysis
In 2025, the Asia-Pacific region accounted for 46.3% of the global swine feed market value, primarily driven by China's hog inventory of approximately 400-450 million heads, which represents around half of the global swine population[3]. The market in this region is projected to grow at a significant CAGR through 2031, driven by increasing industrialization in countries such as Vietnam and the Philippines. In these nations, smallholder farms are transitioning to commercial operations with 500-1,000 heads, creating demand for consistent, formulated feeds instead of farm-mixed rations. China's recovery from African Swine Fever (ASF) emphasizes biosecurity and traceability, benefiting large-scale integrators such as New Hope Group and Guangdong Haid Group, while reducing reliance on village-level mills. However, regional fragmentation remains a challenge. For instance, Indonesia and Thailand continue to have on-farm mixing rates of 30-40%, which limits the penetration of commercial feed. This presents opportunities for suppliers who can effectively demonstrate return on investment (ROI) to cost-conscious producers.
South America emerges as one of the fastest-growing regions, propelled by Brazil's expanding pork export capacity and Argentina's regulatory modernization in animal nutrition. Brazil's pork exports are projected to increase by 6.6% in 2025 to 1.22 million tons, necessitating domestic feed production growth of approximately 2.8% to support breeding operations and meet both domestic and international demand. The region's competitive advantage stems from low labor and feed costs, with companies like GSI targeting nearly USD 200 million in revenue within five years through the expansion of automation solutions for post-harvest systems.
Africa accounts for a good share of the market but is growing at a 6.9% CAGR, the fastest globally, driven by urbanization, increasing pork demand, and gradual improvements in infrastructure. South Africa and Nigeria contribute 60% of the region's feed demand. While urbanization and rising protein consumption support growth, challenges such as unreliable electricity, inadequate cold chain systems, and fragmented distribution networks restrict commercial feed penetration to 25-30% of total swine production. However, as logistics improve, significant opportunities for expansion remain.
- Cargill Incorporated
- New Hope Group Co. Ltd.
- Charoen Pokphand Foods PCL (CP Group)
- Archer Daniels Midland Company
- Nutreco N.V. (SHV Holdings)
- Purina Animal Nutrition LLC (Land O'Lakes, Inc.)
- Alltech, Inc
- De Heus Animal Nutrition
- ForFarmers Group
- Guangdong Haid Group Co., Ltd.
- Wens Foodstuff Group Co., Ltd.
- Kent Nutrition Group (Kent Corporation)
- FEED ONE CO., LTD (Mitsubishi Corporation)
- Adisseo (China National Bluestar (Group) Co., Ltd.)
- CJ CheilJedang (CJ Group)
Additional Benefits:
- The market estimate (ME) sheet in Excel format
- 3 months of analyst support
TABLE OF CONTENTS
1 Introduction
- 1.1 Study Assumptions and Market Definition
- 1.2 Scope of the Study
2 Research Methodology
3 Executive Summary
4 Market Landscape
- 4.1 Market Overview
- 4.2 Market Drivers
- 4.2.1 Feed enzyme cost-efficiency gains
- 4.2.2 Mycotoxin risk-management mandates
- 4.2.3 Precision-feeding sensor adoption
- 4.2.4 Antibiotic-reduction policies
- 4.2.5 ASF-related bio-security investments
- 4.2.6 Carbon-footprint labeling by packers
- 4.3 Market Restraints
- 4.3.1 Volatile corn and soybean prices
- 4.3.2 Tight vitamin-A and E supply chains
- 4.3.3 Regulatory delays on novel additives
- 4.3.4 Consumer pushback on gene-edited grains
- 4.4 Regulatory Landscape
- 4.5 Technological Outlook
- 4.6 Porter's Five Forces Analysis
- 4.6.1 Threat of New Entrants
- 4.6.2 Bargaining Power of Suppliers
- 4.6.3 Bargaining Power of Buyers
- 4.6.4 Threat of Substitutes
- 4.6.5 Intesity of Competitive Rivalry
5 Market Size and Growth Forecasts (Value)
- 5.1 By Ingredient Type
- 5.1.1 Cereals
- 5.1.2 Cereal By-products
- 5.1.3 Oilseed Meals
- 5.1.4 Oil
- 5.1.5 Molasses
- 5.1.6 Supplements
- 5.1.7 Others
- 5.2 By Supplement Type
- 5.2.1 Vitamins
- 5.2.2 Amino Acids
- 5.2.3 Antibiotics
- 5.2.4 Enzymes
- 5.2.5 Anti-oxidants
- 5.2.6 Acidifiers
- 5.2.7 Probiotics and Prebiotics
- 5.2.8 Others
- 5.3 By Life Stage
- 5.3.1 Starter
- 5.3.2 Grower
- 5.3.3 Finisher
- 5.4 By Geography
- 5.4.1 North America
- 5.4.1.1 United States
- 5.4.1.2 Canada
- 5.4.1.3 Mexico
- 5.4.1.4 Rest of North America
- 5.4.2 South America
- 5.4.2.1 Brazil
- 5.4.2.2 Argentina
- 5.4.2.3 Rest of South America
- 5.4.3 Europe
- 5.4.3.1 Germany
- 5.4.3.2 Spain
- 5.4.3.3 Russia
- 5.4.3.4 Rest of Europe
- 5.4.4 Asia-Pacific
- 5.4.4.1 China
- 5.4.4.2 Vietnam
- 5.4.4.3 Philippines
- 5.4.4.4 Rest of Asia-Pacific
- 5.4.5 Middle East
- 5.4.5.1 Saudi Arabia
- 5.4.5.2 Iran
- 5.4.5.3 Rest of Middle East
- 5.4.6 Africa
- 5.4.6.1 South Africa
- 5.4.6.2 Nigeria
- 5.4.6.3 Rest of Africa
- 5.4.1 North America
6 Competitive Landscape
- 6.1 Market Concentration
- 6.2 Strategic Moves
- 6.3 Market Share Analysis
- 6.4 Company Profiles (includes Global Level Overview, Market Level Overview, Core Segments, Financials as Available, Strategic Information, Market Rank/Share for Key Companies, Products and Services, and Recent Developments)
- 6.4.1 Cargill Incorporated
- 6.4.2 New Hope Group Co. Ltd.
- 6.4.3 Charoen Pokphand Foods PCL (CP Group)
- 6.4.4 Archer Daniels Midland Company
- 6.4.5 Nutreco N.V. (SHV Holdings)
- 6.4.6 Purina Animal Nutrition LLC (Land O'Lakes, Inc.)
- 6.4.7 Alltech, Inc
- 6.4.8 De Heus Animal Nutrition
- 6.4.9 ForFarmers Group
- 6.4.10 Guangdong Haid Group Co., Ltd.
- 6.4.11 Wens Foodstuff Group Co., Ltd.
- 6.4.12 Kent Nutrition Group (Kent Corporation)
- 6.4.13 FEED ONE CO., LTD (Mitsubishi Corporation)
- 6.4.14 Adisseo (China National Bluestar (Group) Co., Ltd.)
- 6.4.15 CJ CheilJedang (CJ Group)


