

|
시장보고서
상품코드
2120766
웨어러블 모션 센서 : 시장 점유율 분석, 업계 동향과 통계, 성장 예측(2026-2031년)Wearable Motion Sensors - Market Share Analysis, Industry Trends & Statistics, Growth Forecasts (2026 - 2031) |
||||||
 Mordor Intelligence
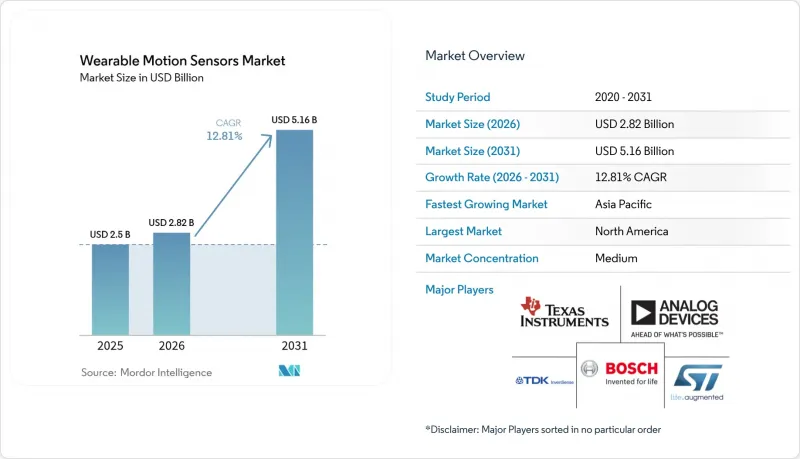
Mordor Intelligence에 의하면, 2026년 웨어러블 모션 센서 시장 규모는 28억 2,000만 달러로 추정되며, 2025년 25억 달러에서 성장하여 2031년에는 51억 6,000만 달러에 달할 것으로 예측됩니다.
또한 2026-2031년 연평균 성장률(CAGR)은 12.81%를 나타낼 것으로 전망됩니다.
본 보고서는 유형별(가속도계, 자이로스코프, 자력계 등), 용도별(피트니스 밴드, 활동량계, 스마트웨어 등), 최종 사용자별(헬스케어, 소비자 가전, 산업용, 군용 등), 전력 소비량별(초저전력(1mW 미만),표준 전력 소비(10-50mW) 등) 및 지역별로 분류되어 있습니다. 시장 전망은 금액(달러) 기준으로 제시되어 있습니다.
전 세계 웨어러블 모션 센서 시장 동향 및 인사이트
AI를 활용한 센서 퓨전이 의료용 웨어러블 기기를 주도
센서 상의 AI와 다축 관성 데이터를 통합함으로써, 일반 소비자용 기기가 임상 등급의 모니터로 변모하고 있으며, 파킨슨병 및 기타 신경운동 장애와 관련된 미세한 보행 변화나 진전을 신뢰성 있게 감지할 수 있게 되었습니다. 연구에 따르면, 초기 파킨슨병의 진전과 본태성 진전을 구별하는 정확도가 84%에 달하며, 이러한 성과로 인해 재택에서의 지속적인 케어 모델이 확대되고, 간헐적인 임상 평가에 대한 의존도가 낮아지고 있습니다. 알고리즘을 활용한 진단에 대한 보험사의 수용도가 높아짐에 따라 병원 내 도입이 가속화되는 한편, 소비자용 브랜드는 생태계 내 구독 서비스에 사용자를 유지하기 위해 의료 기능을 추가하고 있습니다.
일본 및 한국의 고령자 돌봄용 서브밀리와트급 MEMS
전력 소비량이 1mW 미만인 센서는 충전 없이도 수 주간 작동할 수 있어, 기기 관리를 소홀히 하기 쉬운 고령 이용자에게 필수적인 요건이 되고 있습니다. 일본의 요양보험 제도에서는 이러한 센서를 통해 낙상 자동 신고 및 일상 활동 프로파일링이 가능해짐에 따라 입원 건수가 23% 감소했습니다. 한국의 민관 공동 시범 사업에서도 유사한 효과가 나타나, 지역 의료 네트워크 전반으로의 확대가 촉진됨과 동시에 중국의 ‘재택 고령화’ 이니셔티브에 대한 지역적 수요 확산도 이끌어내고 있습니다.
진전 감별에서 알고리즘의 한계
현재의 비지도 학습 모델에서는 다중 클래스 분류를 통한 진전 중증도 분류의 정확도가 57.1%에 그치고 있어, 임상적 임계값을 크게 밑돌고 있기 때문에 신경학적 웨어러블 기기에 대한 보험 적용이 제한되고 있습니다. 데이터셋의 규모가 작고 다양하며, 실제 환경에서 발생하는 노이즈가 많아 발전이 저해되고 있어, 유망한 연구용 프로토타입이 존재함에도 불구하고 병원 내 도입은 지연되고 있습니다.
부문 분석
웨어러블 모션 센서 시장에서는 2025년에도 가속도계가 31.65%의 점유율을 유지하며, 활동 추적기, 제스처 인터페이스 및 기본적인 낙상 감지를 뒷받침하고 있습니다. 이러한 우위는 성숙한 비용 곡선과 마이크로암페어 단위의 낮은 전력 소비(슬립 전류)를 반영합니다. 대조적으로, MEMS 콤보 센서는 가속도계, 자이로스코프, 자력계의 기능을 단일 ASIC 내에 통합함으로써 기판 수준의 집적화를 줄여 14.12%의 연평균 성장률(CAGR)을 기록하고 있습니다. 예를 들어, ST 마이크로일렉트로닉스의 LSM6DSV16BX는 6축 IMU 외에도, 웨어러블 기기에서 골전도 기반의 명령 제어를 위한 오디오 가속도계를 내장하고 있습니다. 콤보 센서를 채택함으로써 디스크리트 IMU와의 성능 격차가 좁혀지는 한편, 전력 소비가 감소하기 때문에 소형 반지나 의료용 패치에 최적입니다.
자이로스코프는 AR/VR 헤드셋에서 1도 미만의 정밀도로 자세를 측정하고, 고도의 생체역학 분석을 지원하지만, 소비 전력이 밀리와트 단위로 높기 때문에 각 벤더사는 듀티 사이클 제어 모드와 예측 알고리즘을 결합하여 1회 충전당 가동 시간을 연장하고 있습니다. 자력계는 GPS의 멀티패스 현상을 회피하는 아웃도어 스포츠용 손목시계에 필수적인 절대 방위 정보를 제공합니다. 압력 센서는 규모는 작지만 중요한 틈새 시장으로, 계단 오르내림 횟수 측정이나 수영 랩 깊이 측정을 위해 고도 변화를 보정합니다. 미래를 내다보는 로드맵에서는 운동 축에 더해 생체 전위 및 화학 센서가 통합되어 있으며, 관성 데이터와 생리 데이터가 통합된 센서 노드 내에서 융합되는 미래를 시사하고 있어, 이를 통해 웨어러블 모션 센서 시장은 더욱 강화될 것입니다.
2025년에는 피트니스 밴드가 용도 매출의 23.35%를 차지할 것으로 예상되며, 이는 확립된 브랜드 생태계, 낮은 진입 장벽, 그리고 구독형 분석 서비스의 교차 판매의 혜택을 받고 있습니다. 그러나 섬유에 내장된 센서 실은 모니터링의 장을 가제트에서 의류로 전환시켜, 2031년까지 연평균 성장률(CAGR) 14.37%를 견인할 것으로 전망됩니다. 전도성 실과 인쇄된 신축성 센서를 통해 일상적인 활동 중 관절의 운동학, 자세, 호흡수를 추적하는 셔츠가 실현되어, 사용자는 전용 기기에서 해방될 것입니다.
AR/VR 헤드셋은 여전히 고성장 분야이며, 몰입형 시뮬레이션에는 밀리초 미만의 지연 시간으로 자세가 업데이트되어야 합니다. 이어웨어에는 핸즈프리 통화를 위한 머리 제스처 감지 기능이 통합되어 있으며, 스마트 링은 초소형 폼 팩터로 수면 단계 분석을 실현합니다. 원단 내 모션 센싱과 전기화학 센싱의 융합을 통해 건강 대시보드의 측정 항목은 수분 섭취, 전해질 손실, 열 스트레스 등의 매개변수까지 확대되었으며, 이는 원활한 경험이 웨어러블 모션 센서 시장을 ‘신기함’의 단계를 넘어 지속적으로 확장시키고 있음을 여실히 보여주고 있습니다.
지역별 분석
북미는 2025년 매출의 42.15%를 차지하며, 원격 활동 모니터링을 주류 치료 과정에 정착시키는 메디케어(Medicare)의 환급 개혁이 주도적인 역할을 하고 있습니다. 이 지역의 벤처 생태계는 엣지 AI용 실리콘으로 자본을 유도하는 한편, 개인정보 보호 관련 법규로 인해 벤더들은 온디바이스 추론으로 방향을 전환하며 사용자의 신뢰를 유지하고 있습니다. 공급 제약은 국내 MEMS 생산 라인을 우선시하는 니어쇼어링 정책과 국방생산법에 따른 인센티브를 통해 완화되고 있습니다.
아시아태평양은 2031년까지 연평균 성장률(CAGR) 16.32%로 가장 높은 성장률을 기록하고 있습니다. 이는 에너지 수확 아키텍처를 채택한 중국의 Tier 2 팹(fab)과, 노인 주거 시설에 모션 태그를 통합한 한국의 스마트 시티 실증 실험을 반영한 것입니다. 정부 보조금이 초기 부품 원가(BOM)의 높음을 상쇄하는 한편, 기능이 풍부한 웨어러블 제품에 대한 소비자 수요는 줄어들 기미를 보이지 않습니다. 일본의 보험사는 고령자용 스마트 셔츠를 활용한 리스크 스코어링 비용을 보상하고 있으며, 이는 텍스타일 센서에 대한 투자를 촉진하고 있습니다.
유럽에서는 꾸준한 확장이 이어지고 있으며, 디지털 제품 여권(Digital Product Passport)의 의무화로 인해 제품 수명 주기의 투명성이 증진되고, 고품질의 사후 판매 분석이 발전하고 있습니다. GDPR(EU 개인정보보호규정) 준수에 따라 보안이 강화된 엣지 펌웨어 및 소버린 클라우드 브리지에 대한 지출이 증가하고 있습니다.
라틴아메리카 및 중동 및 아프리카은 판매량 면에서는 뒤처지고 있지만, 도시 지역의 사립 병원이 낙상 감지 시계를 도입하고 있는 지역에서는 두 자릿수의 성장률을 기록하고 있습니다. 국경을 초월한 전자상거래와 다국적 OEM 조립 라인을 통해 각 지역은 상호 의존적인 관계에 있는 세계 웨어러블 모션 센서 시장으로 연결되어 있습니다.
기타 혜택:
- 엑셀 형식 시장 예측(ME) 시트
- 3개월간의 애널리스트 지원
자주 묻는 질문
목차
제1장 서론
제2장 조사 방법
제3장 주요 요약
제4장 시장 구도
제5장 시장 규모와 성장 예측
제6장 경쟁 구도
제7장 시장 기회와 향후 전망
LSH 26.09.08According to Mordor Intelligence, wearable motion sensors market size in 2026 is estimated at USD 2.82 billion, growing from 2025 value of USD 2.5 billion with 2031 projections showing USD 5.16 billion, growing at 12.81% CAGR over 2026-2031.
This report is Segmented by Type (Accelerometers, Gyroscopes, Magnetometers, and More), Application (Fitness Bands, Activity Monitors, Smart Clothing, and More ), End-User (Healthcare, Consumer Electronics, Industrial, Military, An More), Power Consumption (Ultra-Low Power (less Than 1mW), Standard Power (10-50mW), and More), and Geography. The Market Forecasts are Provided in Terms of Value (USD).
Global Wearable Motion Sensors Market Trends and Insights
AI-enabled Sensor Fusion Driving Medical-Grade Wearables
Integrating on-sensor AI with multi-axis inertial data is converting consumer devices into clinical-grade monitors, enabling reliable detection of subtle gait or tremor changes linked to Parkinson's and other neuro-motor disorders. Studies report 84% accuracy in differentiating early Parkinson's tremor from essential tremor, an achievement that expands home-based, continuous care models and reduces reliance on episodic clinical evaluations. Growing payer acceptance of algorithm-supported diagnostics accelerates hospital adoption, while consumer brands add medical features to retain users within ecosystem subscriptions.
Sub-milliwatt MEMS for Eldercare in Japan & Korea
Sensors consuming below 1 mW allow multi-week operation without charging, a prerequisite for elderly users who may forget to maintain devices. Japan's national long-term care system saw 23% fewer hospitalisations when such sensors enabled automatic fall alerts and daily activity profiling. Korean public-private pilots demonstrate similar savings, encouraging scale-up across community health networks and driving regional demand spillover into China's ageing-at-home initiatives.
Algorithmic Limits on Tremor Differentiation
Current unsupervised models reach only 57.1% accuracy in multi-class tremor severity classification, well below clinical thresholds, limiting reimbursement for neurological wearables. Small, diverse data sets and noisy real-world environments hinder progress, slowing hospital uptake despite promising research prototypes.
Other drivers and restraints analyzed in the detailed report include:
- U.S. RPM Reimbursement Boost
- EU Digital Product Passport-Linked Usage Analytics
- MEMS Foundry Capacity Crunch
For complete list of drivers and restraints, kindly check the Table Of Contents.
Segment Analysis
The wearable motion sensors market saw accelerometers retain 31.65% share in 2025, underpinning activity trackers, gesture interfaces and basic fall detection. That dominance reflects mature cost curves and micro-amp sleep currents. In contrast, MEMS combo sensors post a 14.12% CAGR by fusing accelerometer, gyroscope and magnetometer functions within a single ASIC that off-loads board-level integration. STMicroelectronics' LSM6DSV16BX, for instance, embeds a 6-axis IMU plus an audio accelerometer for bone-conduction-based commands in hearables. Combo adoption narrows the performance gap with discrete IMUs while lowering power draw, ideal for tiny rings and medical patches.
Gyroscopes support sub-degree orientation fidelity in AR/VR headsets and advanced biomechanics analysis yet carry higher milliwatt budgets, so vendors pair duty-cycled modes with predictive algorithms to stretch per-charge runtime. Magnetometers deliver absolute heading, essential for outdoor sports watches navigating GPS multipath. Pressure sensors, a smaller but vital niche, calibrate altitude change for stair-climb counting and swimming lap depth. Forward-looking roadmaps integrate bio-potential or chemical channels alongside motion axes, signalling a future where inertial and physiological data converge inside unified sensor nodes, further strengthening the wearable motion sensors market.
Fitness bands led 23.35% of application revenues in 2025, benefiting from established brand ecosystems, low entry price and cross-selling of subscription analytics. However, textile-embedded sensor threads shift monitoring from gadget to garment, supporting a 14.37% CAGR through 2031. Conductive yarns and printed stretch sensors enable shirts that track joint kinematics, posture and respiratory rates during daily routines, freeing users from dedicated devices.
AR/VR headsets remain a high-growth enclave, demanding sub-millisecond latency orientation updates for immersive simulation. Ear-wear integrates head-gesture sensing for hands-free calls, while smart rings deliver sleep staging in tiny form factors. The convergence of motion and electrochemical sensing within fabrics widens health dashboards to hydration, electrolyte loss and thermal stress parameters, underscoring how seamless experiences keep the wearable motion sensors market expanding beyond novelty phases.
Complete Report Scope:
- By Type
- Accelerometers
- Gyroscopes
- Magnetometers
- Inertial Measurement Units (IMUs)
- MEMS Combo Sensors
- Pressure Sensors
- By Application
- Fitness Bands
- Activity Monitors
- Smart Clothing
- AR/VR Headsets
- Smart Rings and Jewelry
- Ear-wear and Hearing Aids
- By End-user Industry
- Healthcare and Medical Devices
- Consumer Electronics and Lifestyle
- Industrial and Enterprise Safety
- Military and Defense
- Government and Public Utilities
- By Power Consumption
- Ultra-Low Power (Less than1mW)
- Low Power (1-10mW)
- Standard Power (10-50mW)
- High Power (Greater than 50mW)
- By Geography
- North America
- United States
- Canada
- Mexico
- Europe
- United Kingdom
- Germany
- France
- Italy
- Rest of Europe
- Asia-Pacific
- China
- Japan
- India
- South Korea
- Rest of Asia-Pacific
- Middle East
- Israel
- Saudi Arabia
- United Arab Emirates
- Turkey
- Rest of Middle East
- Africa
- South Africa
- Egypt
- Rest of Africa
- South America
- Brazil
- Argentina
- Rest of South America
- North America
Geography Analysis
North America generated 42.15% of 2025 revenue, anchored by Medicare reimbursement reform that locks remote motion monitoring into mainstream care pathways. The region's venture ecosystem funnels capital into edge-AI silicon, while privacy statutes push vendors toward on-device inference, preserving user trust. Supply constraints are mitigated by near-shoring policies and Defense Production Act incentives that favour domestic MEMS lines.
Asia Pacific registers the fastest 16.32% CAGR through 2031, reflecting China's tier-2 fabs embracing energy-harvesting architectures and Korea's smart-city pilots embedding motion tags in elder apartments. Government grants offset initial higher BOM costs, while consumer appetite for feature-rich wearables remains unabated. Japan's insurers reimburse smart-shirt-based risk scoring for seniors, spurring textile sensor investment.
Europe maintains methodical expansion, its Digital Product Passport mandate pushing life-cycle transparency and fostering premium after-sales analytics. GDPR compliance elevates spend on secure edge firmware and sovereign cloud bridges.
Latin America and the Middle East & Africa trail in volumes yet notch double-digit growth where urban private hospitals adopt fall-detection watches. Cross-border e-commerce and multinational OEM assembly lines stitch regions into a globally interdependent wearable motion sensors market.
- Bosch Sensortec GmbH
- TDK InvenSense
- STMicroelectronics N.V.
- Analog Devices, Inc.
- Texas Instruments Incorporated
- Panasonic Industry Co., Ltd.
- Infineon Technologies AG
- NXP Semiconductors N.V.
- Samsung Electronics Co. Ltd.
- Robert Bosch GmbH (Sensors)
- TE Connectivity
- Qualcomm Technologies Inc.
- Sensirion AG
- Xsens (Movella)
- Valencell Inc.
- OMRON Corporation
- Garmin Ltd.
- Polar Electro Oy
- Fitbit LLC (Google)
- Apple Inc.
- Oura Health Oy
- Xiaomi Corporation
- Goertek Inc.
- Huami (Zepp Health)
- Withings SA
Additional Benefits:
- The market estimate (ME) sheet in Excel format
- 3 months of analyst support
TABLE OF CONTENTS
1 INTRODUCTION
- 1.1 Study Assumptions and Market Definition
- 1.2 Scope of the Study
2 RESEARCH METHODOLOGY
3 EXECUTIVE SUMMARY
4 MARKET LANDSCAPE
- 4.1 Market Overview
- 4.2 Market Drivers
- 4.2.1 AI-enabled Sensor Fusion Driving Medical-Grade Wearables
- 4.2.2 Sub-milliwatt MEMS for Eldercare in Japan and Korea
- 4.2.3 U.S. RPM Reimbursement Boost
- 4.2.4 EU Digital Product Passport-Linked Usage Analytics
- 4.2.5 Micro Energy-Harvesting Modules in China
- 4.2.6 NATO Soldier Modernisation Demand
- 4.3 Market Restraints
- 4.3.1 Algorithmic Limits on Tremor Differentiation
- 4.3.2 MEMS Foundry Capacity Crunch
- 4.3.3 Data-Sovereignty Compliance Costs
- 4.3.4 Smart-Textile Interconnect Failures
- 4.4 Value / Supply-Chain Analysis
- 4.5 Regulatory and Technological Outlook
- 4.6 Porter's Five Forces Analysis
- 4.6.1 Bargaining Power of Suppliers
- 4.6.2 Bargaining Power of Consumers
- 4.6.3 Threat of New Entrants
- 4.6.4 Threat of Substitutes
- 4.6.5 Intensity of Competitive Rivalry
5 MARKET SIZE AND GROWTH FORECASTS (VALUE)
- 5.1 By Type
- 5.1.1 Accelerometers
- 5.1.2 Gyroscopes
- 5.1.3 Magnetometers
- 5.1.4 Inertial Measurement Units (IMUs)
- 5.1.5 MEMS Combo Sensors
- 5.1.6 Pressure Sensors
- 5.2 By Application
- 5.2.1 Fitness Bands
- 5.2.2 Activity Monitors
- 5.2.3 Smart Clothing
- 5.2.4 AR/VR Headsets
- 5.2.5 Smart Rings and Jewelry
- 5.2.6 Ear-wear and Hearing Aids
- 5.3 By End-user Industry
- 5.3.1 Healthcare and Medical Devices
- 5.3.2 Consumer Electronics and Lifestyle
- 5.3.3 Industrial and Enterprise Safety
- 5.3.4 Military and Defense
- 5.3.5 Government and Public Utilities
- 5.4 By Power Consumption
- 5.4.1 Ultra-Low Power (Less than1mW)
- 5.4.2 Low Power (1-10mW)
- 5.4.3 Standard Power (10-50mW)
- 5.4.4 High Power (Greater than 50mW)
- 5.5 By Geography
- 5.5.1 North America
- 5.5.1.1 United States
- 5.5.1.2 Canada
- 5.5.1.3 Mexico
- 5.5.2 Europe
- 5.5.2.1 United Kingdom
- 5.5.2.2 Germany
- 5.5.2.3 France
- 5.5.2.4 Italy
- 5.5.2.5 Rest of Europe
- 5.5.3 Asia-Pacific
- 5.5.3.1 China
- 5.5.3.2 Japan
- 5.5.3.3 India
- 5.5.3.4 South Korea
- 5.5.3.5 Rest of Asia-Pacific
- 5.5.4 Middle East
- 5.5.4.1 Israel
- 5.5.4.2 Saudi Arabia
- 5.5.4.3 United Arab Emirates
- 5.5.4.4 Turkey
- 5.5.4.5 Rest of Middle East
- 5.5.5 Africa
- 5.5.5.1 South Africa
- 5.5.5.2 Egypt
- 5.5.5.3 Rest of Africa
- 5.5.6 South America
- 5.5.6.1 Brazil
- 5.5.6.2 Argentina
- 5.5.6.3 Rest of South America
- 5.5.1 North America
6 COMPETITIVE LANDSCAPE
- 6.1 Market Concentration
- 6.2 Strategic Moves
- 6.3 Market Share Analysis
- 6.4 Company Profiles {(includes Global level Overview, Market level overview, Core Segments, Financials as available, Strategic Information, Market Rank/Share for key companies, Products and Services, and Recent Developments)}
- 6.4.1 Bosch Sensortec GmbH
- 6.4.2 TDK InvenSense
- 6.4.3 STMicroelectronics N.V.
- 6.4.4 Analog Devices, Inc.
- 6.4.5 Texas Instruments Incorporated
- 6.4.6 Panasonic Industry Co., Ltd.
- 6.4.7 Infineon Technologies AG
- 6.4.8 NXP Semiconductors N.V.
- 6.4.9 Samsung Electronics Co. Ltd.
- 6.4.10 Robert Bosch GmbH (Sensors)
- 6.4.11 TE Connectivity
- 6.4.12 Qualcomm Technologies Inc.
- 6.4.13 Sensirion AG
- 6.4.14 Xsens (Movella)
- 6.4.15 Valencell Inc.
- 6.4.16 OMRON Corporation
- 6.4.17 Garmin Ltd.
- 6.4.18 Polar Electro Oy
- 6.4.19 Fitbit LLC (Google)
- 6.4.20 Apple Inc.
- 6.4.21 Oura Health Oy
- 6.4.22 Xiaomi Corporation
- 6.4.23 Goertek Inc.
- 6.4.24 Huami (Zepp Health)
- 6.4.25 Withings SA
7 MARKET OPPORTUNITIES AND FUTURE OUTLOOK
- 7.1 White-space and Unmet-Need Assessment


