

|
시장보고서
상품코드
2121402
블루투스 스피커 : 시장 점유율 분석, 업계 동향·통계, 성장 예측(2026-2031년)Bluetooth Speaker - Market Share Analysis, Industry Trends & Statistics, Growth Forecasts (2026 - 2031) |
||||||
 Mordor Intelligence
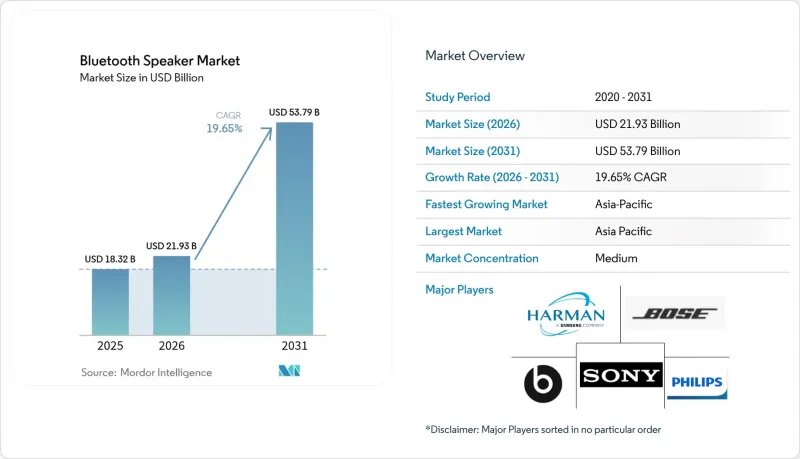
Mordor Intelligence에 따르면 블루투스 스피커 시장 규모는 2025년에 183억 2,000만 달러로 평가되며, 2026년 219억 3,000만 달러에서 2031년까지 537억 9,000만 달러에 달할 것으로 예측되고 있으며, 예측 기간(2026-2031년)에 CAGR은 19.65%에 달할 전망입니다.
이 보고서는 휴대성(휴대용, 고정형/벽걸이형), 용도(주거용, 상업용), 연결 기술(블루투스 전용, 기타), 유통 채널(온라인 전문 소매업체, 기타), 가격대(50달러 미만의 경제형 모델, 기타),지역(북미, 남미, 유럽, 기타)별로 분류되어 있습니다. 시장 전망은 금액(달러) 기준으로 제시되어 있습니다.
글로벌 블루투스 스피커 시장의 동향 및 인사이트
스마트홈 생태계의 급속한 확산
Matter 규격이 실현하는 원활한 상호 운용성 덕분에 블루투스 스피커는 단순한 엔터테인먼트 기기에서 다기능 스마트홈 허브로 진화하고 있습니다. 아마존의 2025년형 ‘Echo Show’ 시리즈는 Fire TV 서비스 내장, 화상 통신 자동 프레임 기능, 그리고 Matter, Zigbee, Thread의 완벽한 지원을 한 대에 집약함으로써 이러한 변화를 여실히 보여주고 있습니다. 브랜드 간 호환성으로 인해 전환 비용이 절감되고, 각 가정이 음성 지원 스피커를 통해 조명, 공조, 보안 제어를 일원화함에 따라 프리미엄 제품의 교체 수요가 촉진되고 있습니다. LegatoXP와 같은 중국의 ODM 플랫폼은 제품 개발 주기를 단축하여 2선급 브랜드가 더 적은 개발 예산으로 스마트홈 시장에 진입할 수 있도록 하고 있습니다. 이러한 요인들이 맞물려 가정내 보급이 가속화되고 브랜드 간 경쟁이 격화되면서, 블루투스 스피커 시장의 총판매량이 확대되고 있습니다.
음악 스트리밍 구독의 확대
2024년, 음악 스트리밍 서비스의 유료 가입자 수는 7억 5,000만 명을 돌파하며, 고해상도 및 공간 오디오 재생이 가능한 하드웨어에 대한 수요를 끌어올렸습니다. LC3, LDAC, aptX Lossless 등의 코덱이 성숙해짐에 따라 사용자들은 기존 기기와 차세대 스피커 간의 청각적으로 뚜렷한 음질 차이를 인식하게 되었고, 이는 기기 교체 수요를 불러일으키고 있습니다. 또한 구독 플랫폼에서는 그룹 청취를 기본적으로 지원하는 멀티 디바이스 요금제가 권장되고 있으며, 단일 스피커 구성보다 멀티룸 스피커가 선호되는 추세입니다. 스트리밍의 지속적인 수익 모델은 할인된 가격의 스피커를 고객 유치 수단으로 활용하는 프로모션용 번들 판매를 촉진하여, 예측 기간 중 하드웨어 판매 대수를 더욱 끌어올리고 있습니다.
만연한 위조품과 해적판
무허가 공장이 인기 있는 디자인을 모방하여 저품질의 모조품을 E-Commerce 채널에 범람시키고 있습니다. 이들은 정품 브랜드보다 가격을 낮게 책정함으로써 정품 브랜드의 시장 점유율을 빼앗고, 소비자의 신뢰를 훼손하고 있습니다. 위조품에는 중요한 안전 회로가 생략된 경우가 많아 배터리 발화 위험을 높일 뿐만 아니라, 인증 기술, 블록체인 기반 라벨 관리, 법적 조치 등 브랜드 보호를 위한 지출을 가속화하고 있습니다. 고급 브랜드들은 보안 홀로그램이나 공급망 추적 시스템을 도입하고 있지만, 소규모 공급업체들은 대규모 감시를 수행할 자금이 부족하여 수익 유출 및 평판 하락이라는 위험에 노출되어 있습니다.
부문 분석
2025년에는 고정형 및 벽걸이형 제품이 블루투스 스피커 시장 점유율의 68.75%를 차지하며, 소비자들은 TV나 멀티룸 플랫폼과 원활하게 통합되는 전원 연결형 시스템을 선호하는 경향이 나타났습니다. 이 부문의 안정적인 수익 기반을 통해 제조업체는 스마트홈 리모델링 프로젝트와 연계된 예측 가능한 업그레이드 주기를 확보할 수 있습니다. 한편, 휴대용 스피커는 연평균 성장률(CAGR) 21.95%를 기록하며, 도시 지역의 야외 활동 및 재택근무에 따른 이동성 증가로 수요가 증가하고 있습니다.
고정형 솔루션은 음질, 저음 응답, 음성 어시스턴트를 통한 조작성을 중시하며, 이러한 특성 덕분에 평균 판매 가격(ASP)이 높고 스트리밍 서비스와의 번들 판매가 촉진되고 있습니다. 반면, 휴대용 제품은 견고한 구조, 경량화, 장시간 배터리 구동에 최적화되어 있으며, 신흥 시장의 첫 구매 소비자층을 끌어들이고 있습니다. 따라서 이 두 하위 부문은 서로 시장을 빼앗기보다는 병행하여 확대되고 있으며, 블루투스 스피커 시장 전체에 다양한 수익 구조를 가져오고 있습니다.
2025년에는 주거 시장이 블루투스 스피커 시장 규모의 60.55%를 차지하고, CAGR도 21.85%로 가장 높은 성장률을 보이고 있으며, 이는 팬데믹으로 인한 봉쇄 기간 중 형성된 가정 중심의 엔터테인먼트 습관이 정착되고 있음을 지원합니다. 스마트홈의 지속적인 업그레이드로 인해 교체 주기는 4년 미만으로 억제되어, 기존 하이파이 기기의 역사적 평균보다 훨씬 짧아졌습니다.
상업 분야(레스토랑, 호텔, 소규모 사무실 등)의 수요는 고급 고정 설치 시스템에서 여전히 중요하지만, 조달 과정의 장기화와 자본 예산 부족이라는 과제에 직면해 있습니다. 음성 비서의 성숙에 따라 가정용 스피커는 조명 및 공조 제어의 허브 역할을 점점 더 많이 수행하게 되었으며, 실용성과 엔터테인먼트 용도가 융합됨에 따라 블루투스 스피커 시장의 장기적인 수요 예측에서 그 주도적인 위치를 확고히 하고 있습니다.
지역별 분석
아시아태평양은 2025년 블루투스 스피커 시장 점유율의 31.45%를 차지했으며, 제조 규모 확대, 젊은 층을 중심으로 한 소비, 스마트폰의 급속한 보급을 배경으로 2031년까지 연평균 성장률(CAGR) 21.15%를 기록했습니다. 중국의 OEM(Original Equipment Manufacturer)들은 인쇄회로기판 및 배터리 공급망과 가까운 입지 이점을 활용하여 리드 타임을 단축하는 한편, 2030년까지 전문용 AV 기기의 국내 수요가 5조 8,000억 위안 이상에 달할 것으로 예상되는 시장을 최대한 활용하고 있습니다. IoT 생태계에 대한 정부의 지원책은 스마트 스피커의 보급을 더욱 가속화하여, 판매 대수와 혁신 양면에서 이 지역의 주도적 지위를 공고히 하고 있습니다.
북미는 판매 대수 면에서는 뒤처지고 있지만, 평균 판매 가격(ASP)은 가장 높습니다. 스마트홈의 조기 도입과 음성 어시스턴트 통합에 대해 소비자들이 기꺼이 비용을 지불하려는 태도 덕분에, 이 지역의 매출 총이익률은 세계 평균을 상회하고 있습니다. 국립공원에서 캠핑을 즐기는 것부터 도시 지역의 옥상에서 모임을 갖는 것에 이르기까지 다양한 야외 레크리에이션 동향이, 여러 기기와 페어링이 가능한 견고한 모델에 대한 수요를 자극하고 있습니다. 브랜드 충성도가 높은 가운데, Sonos와 같은 카테고리 리더들은 경쟁이 치열해지는 상황에서도 프리미엄 시장 점유율을 유지하고 있습니다.
유럽에서는 확고한 브랜드에 유리하게 작용하는 엄격한 품질 및 사이버 보안 기준에 힘입어 15% 중반대의 꾸준한 성장을 기록하고 있습니다. 2024년 8월에 발효되는 개정판 ‘무선기기 지침’은 보안 부팅 및 네트워크 보호 조치를 의무화하고 있으며, 규정 준수 대응 예산이 없는 저가형 수입품을 사실상 시장에서 배제하게 될 것입니다. 소비자들은 규정 준수에 대해 프리미엄 가격으로 구매함으로써 보답하므로 국내외 제조사들은 조기에 인증을 취득하고 CE 마크를 마케팅상의 차별화 요소로 활용하고 있습니다. 이를 통해 전 세계 블루투스 스피커 시장 매출에 대한 높은 기여도가 지속되고 있습니다.
기타 혜택:
- 엑셀 형식의 시장 예측(ME) 시트
- 3개월간의 애널리스트 지원
자주 묻는 질문
목차
제1장 서론
제2장 조사 방법
제3장 개요
제4장 시장 구도
제5장 시장 규모와 성장 예측
제6장 경쟁 구도
제7장 시장 기회와 향후 전망
KSA 26.09.04According to Mordor Intelligence, the bluetooth speaker market size was valued at USD 18.32 billion in 2025 and estimated to grow from USD 21.93 billion in 2026 to reach USD 53.79 billion by 2031, at a CAGR of 19.65% during the forecast period (2026-2031).
This report is Segmented by Portability (Portable, Fixed/Wall-Mounted), Application (Residential, Commercial), Connectivity Technology (Bluetooth-Only, and More), Distribution Channel (Online-Only Retailers, and More), Price Range (Economy Less Than USD 50, and More), and Geography (North America, South America, Europe, and More). The Market Forecasts are Provided in Terms of Value (USD).
Global Bluetooth Speaker Market Trends and Insights
Rapid Adoption of Smart-Home Ecosystems
Seamless interoperability delivered by the Matter standard elevates Bluetooth speakers from stand-alone entertainment devices to multifunction smart-home hubs. Amazon's 2025 Echo Show range illustrates the shift by embedding Fire TV services, auto-framing video communications, and full Matter, Zigbee, and Thread support in a single unit. Inter-brand compatibility lowers switching costs and drives premium replacement demand as households unify lighting, HVAC, and security control via voice-enabled speakers. Chinese ODM platforms such as LegatoXP shorten product development cycles, letting second-tier brands enter the smart-home space with smaller engineering budgets. Collectively, these forces accelerate household penetration, intensify brand competition, and enlarge the total volume opportunity for the Bluetooth speaker market.
Expansion of Music-Streaming Subscriptions
Music-streaming services surpassed 750 million paid subscribers in 2024, boosting demand for hardware capable of high-resolution and spatial-audio playback. As codecs such as LC3, LDAC, and aptX Lossless mature, users recognize audible quality deltas between legacy devices and next-generation speakers, prompting replacement purchases. Subscription platforms also encourage multi-device plans that natively support group listening, thereby favoring multi-room speakers over single-speaker setups. Streaming's recurring revenue model fosters promotional bundling, where discounted speakers act as customer-acquisition vehicles, further stimulating hardware volumes throughout the forecast window.
Rampant Counterfeiting and Piracy
Unauthorized factories replicate popular designs, flooding e-commerce channels with low-quality imitations that undercut legitimate brands on price and erode consumer trust. Counterfeits often omit essential safety circuits, raising the risk of battery fires and accelerating brand-protection expenditures for authentication technologies, blockchain labeling, and legal enforcement. While premium players deploy security holograms and supply-chain tracing, smaller vendors lack capital for large-scale monitoring, exposing them to revenue leaks and reputational damage.
Other drivers and restraints analyzed in the detailed report include:
- Bluetooth LE Audio and Auracast Roll-out
- Outdoor Recreation and Van-Life Boom
- Safety Recalls Tied to Battery Fires
For complete list of drivers and restraints, kindly check the Table Of Contents.
Segment Analysis
Fixed and wall-mounted units accounted for 68.75% of the Bluetooth speaker market share in 2025, illustrating consumers' preference for power-fed systems that integrate seamlessly with televisions and multi-room platforms. This segment's steady revenue base gives manufacturers predictable upgrade cycles tied to smart-home renovation projects. Portable speakers, however, post a 21.95% CAGR, gaining from urban outdoor activities and remote-work mobility.
Fixed solutions emphasize audio fidelity, bass response, and voice-assistant control, traits that favor higher ASPs and bundling with streaming services. Portable designs optimize for rugged builds, lighter weight, and prolonged battery life, attracting first-time buyers in emerging markets. The two sub-segments, therefore, expand in parallel rather than cannibalize, yielding a diversified revenue structure for the overall Bluetooth speaker market.
Residential settings delivered 60.55% of the Bluetooth speaker market size in 2025 and also hold the fastest 21.85% CAGR, underscoring the permanence of home-centric entertainment habits formed during pandemic lockdowns. Continuous smart-home upgrades keep the replacement cycle under four years, far shorter than the historical averages for legacy hi-fi components.
Commercial demand, restaurants, hotels, and small offices, remains important for premium installed systems but faces elongated procurement processes and tighter capital budgets. As voice assistants mature, residential speakers increasingly serve as hubs for lighting and HVAC control, blending functional utility with leisure use and cementing their primacy in long-term demand projections for the Bluetooth speaker market.
Complete Report Scope:
- By Portability
- Portable
- Fixed / Wall-Mounted
- By Application
- Residential
- Commercial
- By Connectivity Technology
- Bluetooth-only
- Bluetooth + Wi-Fi (Multi-room)
- Smart Speakers w/ Voice Assistant
- By Distribution Channel
- Online-Only Retailers
- Omnichannel Consumer-Electronics Stores
- By Price Range
- Economy (Less than USD 50)
- Mid-range (USD 50-199)
- Premium (More than USD 200)
- By Geography
- North America
- United States
- Canada
- Mexico
- South America
- Brazil
- Argentina
- Rest of South America
- Europe
- Germany
- United Kingdom
- France
- Italy
- Rest of Europe
- Asia-Pacific
- China
- Japan
- South Korea
- India
- Rest of Asia-Pacific
- Middle East
- Saudi Arabia
- United Arab Emirates
- Rest of Middle East
- Africa
- South Africa
- Rest of Africa
- North America
Geography Analysis
Asia-Pacific commanded 31.45% of the Bluetooth speaker market share in 2025, generating a 21.15% CAGR to 2031 on the back of manufacturing scale, youth-oriented consumption, and rapid smartphone proliferation. Chinese OEMs leverage proximity to printed-circuit and battery supply chains to compress lead times and capitalize on domestic demand, which is forecast to surpass CNY 5.8 trillion for professional AV equipment by 2030. Government incentives for IoT ecosystems further accelerate the adoption of smart speakers, solidifying regional leadership in both volume and innovation.
North America trails in unit volumes yet achieves the highest ASPs. Early smart-home adoption and consumer willingness to pay for voice-assistant integration keep the region's gross margins above global averages. Outdoor recreation trends-from national park camping to city rooftop gatherings- stimulate demand for ruggedized models with multi-device pairing. Brand loyalty is strong, allowing category leaders such as Sonos to maintain premium shelf space even amid price-based competition.
Europe posts steady mid-teen growth, backed by stringent quality and cybersecurity standards that favor established brands. The updated Radio Equipment Directive effective August 2024 mandates secure boot and network safeguards, effectively filtering out low-end imports lacking compliance budgets. Consumers reward compliance with premium pricing, prompting local and international manufacturers to certify early and use CE markings as marketing differentiators, sustaining a value-heavy contribution to global Bluetooth speaker market revenues.
- Sony Group Corporation
- Samsung Electronics Co., Ltd. (Harman International Industries, Inc.)
- Panasonic Holdings Corporation
- Bose Corporation
- Beats Electronics LLC (Apple Inc.)
- Koninklijke Philips N.V.
- LG Electronics Inc.
- Logitech International S.A.
- Sonos, Inc.
- Bang & Olufsen A/S
- Yamaha Corporation
- Altec Lansing LLC
- JVCKENWOOD Corporation
- Anker Innovations Technology Co., Ltd.
- Ultimate Ears (Logitech)
- Tribit Audio (Thesy Technology Co., Ltd.)
- Onkyo Home Entertainment Corporation
- Zebronics India Pvt. Ltd.
- AOMAIS Audio (Shenzhen Jin Wen Hua)
- SoundBot Inc.
Additional Benefits:
- The market estimate (ME) sheet in Excel format
- 3 months of analyst support
TABLE OF CONTENTS
1 INTRODUCTION
- 1.1 Study Assumptions and Market Definition
- 1.2 Scope of the Study
2 RESEARCH METHODOLOGY
3 EXECUTIVE SUMMARY
4 MARKET LANDSCAPE
- 4.1 Market Overview
- 4.2 Market Drivers
- 4.2.1 Rapid adoption of smart-home ecosystems
- 4.2.2 Expansion of music-streaming subscriptions
- 4.2.3 Falling ASPs of lithium-ion batteries
- 4.2.4 Outdoor recreation and van-life boom
- 4.2.5 Bluetooth LE Audio and Auracast roll-out
- 4.2.6 Growing demand for immersive classroom audio
- 4.3 Market Restraints
- 4.3.1 Rampant counterfeiting and piracy
- 4.3.2 Margin erosion from price wars
- 4.3.3 Safety recalls tied to battery fires
- 4.3.4 Stricter EU EMI limits for more than 30 W speakers
- 4.4 Value Chain Analysis
- 4.5 Regulatory Landscape
- 4.6 Technological Outlook
- 4.7 Porter's Five Forces Analysis
- 4.7.1 Bargaining Power of Suppliers
- 4.7.2 Bargaining Power of Buyers
- 4.7.3 Threat of New Entrants
- 4.7.4 Threat of Substitutes
- 4.7.5 Degree of Competition
5 MARKET SIZE AND GROWTH FORECASTS (VALUE)
- 5.1 By Portability
- 5.1.1 Portable
- 5.1.2 Fixed / Wall-Mounted
- 5.2 By Application
- 5.2.1 Residential
- 5.2.2 Commercial
- 5.3 By Connectivity Technology
- 5.3.1 Bluetooth-only
- 5.3.2 Bluetooth + Wi-Fi (Multi-room)
- 5.3.3 Smart Speakers w/ Voice Assistant
- 5.4 By Distribution Channel
- 5.4.1 Online-Only Retailers
- 5.4.2 Omnichannel Consumer-Electronics Stores
- 5.5 By Price Range
- 5.5.1 Economy (Less than USD 50)
- 5.5.2 Mid-range (USD 50-199)
- 5.5.3 Premium (More than USD 200)
- 5.6 By Geography
- 5.6.1 North America
- 5.6.1.1 United States
- 5.6.1.2 Canada
- 5.6.1.3 Mexico
- 5.6.2 South America
- 5.6.2.1 Brazil
- 5.6.2.2 Argentina
- 5.6.2.3 Rest of South America
- 5.6.3 Europe
- 5.6.3.1 Germany
- 5.6.3.2 United Kingdom
- 5.6.3.3 France
- 5.6.3.4 Italy
- 5.6.3.5 Rest of Europe
- 5.6.4 Asia-Pacific
- 5.6.4.1 China
- 5.6.4.2 Japan
- 5.6.4.3 South Korea
- 5.6.4.4 India
- 5.6.4.5 Rest of Asia-Pacific
- 5.6.5 Middle East
- 5.6.5.1 Saudi Arabia
- 5.6.5.2 United Arab Emirates
- 5.6.5.3 Rest of Middle East
- 5.6.6 Africa
- 5.6.6.1 South Africa
- 5.6.6.2 Rest of Africa
- 5.6.1 North America
6 COMPETITIVE LANDSCAPE
- 6.1 Market Concentration
- 6.2 Strategic Moves
- 6.3 Market Share Analysis
- 6.4 Company Profiles (includes Global level Overview, Market level overview, Core Segments, Financials as available, Strategic Information, Market Rank/Share for key companies, Products and Services, and Recent Developments)
- 6.4.1 Sony Group Corporation
- 6.4.2 Samsung Electronics Co., Ltd. (Harman International Industries, Inc.)
- 6.4.3 Panasonic Holdings Corporation
- 6.4.4 Bose Corporation
- 6.4.5 Beats Electronics LLC (Apple Inc.)
- 6.4.6 Koninklijke Philips N.V.
- 6.4.7 LG Electronics Inc.
- 6.4.8 Logitech International S.A.
- 6.4.9 Sonos, Inc.
- 6.4.10 Bang & Olufsen A/S
- 6.4.11 Yamaha Corporation
- 6.4.12 Altec Lansing LLC
- 6.4.13 JVCKENWOOD Corporation
- 6.4.14 Anker Innovations Technology Co., Ltd.
- 6.4.15 Ultimate Ears (Logitech)
- 6.4.16 Tribit Audio (Thesy Technology Co., Ltd.)
- 6.4.17 Onkyo Home Entertainment Corporation
- 6.4.18 Zebronics India Pvt. Ltd.
- 6.4.19 AOMAIS Audio (Shenzhen Jin Wen Hua)
- 6.4.20 SoundBot Inc.
7 MARKET OPPORTUNITIES AND FUTURE OUTLOOK
- 7.1 White-space and Unmet-need Assessment


