

|
시장보고서
상품코드
2121643
파이프라인 보안 : 시장 점유율 분석, 업계 동향과 통계, 성장 예측(2026-2031년)Pipeline Security - Market Share Analysis, Industry Trends & Statistics, Growth Forecasts (2026 - 2031) |
||||||
 Mordor Intelligence
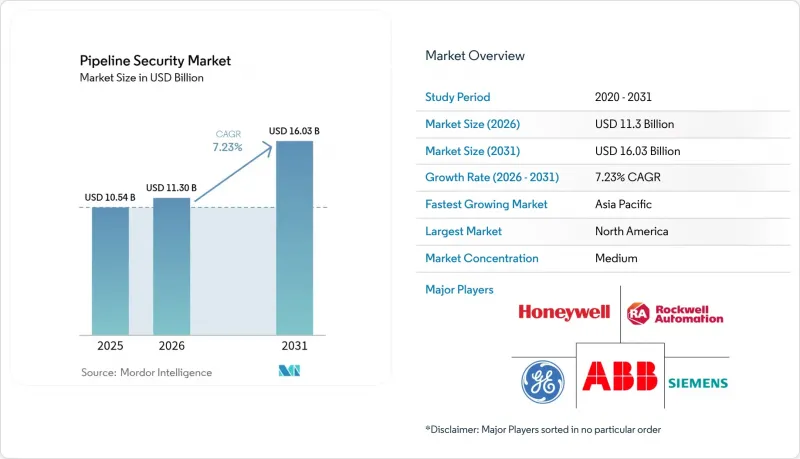
Mordor Intelligence에 의하면, 2026년 파이프라인 보안 시장 규모는 113억 달러로 추정되며, 2025년 105억 4,000만 달러에서 2031년에는 160억 3,000만 달러에 달할 것으로 예측됩니다.
또한 2026-2031년 연평균 성장률(CAGR)은 7.23%를 나타낼 것으로 전망됩니다.
본 보고서는 제품별(천연가스, 원유, 위험 액체·화학물질 등), 기술·솔루션별(SCADA 시스템, 주변 보안, ICS 보안 등), 용도별(육상, 해상, 집수 네트워크, 정제 제품),보안 유형별(물리적 보안, OT 사이버 보안, 융합형), 그리고 지역별로 분류되어 있습니다. 시장 예측은 금액(달러) 기준으로 제시되어 있습니다.
전 세계 파이프라인 보안 시장 동향 및 인사이트
국경을 넘는 에너지 무역 경로의 확대
총 길이 5,600킬로미터에 달하는 나이지리아-모로코 간 파이프라인,사우디아라비아의 총 길이 4,000킬로미터에 달하는 자프라 네트워크와 같은 메가 프로젝트는 다국간에 걸친 회랑이 법 집행 기준이 서로 다른 관할 구역을 가로지름으로써 보안의 복잡성을 얼마나 높이고 있는지를 보여줍니다. 사업자는 여러 법적 체계에 걸쳐 사고 대응 프로토콜, 위성 감시, 광섬유 침입 감지 시스템을 조정해야 하며, 그 결과 1킬로미터당 보안 예산이 국내 평균을 상회하는 수준에 이르고 있습니다.
엄격한 환경 및 안전 규제
미국 파이프라인 및 위험물 안전청(PHMSA)의 2024년 규정에 따르면, 최대 유량의 8%를 30분 이내에 감지할 수 있는 누출 감지 시스템이 의무화되었습니다. 이 기준으로 인해 기존의 수압식 모델은 사실상 사용할 수 없게 되었으며, 실시간 음향 감지 기술의 도입이 촉진되고 있습니다. 이와 더불어, 미국 환경보호청(EPA)의 개정으로 인해 인구 밀집 지역 인근의 액체 파이프라인에 대한 위험 관리 감사가 확대되었으며, 규정 준수 체크리스트에 제3자에 의한 보안 심사가 추가되었습니다. 유럽에서도 유사한 압력이 높아지고 있으며, 수소 네트워크 코드 초안에서는 용도 변경된 파이프라인에 대한 지속적인 취성 모니터링이 요구되고 있습니다.
높은 도입 및 유지 비용
광섬유를 이용한 분산형 음향 감지 기술은 설치비, 인터로게이터 장치, SCADA 통합 비용을 포함하면 1킬로미터당 1만 달러를 초과하는 경우가 있으며, 연간 소프트웨어 라이선스 비용은 수명 주기 총비용의 20%에 달할 전망입니다. 해저 파이프라인의 경우 비용이 더욱 높아집니다. 자율형 수중 탐사기, 해저 어레이, 특수 부식 센서로 인해 보안 예산이 총 설비 투자액의 10%에 달할 가능성이 있어, 수익성이 낮은 유전 프로젝트의 경제성을 위협하고 있습니다.
부문 분석
수소 및 CO2 파이프라인은 각국 정부가 그린 수소 수출 회랑 및 탄소 포집 밸류체인을 지원하고 있기 때문에 제품군 중 가장 빠른 속도인 연평균 성장률(CAGR) 8.17%로 성장할 전망입니다. 이 신흥 네트워크에는 기존 천연가스 시스템으로는 실현할 수 없는 실시간 변형 감지 및 취성 분석이 요구되고 있습니다. 사업자들은 파열 전에 미세 균열을 감지하기 위한 광섬유 변형 게이지의 시범 운영을 진행하고 있습니다. 이는 신설 수소 수송 회랑에 대한 보험 인수 전제조건이 되고 있습니다. 대조적으로, 천연가스 파이프라인은 2025년 파이프라인 보안 시장의 45.40% 점유율을 차지할 것으로 예상되며, 이는 미국, 카타르, 호주의 LNG 수출 시설 확장에 힘입은 결과입니다.
천연가스 자산은 계속해서 수익의 기반이 될 것이지만, 수요 전망이 개선되면 상향 조정 가능성은 수소 쪽으로 이동할 것입니다. 원유 수송 노선은 누출에 대한 배상 책임이 크기 때문에 보안 지출은 안정적이지만, 전기차의 보급으로 인해 장기적인 성장은 둔화되고 있습니다. 위험 액체 및 화학 물질 파이프라인의 경우, 사소한 누출이라도 몇 시간 내에 집단 소송으로 이어질 가능성이 있기 때문에 자동 차단 밸브와 다중 요소에 의한 주변 경비에 막대한 예산이 투입되고 있습니다. 이산화탄소 격리(CCS) 네트워크는 아직 형성 단계에 있지만, 선견지명을 가진 사업자들은 이 분야를 향후 배출권 거래 제도에 대한 헤지 수단으로 간주하고 있으며, CO2 전용 센서군에 대한 연구 개발(R&D)을 지속하고 있습니다.
통합형 엔드투엔드 플랫폼은 2031년까지 연평균 성장률(CAGR) 8.74%를 나타낼 것으로 예측됩니다. 이는 사업자들이 음향 경보, 영상 피드, GIS 오버레이, 사이버 위협 텔레메트리를 통합한 단일 대시보드를 선호하는 경향을 반영한 것입니다. SCADA 전용 환경은 2025년 매출의 31.20%를 차지할 것으로 보이지만, 사업자들이 데이터를 로컬에서 사전 처리하고 지연 및 대역폭 부하를 줄이는 엣지 컴퓨팅 노드로 전환함에 따라 점유율이 하락하고 있습니다. 널리 도입된 SCADA 벤더에 영향을 미치는 취약점 공개로 인해, OT 자산을 엔터프라이즈 IT로부터 격리하기 위한 제로 트러스트 아키텍처 및 마이크로 세분화의 도입이 가속화되고 있습니다.
울타리, 레이더, 열화상 카메라와 같은 경계 보안 모듈은 여전히 중요하지만, 조달 담당자들이 이를 개별적으로 구매하기보다 플랫폼 라이선스에 묶어 구매하는 경향이 강해짐에 따라 시장 점유율은 하락하고 있습니다. 컴퓨터 비전 분석을 통해 비정상적인 활동이 자율적으로 감지되게 됨에 따라, 제어실 직원은 보다 정교한 우선순위 설정에 시간을 할애할 수 있게 되었습니다. 한편, 센서 혁신은 하드웨어에서 펌웨어로 전환되고 있으며, 머신 러닝을 탑재한 엣지 노드가 분산형 음향 감지 파형에서 직접 누출 감지 특징량을 추출함으로써 정확도를 향상시키는 동시에, 규칙 기반 임계값과 비교해 오경보를 30% 줄이고 있습니다. 이러한 발전으로 인해, 이전에는 고가의 장비를 구입할 수 없었던 중견 기업을 대상으로 하는 시장이 확대되면서 플랫폼 공급업체의 수익 기반이 넓어지고 있습니다.
지역별 분석
북미는 미국의 300만 킬로미터에 달하는 파이프라인망과 캐나다의 서부 분지와 연안 터미널을 연결하는 수출 회랑 덕분에 2025년 매출의 37.90%를 차지하며 여전히 가장 큰 기여 지역으로 남아 있습니다. PHMSA(미국 파이프라인 및 위험물 안전국)의 2024년 누출 감지 규정 시행 이후, 규정 준수 관련 지출이 가속화되면서 광섬유식 분산 음향 감지 시스템의 광범위한 개보수와 고장 격리 밸브 및 실시간 분석 시스템의 연동이 진행되고 있습니다. 한편, 퍼미안 분지의 가스를 멕시코로 수송하는 국경 간 프로젝트에서는 미국과 멕시코 양국의 규제 당국에 의한 이중 규정 준수 감사가 이루어지고 있으며, 이로 인해 컨설팅 업무 시간이 증가하는 동시에 언어 및 프로토콜의 차이를 해소하기 위한 플랫폼 업그레이드가 추진되고 있습니다.
아시아태평양은 현재 중국, 인도, 동남아시아에서 건설 중인 전 세계 가스 파이프라인 총 연장 거리의 80%를 차지하는 것을 배경으로, 연평균 성장률(CAGR) 9.12%를 기록하며 다른 모든 지역을 능가하는 성장이 예상됩니다. 중국의 중앙아시아 회랑에서는 기본적인 원격 계측 기능을 갖추지 못했던 기존 파이프라인에 새로운 감시 장치가 도입되고 있습니다. 한편, 인도에서 도시 가스 보급이 추진됨에 따라 배급 사업자들은 도시 지역에서 수천 킬로미터 규모로 확장 가능한 저비용 음향 센서를 도입할 수밖에 없는 상황입니다. 일본과 한국에서는 LNG 수입 터미널 주변에 지진 감시 시스템이 추가되고 있으며, 아시아태평양 회원국들은 제안된 ‘트랜스 아시아태평양 가스 파이프라인’에 대한 연합 보안 조항 협상을 진행 중입니다. 이로 인해 입찰은 지연되고 있으나, 향후 1킬로미터당 지출은 증가할 전망입니다.
유럽 시장은 탈탄소화와 러시아로부터공급 중단에 대비한 회복탄력성이라는 두 가지 과제에 의해 형성되고 있습니다. 수소 관련 규정안에서는 용도가 변경된 가스 파이프라인의 취성화를 실시간으로 모니터링할 것을 요구하고 있으나, 이 사양은 현재로서는 상업적 규모로 활용될 수 없습니다. 한편, 중동에서는 현재 천연가스를, 장래에는 수소를 수송할 수 있는 듀얼 유스(이중 용도) 네트워크에 대한 자금 지원이 진행되고 있으며, 사우디아람코의 자프라 파이프라인에는 건설 초기부터 분산형 음향 감지 기술이 도입되어 있습니다. 분열된 아프리카 시장에서는 북아프리카의 유럽 규격 시스템 도입과 사하라 이남 지역의 예산 제약이 대조를 이루고 있습니다. 또한, 남미의 성장은 환경 허가 요건을 충족하기 위해 광섬유 모니터링 시스템의 통합이 의무화된 바카 무에르타 파이프라인을 중심으로 진행되고 있습니다.
기타 혜택:
- 엑셀 형식 시장 예측(ME) 시트
- 3개월간의 애널리스트 지원
자주 묻는 질문
목차
제1장 서론
제2장 조사 방법
제3장 주요 요약
제4장 시장 구도
제5장 시장 규모와 성장 예측
제6장 경쟁 구도
제7장 시장 기회와 향후 전망
LSH 26.09.09According to Mordor Intelligence, the pipeline security market size in 2026 is estimated at USD 11.3 billion, growing from 2025 value of USD 10.54 billion with 2031 projections showing USD 16.03 billion, growing at 7.23% CAGR over 2026-2031.
This report is Segmented by Product (Natural Gas, Crude Oil, Hazardous Liquid/Chemicals, and More), Technology and Solution (SCADA Systems, Perimeter Security, ICS Security, and More), Application (Onshore, Offshore, Gathering Networks, and Refined Products), Security Type (Physical, OT Cybersecurity, and Converged), and Geography. Market Forecasts are Provided in Terms of Value (USD).
Global Pipeline Security Market Trends and Insights
Expansion of Cross-Border Energy Trade Routes
Mega-projects such as the 5,600-kilometer Nigeria-Morocco line and Saudi Arabia's 4,000-kilometer Jafurah network illustrate how multinational corridors heighten security complexity by spanning jurisdictions with divergent enforcement standards. Operators must coordinate incident response protocols, satellite surveillance, and fiber-optic intrusion detection across multiple legal frameworks, driving per-kilometer security budgets higher than domestic averages
Stringent Environmental and Safety Regulations
The U.S. Pipeline and Hazardous Materials Safety Administration's 2024 rule requires leak-detection systems that spot 8% of maximum flow within 30 minutes, a threshold that effectively disqualifies legacy hydraulic models and pushes adoption of real-time acoustic sensing. Complementary EPA amendments extend risk-management audits to liquid pipelines near populated zones, adding third-party security reviews to compliance checklists. Similar pressure is mounting in Europe, where draft hydrogen network codes call for continuous embrittlement monitoring on repurposed lines
High Implementation and Maintenance Costs
Fiber-optic distributed acoustic sensing can exceed USD 10,000 per kilometer when installation, interrogator units, and SCADA integration are included, and annual software licenses add up to 20% of total life-cycle spending. Offshore pipelines bear even steeper costs: autonomous underwater vehicles, seabed arrays, and specialty corrosion sensors can push security budgets to 10% of total capex, challenging project economics for marginal fields
Other drivers and restraints analyzed in the detailed report include:
- Increasing Incidence of Sabotage and Terrorism Attacks
- Growing Adoption of AI-Powered Leak Detection Solutions
- Complex, Heterogeneous Legacy Infrastructure
For complete list of drivers and restraints, kindly check the Table Of Contents.
Segment Analysis
Hydrogen and CO2 pipelines are on track to expand at an 8.17% CAGR, the fastest pace among products, as governments underwrite green-hydrogen export corridors and carbon-capture value chain. This emerging network demands real-time strain sensing and embrittlement analytics that legacy natural-gas systems cannot deliver. Operators are piloting fiber-optic strain gauges to spot microfractures before rupture, a prerequisite for insurance underwriting in newbuild hydrogen corridors. In contrast, natural gas lines held a 45.40% share of the pipeline security market in 2025, sustained by LNG export buildouts in the United States, Qatar, and Australia.
Natural gas assets will continue to anchor revenue, but upside potential shifts toward hydrogen once demand visibility improves. Crude oil routes remain stable in security outlays owing to high spill liability, yet long-term growth is muted by electric-vehicle penetration. Hazardous-liquid and chemical pipelines funnel premium budgets into automated shutoff valves and multi-factor perimeter controls because any release can prompt class-action litigation within hours. Carbon dioxide networks for sequestration are at a formative stage, but forward-looking operators view the segment as a hedge against eventual emission-pricing regimes, keeping R&D pipelines active for CO2-specific sensor suites
Integrated end-to-end platforms are forecast to grow at 8.74% CAGR through 2031, reflecting operator preference for a single dashboard that unifies acoustic alerts, video feeds, GIS overlays, and cyber-threat telemetry. SCADA-only environments, though still 31.20% of 2025 revenue, are losing share as operators switch to edge-computing nodes that preprocess data locally, cutting latency and bandwidth commitments. Vulnerability disclosures affecting widely deployed SCADA vendors have hastened adoption of zero-trust architectures and micro-segmentation to isolate OT assets from enterprise IT.
Perimeter-security modules fencing, radar, and thermal cameras remain critical, but their market share slides as procurement officers bundle them into platform licenses instead of standalone buys. Computer-vision analytics now flag anomalous activity autonomously, freeing control-room staff for higher-order triage. Meanwhile, sensor innovation is shifting from hardware to firmware, with machine-learning edge nodes extracting leak-detection features directly from distributed acoustic sensing waveforms, improving accuracy while cutting false alarms by 30% compared to rule-based thresholds. These advances enlarge the addressable market among mid-tier operators once priced out of premium gear, broadening the revenue base for platform vendors
Complete Report Scope:
- By Product
- Natural Gas
- Crude Oil
- Hazardous Liquid / Chemicals
- Hydrogen and CO? Pipelines
- Other Products
- By Technology and Solution
- Supervisory Control and Data Acquisition (SCADA) Systems
- Perimeter Security and Intruder Detection Systems
- Industrial Control Systems Security
- Video Surveillance and GIS Mapping
- Pipeline Monitoring Sensors and Analytics
- Integrated End-to-End Security Platforms
- By Application
- Onshore Pipelines
- Offshore Pipelines
- Gathering and Distribution Networks
- Refined Products Pipelines
- By Security Type
- Physical Security
- Operational Technology (OT) Cybersecurity
- Physical-Cyber Converged Solutions
- By Geography
- North America
- United States
- Canada
- Mexico
- Europe
- United Kingdom
- Germany
- France
- Italy
- Rest of Europe
- Asia-Pacific
- China
- Japan
- India
- South Korea
- Rest of Asia
- Middle East
- Israel
- Saudi Arabia
- United Arab Emirates
- Turkey
- Rest of Middle East
- Africa
- South Africa
- Egypt
- Rest of Africa
- South America
- Brazil
- Argentina
- Rest of South America
- North America
Geography Analysis
North America remained the single largest contributor with 37.90% of 2025 revenue, thanks to the United States' 3 million-kilometer grid and Canada's export corridors linking western basins to coastal terminals. Compliance spending accelerated after PHMSA's 2024 leak-detection rule, prompting widespread retrofits of fiber-optic distributed acoustic sensing and linking of fault-isolation valves to real-time analytics. Meanwhile, cross-border projects moving Permian gas into Mexico face dual compliance audits from both U.S. and Mexican regulators, lifting consulting hours and driving platform upgrades that bridge language and protocol differences.
Asia-Pacific will outpace all regions at a 9.12% CAGR, fueled by 80% of global gas-pipeline kilometers now under construction across China, India, and Southeast Asia. China's Central-Asia. corridor overlays new surveillance gear on legacy lines that lacked basic telemetry, while India's city-gas push forces distributors to adopt low-cost acoustic sensors scalable to thousands of urban kilometers. Japan and South Korea add seismic monitoring layers around LNG import terminals, and Asia-Pacific members negotiate federated security clauses in the proposed Trans-Asia-PacificGas Pipeline, delaying tenders but raising future per-kilometer outlays.
Europe's market is shaped by dual imperatives: decarbonization and resilience following disrupted Russian flows. Draft hydrogen rules require real-time embrittlement monitoring on repurposed gas lines, a specification not yet available at commercial scale. Elsewhere, the Middle East bankrolls dual-use networks capable of carrying natural gas today and hydrogen tomorrow, with Saudi Aramco's Jafurah lines fitted with distributed acoustic sensing from inception. Africa's split market pairs North-African adoption of European-grade systems against Sub-Saharan budget constraints, while South America's growth centers on Vaca Muerta pipelines mandated to embed fiber-optic monitoring to meet environmental permits
- Honeywell International Inc.
- General Electric Company
- ABB Ltd.
- Rockwell Automation Inc.
- Siemens AG
- Schneider Electric SE
- OptaSense Ltd.
- Senstar Corporation
- Huawei Technologies Co. Ltd.
- Environmental Systems Research Institute Inc. (Esri)
- Thales S.A.
- BAE Systems plc
- Future Fibre Technologies Ltd.
- Elbit Systems Ltd.
- Inter Pipeline Ltd.
- Alstom SA
- Modcon Systems Ltd.
- Eye Trax Inc.
- Bandweaver Technologies Ltd.
- Magal Security Systems Ltd.
- Leidos Holdings Inc.
Additional Benefits:
- The market estimate (ME) sheet in Excel format
- 3 months of analyst support
TABLE OF CONTENTS
1 INTRODUCTION
- 1.1 Study Assumptions and Market Definition
- 1.2 Scope of the Study
2 RESEARCH METHODOLOGY
3 EXECUTIVE SUMMARY
4 MARKET LANDSCAPE
- 4.1 Market Overview
- 4.2 Value-Chain Analysis
- 4.3 Impact of Macroeconomic Factors on the Market
- 4.4 Market Drivers
- 4.4.1 Expansion of Cross-Border Energy Trade Routes
- 4.4.2 Stringent Environmental and Safety Regulations
- 4.4.3 Increasing Incidence of Sabotage and Terrorism Attacks
- 4.4.4 Growing Adoption of AI-Powered Leak Detection Solutions
- 4.4.5 Integration of Fiber Optic Sensing in Existing Networks
- 4.4.6 Proliferation of Remote, Unmanned Pipeline Operations
- 4.5 Market Restraints
- 4.5.1 High Implementation and Maintenance Costs
- 4.5.2 Complex, Heterogeneous Legacy Infrastructure
- 4.5.3 Shortage of Qualified OT-Cybersecurity Professionals
- 4.5.4 Limited Budget Allocation in Emerging Economies
- 4.6 Regulatory Landscape
- 4.7 Technological Outlook
- 4.8 Porter's Five Forces Analysis
- 4.8.1 Threat of New Entrants
- 4.8.2 Bargaining Power of Buyers
- 4.8.3 Bargaining Power of Suppliers
- 4.8.4 Threat of Substitute Products
- 4.8.5 Intensity of Competitive Rivalry
5 MARKET SIZE AND GROWTH FORECASTS (VALUE)
- 5.1 By Product
- 5.1.1 Natural Gas
- 5.1.2 Crude Oil
- 5.1.3 Hazardous Liquid / Chemicals
- 5.1.4 Hydrogen and CO? Pipelines
- 5.1.5 Other Products
- 5.2 By Technology and Solution
- 5.2.1 Supervisory Control and Data Acquisition (SCADA) Systems
- 5.2.2 Perimeter Security and Intruder Detection Systems
- 5.2.3 Industrial Control Systems Security
- 5.2.4 Video Surveillance and GIS Mapping
- 5.2.5 Pipeline Monitoring Sensors and Analytics
- 5.2.6 Integrated End-to-End Security Platforms
- 5.3 By Application
- 5.3.1 Onshore Pipelines
- 5.3.2 Offshore Pipelines
- 5.3.3 Gathering and Distribution Networks
- 5.3.4 Refined Products Pipelines
- 5.4 By Security Type
- 5.4.1 Physical Security
- 5.4.2 Operational Technology (OT) Cybersecurity
- 5.4.3 Physical-Cyber Converged Solutions
- 5.5 By Geography
- 5.5.1 North America
- 5.5.1.1 United States
- 5.5.1.2 Canada
- 5.5.1.3 Mexico
- 5.5.2 Europe
- 5.5.2.1 United Kingdom
- 5.5.2.2 Germany
- 5.5.2.3 France
- 5.5.2.4 Italy
- 5.5.2.5 Rest of Europe
- 5.5.3 Asia-Pacific
- 5.5.3.1 China
- 5.5.3.2 Japan
- 5.5.3.3 India
- 5.5.3.4 South Korea
- 5.5.3.5 Rest of Asia
- 5.5.4 Middle East
- 5.5.4.1 Israel
- 5.5.4.2 Saudi Arabia
- 5.5.4.3 United Arab Emirates
- 5.5.4.4 Turkey
- 5.5.4.5 Rest of Middle East
- 5.5.5 Africa
- 5.5.5.1 South Africa
- 5.5.5.2 Egypt
- 5.5.5.3 Rest of Africa
- 5.5.6 South America
- 5.5.6.1 Brazil
- 5.5.6.2 Argentina
- 5.5.6.3 Rest of South America
- 5.5.1 North America
6 COMPETITIVE LANDSCAPE
- 6.1 Market Concentration
- 6.2 Strategic Moves
- 6.3 Market Share Analysis
- 6.4 Company Profiles (includes Global Level Overview, Market Level Overview, Core Segments, Financials as available, Strategic Information, Market Rank/Share for Key Companies, Products and Services, and Recent Developments)
- 6.4.1 Honeywell International Inc.
- 6.4.2 General Electric Company
- 6.4.3 ABB Ltd.
- 6.4.4 Rockwell Automation Inc.
- 6.4.5 Siemens AG
- 6.4.6 Schneider Electric SE
- 6.4.7 OptaSense Ltd.
- 6.4.8 Senstar Corporation
- 6.4.9 Huawei Technologies Co. Ltd.
- 6.4.10 Environmental Systems Research Institute Inc. (Esri)
- 6.4.11 Thales S.A.
- 6.4.12 BAE Systems plc
- 6.4.13 Future Fibre Technologies Ltd.
- 6.4.14 Elbit Systems Ltd.
- 6.4.15 Inter Pipeline Ltd.
- 6.4.16 Alstom SA
- 6.4.17 Modcon Systems Ltd.
- 6.4.18 Eye Trax Inc.
- 6.4.19 Bandweaver Technologies Ltd.
- 6.4.20 Magal Security Systems Ltd.
- 6.4.21 Leidos Holdings Inc.
7 MARKET OPPORTUNITIES AND FUTURE OUTLOOK
- 7.1 White-Space and Unmet-Need Assessment


