

|
시장보고서
상품코드
2121708
머신 투 머신(M2M) 서비스 : 시장 점유율 분석, 업계 동향과 통계, 성장 예측(2026-2031년)Machine To Machine (M2M) Services - Market Share Analysis, Industry Trends & Statistics, Growth Forecasts (2026 - 2031) |
||||||
 Mordor Intelligence
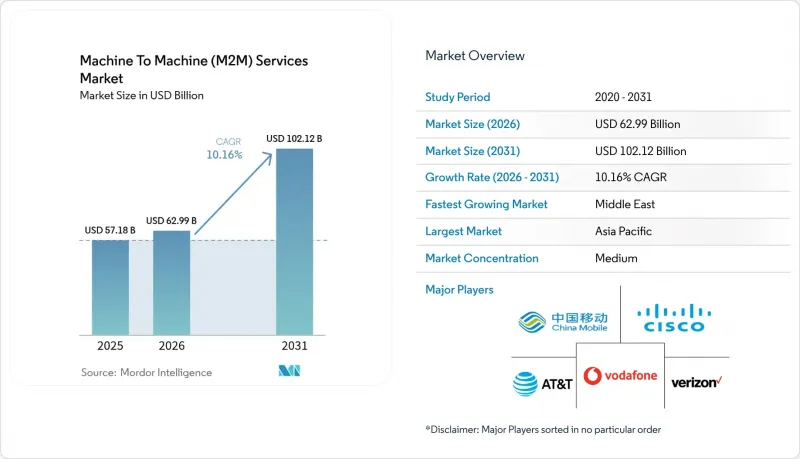
Mordor Intelligence에 의하면, 머신 투 머신(M2M) 서비스 시장 규모는 2025년 571억 8,000만 달러에서 2026년에는 629억 9,000만 달러에 이르고, 2026-2031년 CAGR 10.16%로 성장을 지속하여 2031년에는 1,021억 2,000만 달러에 달할 것으로 예측됩니다.
본 보고서는 유형별(관리형 서비스, 전문 서비스), 연결 기술별(셀룰러(2G-5G),LPWAN, 위성, 유선), 서비스 모델별(연결 서비스, 기기 관리 서비스, 기타), 최종 사용자별(소매, 은행 및 금융기관, 통신 및 IT, 기타), 지역별로 분류되어 있습니다. 시장 예측은 금액(달러)으로 표시되어 있습니다.
전 세계 머신 투 머신(M2M) 서비스 시장 동향 및 인사이트
LPWAN·5G 네트워크의 보급
현재 47개국에서 독립형 5G 코어가 가동 중이며, 로봇 공학 및 자율주행차용으로 10밀리초 이하의 지연을 보장하는 네트워크 슬라이스를 제공하는 동시에, 방대한 센서 트래픽을 위한 저비용 NB-IoT 슬라이스를 확보하고 있습니다. 차이나모바일은 2024년 말 기준으로 2억 3,000만 건의 NB-IoT 접속 건수를 기록했으며, 건당 월평균 수익은 2위안(0.28달러)에 육박했습니다. 유럽에서는 2024년 신규 도입 시 LPWAN을 지정한 기업이 34%에 달하고,, 전년의 22%에서 증가했습니다. 이는 농업 및 환경 모니터링 부문에서 10년 배터리 수명에 대한 수요를 반영한 것입니다. 2026년까지 5G RedCap 모듈의 칩셋 가격이 LTE-M과 비슷한 수준에 근접함에 따라, M2M 서비스 시장은 1와트의 전력 예산 내에서 업링크를 많이 사용하는 비디오 모니터링 부문으로 확대될 것으로 예측됩니다. 통신 사업자들은 이미 산업용 이용 사례에 맞추어 지연 시간 및 처리량 등급에 따른 단계적 슬라이스를 제공함으로써 주파수 대역 자산의 수익화를 추진하고 있으며, LPWAN의 경제성을 인정하면서도 셀룰러 통신의 우위를 강화하고 있습니다.
전 세계 IoT 기기 도입의 급증
GSMA Intelligence의 조사에 따르면, 2024년 말 기준 전 세계 IoT 연결 건수는 175억 건에 달했으며, 그중 32억 건이 라이선스 기반의 셀룰러 네트워크를 이용하고 있었습니다. 2024년에는 북미와 유럽의 보험사들이 데이터를 공유하는 운전자에게 최대 30%의 보험료 할인을 적용하는 ‘사용량 기반 보험료’ 제도를 도입함에 따라, 자동차 텔레매틱스 부문에서 1억 2,000만 건의 신규 셀룰러 연결이 추가되었습니다. 인도의 첨단 계량 인프라(AMI) 프로그램에서는 5,000만 대의 스마트 전력 계량기가 도입되었습니다. 각 계량기에는 15년간의 셀룰러 계약이 포함되어 있어 서비스 제공업체에 예측 가능한 수익을 보장하고 있습니다. 다양한 기기가 혼재되어 있어 규모 확대가 복잡해지고 있습니다. 단일 스마트 시티 프로젝트만 해도 200가지 유형의 하드웨어 모델과 40가지 유형의 펌웨어 트랙이 포함될 수 있어, 통합된 기기 관리 플랫폼에 대한 수요가 높아지고 있습니다. 기업이 서비스 수준 계약(SLA)에 따라 다중 벤더 기기군의 프로비저닝, 모니터링, 보안 확보를 수행하는 관리형 서비스 공급업체에 이러한 복잡한 업무를 위탁함으로써 M2M 서비스 시장은 혜택을 얻게 됩니다.
심화되는 사이버 보안 및 데이터 개인정보 보호 위험
미국 사이버보안 및 인프라 보안국(CISA)의 기록에 따르면, 2024년에는 47건의 공개된 IoT 보안 침해 사고가 발생하여 전년의 29건에서 증가했습니다. 이에 따른 시정 비용의 중앙값은 280만 달러였습니다. GDPR(EU 개인정보보호규정) 위반에 따른 벌금은 전 세계 매출의 4%에 달할 수 있기 때문에 기업들은 하드웨어 보안 요소, 제로 트러스트 아키텍처, 72시간 이내의 침해 통지 절차를 요구하고 있습니다. 미국 식품의약국(FDA)은 현재 커넥티드 의료기기에 대해 소프트웨어 부품 목록(SBOM) 공개를 의무화하고 있으며, 이로 인해 인증 주기가 최대 9개월까지 연장되고 있습니다. 사이버 보험 인수사는 이러한 요건을 보험료 산정에 반영하고 있어, 의료기기 1대당 부품 목록에 대해 3-8달러의 추가 비용이 발생하고 있습니다. 그 결과, 2024년에는 규제 대상 업종에서 보안 서비스 부가율이 20%를 넘어섰습니다. 인증된 암호화, 지속적인 모니터링, 무선 패치 적용을 패키지로 제공할 수 있는 공급업체는 시장 점유율을 확대하는 반면, 규정 준수 인증을 갖추지 못한 벤더는 조달 대상에서 제외됨에 따라, 이는 M2M 서비스 시장 전체의 연평균 성장률(CAGR)을 억제하는 요인으로 작용하고 있습니다.
부문 분석
기업들이 SIM 수명 주기 관리, 로밍 최적화, 규제 준수를 외부에 위탁한 결과, 매니지드 서비스가 2025년 매출의 63.92%를 차지하며 머신 투 머신(M2M) 서비스 시장의 성숙도를 여실히 보여주었습니다. 프로페셔널 서비스는 통합, 애플리케이션 개발, 교육을 제공하며, 레거시 SCADA, ERP, MES 시스템을 클라우드 네이티브 분석 기능과 연동하려는 수요가 증가함에 따라 2031년까지 연평균 성장률(CAGR) 12.52%로 확대될 것으로 예측됩니다. 주요 에너지 기업들은 2G 원격 측정에서 LTE-M 게이트웨이로의 원활한 전환을 보장하기 위해, 3년간의 관리형 연결 계약과 6개월간의 전문 서비스 계약을 결합한 세계 eSIM 구축을 추진하고 있습니다. 매출 총이익률이 50%를 초과하는 전문 서비스 계약이 유리하지만, 벤더들은 이를 정기적인 연결 수익과 결합함으로써 수익 변동을 억제하고 있습니다. 인재 육성 모듈은 도입 장벽을 해결하기 위한 것으로, 벤더는 프로젝트 실패 위험을 줄이고 수년에 걸친 계약 갱신을 보장하기 위해 작업 명세서(SOW)에 운영자 교육 및 변경 관리 워크숍을 포함하는 경우가 많습니다.
도입 2년 차 이후, 매니지드 서비스 구매자는 데이터 파이프라인을 최적화하고 엣지에서 AI 추론 엔진을 통합하는 전문 서비스로 전환하는 경우가 많습니다. 이러한 교차 판매 동향은 고객 생애 가치를 연장하고, 머신 투 머신(M2M) 서비스 시장의 전반적인 수익성을 향상시킵니다. 셀프 서비스 포털을 통해 온보딩, 진단, 청구를 자동화하는 제공업체는 한계 비용으로 수천 개의 소규모 계정을 처리할 수 있으며, 엔지니어링 인력을 고부가가치 전문 프로젝트에 배정할 수 있습니다. 새로운 규제로 인해 실시간 규정 준수 보고가 요구되는 가운데, 보안 분석 및 지역별 데이터 주권 옵션을 통합한 매니지드 서비스 포트폴리오는 프리미엄 가격을 책정할 수 있게 됩니다.
2025년 매출의 73.90%는 셀룰러 연결이 차지할 것이며, 그 주축은 자동차, 공공 서비스, 물류 부문에서의 LTE-M 및 NB-IoT 도입이 될 것입니다. 2G 및 3G 서비스 종료가 임박함에 따라 차량 소유자는 차량당 150-300달러를 들여 모뎀을 교체해야할 것이며, 이로 인해 모듈 공급업체와 통신 사업자의 단기 매출 증가가 예상됩니다. LoRaWAN이나 Sigfox와 같은 LPWAN 기술은 170개국에 보급되어 10년의 배터리 수명과 5달러 미만의 모듈 가격을 실현하고 있으며, 농업 및 환경 모니터링 부문에서 높은 수요를 끌고 있습니다. LoRa 지원 기기의 출하 대수는 2024년에 3억 대를 돌파했습니다. 위성 IoT는 전년 대비 18%의 성장을 기록했습니다. 이는 해운, 항공, 광업 분야의 고객들이 일반적으로 셀룰러 통신을 기본으로 하되, 지상 통신의 커버리지 범위가 끊길 때 L-밴드 또는 저궤도(LEO) 링크로 전환되는 하이브리드 단말기를 채택했기 때문입니다.
현재 경쟁의 초점은 5G RedCap에 쏠려 있습니다. 이는 비용과 전력 소비를 억제하면서도 100Mbps의 업링크 속도를 실현한다고 알려져, 대규모 IoT와 광대역 카테고리 간의 경계를 모호하게 만들고 있습니다. 셀룰러 연결 분야의 M2M(머신 투 머신) 서비스 시장 규모는 계속해서 지배적인 위치를 유지할 것으로 예상되지만, 2031년까지 LPWAN의 연평균 성장률(CAGR)이 13.05%를 나타낼 것이라는 점은 획일적인 접근 방식이 아닌, 이용 사례에 따른 경제성을 추구하는 전략적 전환을 부각시키고 있습니다. 멀티 베어러 오케스트레이션과 지능형 트래픽 스티어링을 갖춘 제공업체는 기업들이 지연 시간, 대역폭, 전력 소비 제약에 맞추어 최적화된 연결 포트폴리오를 채택함에 따라 고객 이탈률을 낮출 것으로 보입니다.
지역별 분석
아시아태평양은 2025년 전 세계 총 수익의 37.88%를 차지했습니다. 이는 차이나모바일의 2억 3,000만 회선 NB-IoT와 인도의 ‘스마트 시티 미션’이 주도한 결과입니다. 이 미션은 커넥티드 가로등, 폐기물 관리, 교통 시스템에 2,000억 루피(24억 달러)를 투자할 것을 약속하고 있습니다. 일본에서는 5G 독립형(SA) 방식의 커버리지율이 95%에 달하며, 오사카와 도쿄에서 진행 중인 로봇 공학 시범 프로젝트를 뒷받침하고 있습니다. 한편, 한국의 통신 사업자들은 제조업 고객을 대상으로 엣지 컴퓨팅과 연결 서비스를 패키지로 제공합니다.
중동은 사우디아라비아의 5,000억 달러 규모 NEOM 스마트 인프라 프로그램과 아랍에미리트가 2025년까지 300만 대의 스마트 계량기를 설치하겠다는 방침에 힘입어, 2031년까지 연평균 성장률(CAGR) 13.34%를 나타낼 것으로 예측됩니다. 아프리카에서는 남아프리카공화국, 케냐, 나이지리아에 도입이 집중되어 있으며, 이들 국가에서는 모바일 머니 플랫폼이 IoT 지원 가정용 태양광 발전 시스템과 연동되어 사용량 기반 자금 조달을 가능하게 하고 있습니다.
북미에서는 보급이 성숙 단계에 접어들었습니다. Verizon은 2,700만 건의 연결을 지원하고 있지만, 2G/3G 서비스 종료의 영향으로 신규 계약 증가분이 상쇄되어 전년 대비 보합세를 보이고 있습니다. 유럽에서는 GDPR(EU 개인정보보호규정)에 따른 데이터 거주 요건이 지역 기업 시장 진입을 뒷받침하고 있으며, Vodafone은 2024 회계연도에 12억 유로(13억 달러)의 IoT 매출을 기록할 전망입니다. 라틴아메리카의 성장은 브라질 농업을 중심으로 전개되고 있으며, NB-IoT 연결을 활용해 작물의 수분 함량을 모니터링하고 물류를 최적화하고 있습니다. 전반적으로 각 지역의 정책 및 인프라 투자를 통해 건전한 수요 파이프라인이 유지되고 있으며, 이것이 전 세계 M2M(머신 투 머신) 서비스 시장의 기반이 되고 있습니다.
기타 혜택
- 엑셀 형식 시장 예측(ME) 시트
- 3개월간 애널리스트 지원
자주 묻는 질문
목차
제1장 서론
제2장 조사 방법
제3장 주요 요약
제4장 시장 구도
제5장 시장 규모와 성장 예측
제6장 경쟁 구도
제7장 시장 기회와 향후 전망
LSH 26.09.02According to Mordor Intelligence, the machine to machine (M2M) services market size is expected to grow from USD 57.18 billion in 2025 to USD 62.99 billion in 2026 and is forecast to reach USD 102.12 billion by 2031 at 10.16% CAGR over 2026-2031.
This report is Segmented by Type (Managed Service, and Professional Service), Connectivity Technology (Cellular 2G-5G, LPWAN, Satellite, and Wired), Service Model (Connectivity, Device Management, and More), End User (Retail, Banking, Telecom, and More), and Geography. The Market Forecasts are Provided in Terms of Value (USD).
Global Machine To Machine (M2M) Services Market Trends and Insights
Proliferation of LPWAN and 5G Networks
Standalone 5G cores now operate in 47 countries, enabling network slices that guarantee sub-10 millisecond latency for robotics and autonomous vehicles while reserving low-cost NB-IoT slices for massive sensor traffic. China Mobile closed 2024 with 230 million NB-IoT connections and average monthly revenue per unit near CNY 2 (USD 0.28). In Europe, 34% of enterprises specified LPWAN for new deployments in 2024, up from 22% the prior year, reflecting demand for 10-year battery life in agriculture and environmental monitoring. As chipset prices for 5G RedCap modules approach LTE-M parity by 2026, the M2M services market will expand into uplink-intensive video surveillance within 1 watt power budgets. Operators are already monetizing spectrum assets by offering tiered slices that match latency and throughput classes to industrial use cases, reinforcing cellular primacy while acknowledging LPWAN economics.
Surge in Global IoT Device Deployments
GSMA Intelligence tracked 17.5 billion IoT connections worldwide by year-end 2024, of which 3.2 billion used licensed cellular networks. Automotive telematics added 120 million new cellular links during 2024 as insurers in North America and Europe adopted usage-based premiums that cut rates up to 30% for data-sharing drivers. India's Advanced Metering Infrastructure program deployed 50 million smart electric meters, each bundled with 15-year cellular contracts that guarantee predictable revenue for service providers. Device heterogeneity complicates scale: a single smart-city project can encompass 200 hardware models and 40 firmware tracks, increasing demand for unified device-management platforms. The M2M services market benefits when enterprises outsource this complexity to managed-service vendors that can provision, monitor, and secure multivendor fleets under service-level agreements.
Escalating Cybersecurity and Data-Privacy Risks
The U.S. Cybersecurity and Infrastructure Security Agency logged 47 public IoT breaches in 2024, up from 29 the prior year, with median remediation expenses of USD 2.8 million. GDPR violations can reach 4% of global revenue, motivating enterprises to demand hardware secure elements, zero-trust architectures, and 72-hour breach-notification processes. The U.S. FDA now requires software bill-of-materials disclosures for connected medical devices, extending certification cycles by up to nine months. Cyber-insurance underwriters fold these mandates into premium calculations, adding USD 3 to USD 8 to each device bill of materials. As a result, security-service attach rates exceeded 20% in regulated verticals during 2024. Providers that can bundle certified encryption, continuous monitoring, and over-the-air patching will gain share, whereas vendors lacking compliance credentials face procurement exclusion, tempering the overall CAGR of the M2M services market.
Other drivers and restraints analyzed in the detailed report include:
- Adoption of Managed Connectivity Platforms
- Regulatory Mandates for Smart Metering and e-Call
- Fragmented Interoperability Standards
For complete list of drivers and restraints, kindly check the Table Of Contents.
Segment Analysis
Managed services generated 63.92% of 2025 revenue as enterprises outsourced SIM lifecycle management, roaming optimization, and regulatory compliance, underscoring the maturity of the machine to machine (M2M) services market. Professional services deliver integration, application development, and training; they are projected to expand at a 12.52% CAGR through 2031, reflecting the growing need to mesh legacy SCADA, ERP, and MES systems with cloud-native analytics. Large energy firms are commissioning global eSIM rollouts that bundle three-year managed connectivity contracts with six-month professional-services engagements to ensure smooth migration from 2G telemetry to LTE-M gateways. The gross-margin profile favors professional engagements at more than 50%, yet vendors temper volatility by coupling them with recurring connectivity revenue. Workforce-development modules address adoption hurdles; vendors frequently embed operator training and change-management workshops within statements of work to cut project-failure risk and cement multiyear renewals.
In year-two and beyond, managed-service buyers often graduate to professional engagements that optimize data pipelines and integrate AI inference engines at the edge. This cross-sell dynamic prolongs customer lifetime value and lifts the blended profitability of the machine to machine (M2M) services market. Providers that automate onboarding, diagnostics, and billing through self-service portals can serve thousands of small accounts at marginal cost, freeing engineering talent for high-value professional projects. As emerging regulations demand real-time compliance reporting, managed-service portfolios that embed security analytics and regional data-sovereignty options will command premium pricing.
Cellular connections captured 73.90% of 2025 revenue, anchored by LTE-M and NB-IoT deployments in automotive, utilities, and logistics. The looming sunset of 2G and 3G services forces fleet owners to retrofit modems at USD 150-USD 300 per unit, creating a short-term uplift for module vendors and operators. LPWAN technologies such as LoRaWAN and Sigfox reached 170 countries, offering 10-year battery life and sub-USD 5 modules that appeal to agriculture and environmental monitoring. LoRa-enabled device shipments passed 300 million in 2024. Satellite IoT grew 18% year-over-year as maritime, aviation, and mining customers embraced hybrid terminals that default to cellular but switch to L-band or low-Earth-orbit links when terrestrial coverage fades.
Competition now centers on 5G RedCap, which promises 100 Mbps uplinks at reduced cost and power, blurring lines between massive-IoT and broadband categories. The machine to machine (M2M) services market size for cellular connections is expected to remain dominant, yet LPWAN's 13.05% CAGR through 2031 highlights a strategic shift toward use-case-specific economics rather than a one-size-fits-all approach. Providers positioned with multi-bearer orchestration and intelligent traffic steering will mitigate churn as enterprises adopt connectivity portfolios tailored to latency, bandwidth, and power-consumption constraints.
Complete Report Scope:
- By Type
- Managed Service
- Professional Service
- By Connectivity Technology
- Cellular (2G - 5G)
- LPWAN (NB-IoT / LTE-M / LoRa / Sigfox)
- Satellite
- Wired (Ethernet / xDSL)
- By Service Model
- Connectivity Service
- Device Management Service
- Data Management and Analytics Service
- Security Service
- Application Enablement Service
- By End User
- Retail
- Banking and Financial Institutions
- Telecom and IT
- Healthcare
- Automotive
- Oil and Gas
- Transportation
- Utilities
- Manufacturing
- Agriculture
- Smart Cities
- Consumer Electronics
- By Geography
- North America
- United States
- Canada
- Mexico
- South America
- Brazil
- Argentina
- Chile
- Rest of South America
- Europe
- United Kingdom
- Germany
- France
- Italy
- Spain
- Rest of Europe
- Asia-Pacific
- China
- Japan
- India
- South Korea
- Australia and New Zealand
- Rest of Asia-Pacific
- Middle East and Africa
- Middle East
- United Arab Emirates
- Saudi Arabia
- Turkey
- Rest of Middle East
- Africa
- South Africa
- Kenya
- Nigeria
- Rest of Africa
- Middle East
- Europe
- United Kingdom
- Germany
- France
- Italy
- Spain
- Rest of Europe
- Asia-Pacific
- China
- Japan
- India
- South Korea
- Australia and New Zealand
- Rest of Asia-Pacific
- Middle East and Africa
- Middle East
- United Arab Emirates
- Saudi Arabia
- Turkey
- Rest of Middle East
- Africa
- South Africa
- Kenya
- Nigeria
- Rest of Africa
- Middle East
- North America
Geography Analysis
Asia Pacific generated 37.88% of global 2025 revenue, driven by China Mobile's 230 million NB-IoT lines and India's Smart Cities Mission, which committed INR 200 billion (USD 2.4 billion) for connected street lighting, waste management, and traffic systems. Japan's 95% 5G standalone coverage supports robotics pilots in Osaka and Tokyo, while South Korean operators bundle edge computing with connectivity for manufacturing clients.
The Middle East is forecast to grow at a 13.34% CAGR through 2031, buoyed by Saudi Arabia's USD 500 billion NEOM smart-infrastructure program and the UAE's mandate to install 3 million smart meters by 2025. Africa's adoption clusters in South Africa, Kenya, and Nigeria, where mobile-money platforms integrate IoT-enabled solar home systems that allow pay-as-you-go financing.
North America shows mature penetration; Verizon supports 27 million connections, flat year-over-year as 2G/3G sunsets offset new wins. Europe leverages GDPR-driven data-residency requirements that encourage regional players, with Vodafone generating EUR 1.2 billion (USD 1.3 billion) in IoT revenue for fiscal 2024. Latin America's growth centers on Brazilian agriculture, where NB-IoT links monitor crop moisture and optimize logistics. Collectively, regional mandates and infrastructure investments maintain a healthy demand pipeline that anchors the global machine to machine (M2M) services market.
- AT&T Inc.
- Verizon Communications Inc.
- Vodafone Group Plc
- China Mobile Communications Corporation
- Deutsche Telekom AG
- Rogers Communications Inc.
- International Business Machines Corporation
- Cisco Systems Inc.
- Huawei Technologies Co. Ltd.
- Intel Corporation
- Thales Group
- Amdocs Ltd.
- EE Ltd.
- Nokia Corporation
- Comarch S.A.
- KORE Wireless Group Inc.
- Sierra Wireless Inc.
- Telit Cinterion
- Aeris Communications Inc.
- 1NCE GmbH
- Emnify GmbH
- Transatel S.A.S.
- Orange Business Services
- Transatel S.A.S.
Additional Benefits:
- The market estimate (ME) sheet in Excel format
- 3 months of analyst support
TABLE OF CONTENTS
1 INTRODUCTION
- 1.1 Study Assumptions and Market Definition
- 1.2 Scope of the Study
2 RESEARCH METHODOLOGY
3 EXECUTIVE SUMMARY
4 MARKET LANDSCAPE
- 4.1 Market Overview
- 4.2 Market Drivers
- 4.2.1 Proliferation of LPWAN and 5G Networks
- 4.2.2 Surge in Global IoT Device Deployments
- 4.2.3 Adoption of Managed Connectivity Platforms
- 4.2.4 Regulatory Mandates for Smart Metering and e-Call
- 4.2.5 AI-Driven Edge Analytics for Predictive Maintenance
- 4.2.6 Demand for End-to-End Subscription-Based M2M Solutions
- 4.3 Market Restraints
- 4.3.1 Fragmented Interoperability Standards
- 4.3.2 Escalating Cybersecurity and Data-Privacy Risks
- 4.3.3 High Initial Integration and Deployment Costs
- 4.3.4 Shortage of M2M-Skilled Workforce in Emerging Regions
- 4.4 Industry Value / Supply-Chain Analysis
- 4.5 Regulatory Landscape
- 4.6 Technological Outlook
- 4.7 Impact of Macroeconomic Factors on the Market
- 4.8 Porter's Five Forces Analysis
- 4.8.1 Bargaining Power of Suppliers
- 4.8.2 Bargaining Power of Buyers
- 4.8.3 Threat of New Entrants
- 4.8.4 Threat of Substitutes
- 4.8.5 Intensity of Competitive Rivalry
5 MARKET SIZE AND GROWTH FORECASTS (VALUE)
- 5.1 By Type
- 5.1.1 Managed Service
- 5.1.2 Professional Service
- 5.2 By Connectivity Technology
- 5.2.1 Cellular (2G - 5G)
- 5.2.2 LPWAN (NB-IoT / LTE-M / LoRa / Sigfox)
- 5.2.3 Satellite
- 5.2.4 Wired (Ethernet / xDSL)
- 5.3 By Service Model
- 5.3.1 Connectivity Service
- 5.3.2 Device Management Service
- 5.3.3 Data Management and Analytics Service
- 5.3.4 Security Service
- 5.3.5 Application Enablement Service
- 5.4 By End User
- 5.4.1 Retail
- 5.4.2 Banking and Financial Institutions
- 5.4.3 Telecom and IT
- 5.4.4 Healthcare
- 5.4.5 Automotive
- 5.4.6 Oil and Gas
- 5.4.7 Transportation
- 5.4.8 Utilities
- 5.4.9 Manufacturing
- 5.4.10 Agriculture
- 5.4.11 Smart Cities
- 5.4.12 Consumer Electronics
- 5.5 By Geography
- 5.5.1 North America
- 5.5.1.1 United States
- 5.5.1.2 Canada
- 5.5.1.3 Mexico
- 5.5.2 South America
- 5.5.2.1 Brazil
- 5.5.2.2 Argentina
- 5.5.2.3 Chile
- 5.5.2.4 Rest of South America
- 5.5.3 Europe
- 5.5.3.1 United Kingdom
- 5.5.3.2 Germany
- 5.5.3.3 France
- 5.5.3.4 Italy
- 5.5.3.5 Spain
- 5.5.3.6 Rest of Europe
- 5.5.4 Asia-Pacific
- 5.5.4.1 China
- 5.5.4.2 Japan
- 5.5.4.3 India
- 5.5.4.4 South Korea
- 5.5.4.5 Australia and New Zealand
- 5.5.4.6 Rest of Asia-Pacific
- 5.5.5 Middle East and Africa
- 5.5.5.1 Middle East
- 5.5.5.1.1 United Arab Emirates
- 5.5.5.1.2 Saudi Arabia
- 5.5.5.1.3 Turkey
- 5.5.5.1.4 Rest of Middle East
- 5.5.5.2 Africa
- 5.5.5.2.1 South Africa
- 5.5.5.2.2 Kenya
- 5.5.5.2.3 Nigeria
- 5.5.5.2.4 Rest of Africa
- 5.5.5.1 Middle East
- 5.5.6 Europe
- 5.5.6.1 United Kingdom
- 5.5.6.2 Germany
- 5.5.6.3 France
- 5.5.6.4 Italy
- 5.5.6.5 Spain
- 5.5.6.6 Rest of Europe
- 5.5.7 Asia-Pacific
- 5.5.7.1 China
- 5.5.7.2 Japan
- 5.5.7.3 India
- 5.5.7.4 South Korea
- 5.5.7.5 Australia and New Zealand
- 5.5.7.6 Rest of Asia-Pacific
- 5.5.8 Middle East and Africa
- 5.5.8.1 Middle East
- 5.5.8.1.1 United Arab Emirates
- 5.5.8.1.2 Saudi Arabia
- 5.5.8.1.3 Turkey
- 5.5.8.1.4 Rest of Middle East
- 5.5.8.2 Africa
- 5.5.8.2.1 South Africa
- 5.5.8.2.2 Kenya
- 5.5.8.2.3 Nigeria
- 5.5.8.2.4 Rest of Africa
- 5.5.8.1 Middle East
- 5.5.1 North America
6 COMPETITIVE LANDSCAPE
- 6.1 Market Concentration
- 6.2 Strategic Moves
- 6.3 Market Share Analysis
- 6.4 Company Profiles (includes Global-level Overview, Market-level Overview, Core Segments, Financials as available, Strategic Information, Market Rank / Share for key companies, Products and Services, and Recent Developments)
- 6.4.1 AT&T Inc.
- 6.4.2 Verizon Communications Inc.
- 6.4.3 Vodafone Group Plc
- 6.4.4 China Mobile Communications Corporation
- 6.4.5 Deutsche Telekom AG
- 6.4.6 Rogers Communications Inc.
- 6.4.7 International Business Machines Corporation
- 6.4.8 Cisco Systems Inc.
- 6.4.9 Huawei Technologies Co. Ltd.
- 6.4.10 Intel Corporation
- 6.4.11 Thales Group
- 6.4.12 Amdocs Ltd.
- 6.4.13 EE Ltd.
- 6.4.14 Nokia Corporation
- 6.4.15 Comarch S.A.
- 6.4.16 KORE Wireless Group Inc.
- 6.4.17 Sierra Wireless Inc.
- 6.4.18 Telit Cinterion
- 6.4.19 Aeris Communications Inc.
- 6.4.20 1NCE GmbH
- 6.4.21 Emnify GmbH
- 6.4.22 Transatel S.A.S.
- 6.4.23 Orange Business Services
- 6.4.24 Transatel S.A.S.
7 MARKET OPPORTUNITIES AND FUTURE OUTLOOK
- 7.1 White-Space and Unmet-Need Assessment


