

|
시장보고서
상품코드
2121822
하이드로퀴논 : 시장 점유율 분석, 업계 동향과 통계, 성장 예측(2026-2031년)Hydroquinone - Market Share Analysis, Industry Trends & Statistics, Growth Forecasts (2026 - 2031) |
||||||
 Mordor Intelligence
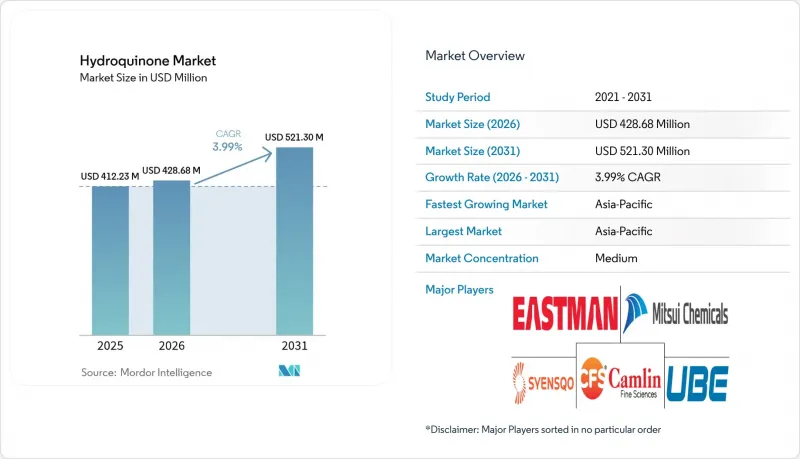
Mordor Intelligence에 따르면 하이드로퀴논 시장 규모는 2025년 4억 1,223만 달러에서 2026년에는 4억 2,868만 달러로 확대하며, 2031년까지 5억 2,130만 달러에 달할 것으로 예상되고 있으며, 2026-2031년에 CAGR 3.99%로 성장할 전망입니다.
이 보고서는 제조 공정(쿠멘 하이드로퍼옥사이드법, 페놀의 H₂O₂에 의한 하이드록실화, 아닐린산화),용도(중간체, 산화방지제, 중합억제제, 감광성 화학물질), 최종 용도 산업(폴리머, 화장품, 도료·접착제, 고무, 기타), 지역(아시아태평양, 북미, 유럽, 남미, 중동 및 아프리카)별로 분류되어 있습니다.
세계 하이드로퀴논 시장의 동향 및 분석
식품 포장에서 비페놀계 산화방지제 수요 증가
현재 식품 가공업체들은 포장 식품의 약 40%에 tert-부틸하이드로퀴논(TBHQ)을 첨가하고 있습니다. 이는 TBHQ가 튀김 오일의 온도에서도 효과를 유지하며, 기존 페놀계 산화방지제에 비해 산소 흡수를 100분의 1로 줄일 수 있기 때문입니다. 전 세계 TBHQ 매출은 2025년에 82억 1,600만 달러에 달할 것으로 예상되며, 2032년까지 연평균 성장률(CAGR) 4.2%를 기록하며 109억 5,800만 달러를 넘어설 것으로 전망되어, 하이드로퀴논 시장 전체의 성장 궤도를 크게 상회하고 있습니다. WHO와 FDA가 정한 체중 1kg당 0.2mg이라는 섭취 상한치에 따라 배합 기준이 표준화되었으며, 수요는 스낵 과자나 레디밀의 판매량과 직접적으로 연동됩니다. Camlin Fine Sciences와 같이 자체적으로 TBHQ 생산 능력을 보유한 제조업체는 식품 포장 가공업체와 장기 공급 계약을 체결함으로써 화장품 부문의 규제 변동 위험을 헤지할 수 있습니다. ISO 22000 및 FSSC 22000 인증은 조달의 필수 조건으로 부상하고 있으며, 추적성을 확보하고 GMP를 준수하는 생산 라인에 투자하는 공급업체가 높이 평가받고 있습니다.
아시아내 중합 억제제 생산 능력 증강
인도의 다헤지(Dahhez) 사업장에서는 하이드로퀴논의 명목 생산 능력을 2020년 연간 1만 MTPA에서 2022년까지 1만 5,000 MTPA로 확대하여, 에너지 집약적인 유럽 공장보다 낮은 비용 구조를 실현하고 있습니다. 10-300ppm 농도로 첨가되는 메틸에틸하이드로퀴논(MEHQ)은 운송 중 아크릴산을 안정화시키며, 최신 분광 분석 장비를 통해 실시간으로 ±0.22ppm의 정확도를 유지할 수 있게 되었습니다. 열대 기후의 영향으로 인해 억제제의 유지 시간은 80°C에서 50시간에서 90°C에서 12시간으로 단축되므로, 동남아시아의 모노머 제조 설비에서는 연속 첨가 시스템이 도입되어 있습니다. 중국 수출업자들은 공급량을 늘리고 있으며, 이로 인해 지역 가격은 낮은 수준으로 억제되고, 유럽 생산자들은 생산량 감축을 강요받고 있지만, 신규 MMA 및 아크릴산 생산 라인에 따른 아시아의 수요가 2027년까지 공급 과잉분을 흡수할 것으로 예상됩니다. MEHQ와 아크릴 모노머 인수 계약을 결합한 통합 시설은 공급량의 안정성과 더 양호한 운전 자금 순환의 혜택을 누리고 있습니다.
씻어내지 않는 화장품에 대한 ECHA의 REACH 규정
하이드로퀴논은 부속서 II의 항목 1339에 따라 화장품에 대한 사용이 금지되어 있으며, 부속서 III의 항목 14에 따른 인공 네일 시스템에 대한 사용에 한해 0.02%의 허용 범위가 설정되어 있습니다. 2024년 규제 강화로 인해 알부틴 유도체를 통한 간접적인 공급 채널이 배제되었고, 광범위한 제품 리콜이 발생하여 안정적이던 수요의 10-15%가 거의 하룻밤 사이에 사라졌습니다. 또한 이 화합물은 발암성 카테고리 2(Carc. 2)와 변이원성 카테고리 2(Muta. 2)로 분류되어 있으며, 배합 개발자들이 틈새 시장에서의 적용 예외를 요청하는 것을 주저하게 만들고 있습니다. 미국 환경보호청(EPA)이 설정한 잠정 경구 기준 용량 0.04mg/kg/일은 경피 노출과 관련된 법적 책임 위험을 높이고 있습니다. 하류 공정에서 TBHQ나 MEHQ로 다각화를 꾀하지 않은 생산자는 상당한 수익 급감에 직면하게 될 것입니다.
부문 분석
2025년에는 쿠멘 하이드로퍼옥사이드 공정이 하이드로퀴논 시장 점유율의 54.36%를 차지했습니다. 이는 제품별 아세톤의 경제성이 양호하기 때문입니다. 그러나 유럽 및 북미의 사업자들이 폐기물 처리 비용 절감과 설비 투자 감소를 요구하는 가운데, 페놀의 H2O2를 이용한 하이드록실화는 연평균 성장률(CAGR) 4.52%로 확대되고 있습니다. Cu(II)-비피리딘 촉매를 이용한 연속류 반응기를 통해 페놀의 전환 효율이 향상되고 있으며, 이는 가격 변동에 따라 원료를 전환할 수 있는 모듈식 플랜트로의 대대적인 전환을 시사합니다.
정제 부하 감소, 아세톤 발생 없음, 신속한 가동 개시가 가능하다는 점으로 인해 과산화수소(H₂O₂) 시스템은 인근 아크릴산 콤플렉스에 공급을 하는 동남아시아의 신규 진입 기업에게 매력적인 선택지가 되고 있습니다. 벤젠의 직접 산화 및 아닐린을 기반으로 하는 제조 경로는 여전히 틈새 시장으로 남아 있지만, 니트로벤젠이나 벤젠의 공급 과잉이 발생할 경우 전략적인 헤지 수단이 됩니다. 이스트먼(Eastman)과 같은 통합형 기업은 두 가지 제조 경로를 모두 갖춘 자산을 보유하고 있으며, 프로필렌이나 과산화수소의 스프레드가 확대될 경우 유연한 원료 차익거래를 수행할 수 있습니다.
지역별 분석
아시아태평양은 2025년에 매출 점유율 47.92%를 차지하며 하이드로퀴논 시장을 독점하고 있으며, 인도의 생산 능력 확대와 중국의 가격 주도형 수출 전략에 힘입어 연평균 성장률(CAGR) 4.33%로 성장하고 있습니다. 가격 인하로 인해 마진은 압박을 받고 있지만, 지역 생산자들은 아크릴산 콤플렉스와의 근접성과 낮은 에너지 요금의 혜택을 누리고 있습니다.
북미 시장은 아크릴 수지 제조업체의 MEHQ에 대한 활발한 수요와 스낵 식품 브랜드의 TBHQ 수요에 힘입고 있습니다. 이스트만(Eastman)사가 미국에서 전개하는 듀얼 루트 체제는 페놀 가격 변동을 완화하고 의약품 등급 제품의 납기 단축에 기여하고 있습니다.
유럽에서는 REACH 규제에 대응하는 비용과 전력 가격 급등이라는 이중의 역풍에 직면하여, 현지 생산 확대가 억제되고 있습니다. USP 등급의 하이드로퀴논이나 신규 산화방지제와 같은 프리미엄 틈새 시장이 일부 고순도 생산 시설을 지탱하고 있습니다. 남미, 중동 및 아프리카의 총 소비량은 세계 공급량에서 차지하는 비중이 낮으며, 주로 고무, 석유화학, 포장 용도로 수입하고 있습니다.
기타 혜택
- 엑셀 형식의 시장 예측(ME) 시트
- 3개월간 애널리스트 지원
자주 묻는 질문
목차
제1장 서론
제2장 조사 방법
제3장 개요
제4장 시장 구도
제5장 시장 규모와 성장 예측
제6장 경쟁 구도
제7장 시장 기회와 향후 전망
KSA 26.09.03According to Mordor Intelligence, the hydroquinone market size is expected to increase from USD 412.23 million in 2025 to USD 428.68 million in 2026 and reach USD 521.30 million by 2031, growing at a CAGR of 3.99% over 2026-2031.
This report is Segmented by Production Process (Cumene Hydroperoxide Route, H2O2 Hydroxylation of Phenol, and Aniline Oxidation), Application (Intermediate, Antioxidant, Polymerization Inhibitor, and Photosensitive Chemical), End-Use Industry (Polymers, Cosmetics, Paints and Adhesives, Rubber and More), and Geography (Asia-Pacific, North America, Europe, South America, and Middle-East and Africa).
Global Hydroquinone Market Trends and Insights
Rising Demand for Non-Phenolic Antioxidants in Food Packaging
Food processors now embed tert-butylhydroquinone (TBHQ) in about 40% of packaged foods because it remains effective at fry-oil temperatures and cuts oxygen uptake one-hundredfold compared with older phenolics. Global TBHQ sales reached USD 8.216 billion in 2025 and are set to top USD 10.958 billion by 2032 at a 4.2% CAGR, comfortably ahead of the broader hydroquinone market trajectory. WHO and FDA intake limits of 0.2 mg/kg body weight have standardized formulation practices, linking demand directly to snack and ready-meal volumes. Manufacturers with integrated TBHQ capacity-such as Camlin Fine Sciences-can hedge regulatory swings in cosmetics by locking in long-term supply deals with food-packaging converters. Certification under ISO 22000 and FSSC 22000 is emerging as a purchasing prerequisite, rewarding suppliers that invest in traceable, GMP-compliant production lines.
Capacity Additions in Asia for Polymerization Inhibitors
India's Dahej hub ramped hydroquinone nameplate capacity from 10,000 MTPA in 2020 to 15,000 MTPA by 2022, offering a cost base lower than energy-intensive European plants. Methyl ethyl hydroquinone (MEHQ), dosed at 10-300 ppm, stabilizes acrylic acid in transit, and modern spectroscopic analyzers now maintain +- 0.22 ppm accuracy in real time. Tropical conditions shorten inhibitor hold-time from 50 hours at 80 °C to 12 hours at 90 °C, prompting continuous-dosing systems across Southeast Asian monomer units. Chinese exporters have amplified supply, keeping regional prices subdued and pressuring European producers to trim output, yet Asian demand from new MMA and acrylic acid lines is expected to absorb the glut by 2027. Integrated facilities that bundle MEHQ with acrylic monomer offtake agreements enjoy volume security and better working-capital cycles.
ECHA REACH Restrictions on Leave-On Cosmetics
Hydroquinone lists under Annex II entry 1339 as prohibited in cosmetics, with only a 0.02% allowance for artificial nail systems under Annex III entry 14. The 2024 tightening eliminated indirect delivery routes through arbutin derivatives, sparking widespread product recalls that removed a steady 10-15% demand slice almost overnight. The compound also holds Carc. 2 and Muta. 2 classifications, dissuading formulators from seeking niche exemptions. U.S. EPA's provisional oral reference dose of 0.04 mg/kg/day raises liability risks for dermal exposure. Producers without downstream TBHQ or MEHQ diversification face pronounced revenue cliffs.
Other drivers and restraints analyzed in the detailed report include:
- Growing Preference for Green H2O2 Hydroxylation Routes
- Up-Cycling of Lignin to HQ via Biocatalysis Unlocking Supply Flexibility
- Price Volatility of Cumene Feedstock
For complete list of drivers and restraints, kindly check the Table Of Contents.
Segment Analysis
The cumene hydroperoxide route provided 54.36% of hydroquinone market share in 2025, owing to its favorable co-product acetone economics. However, the H2O2 hydroxylation of phenol is expanding at a 4.52% CAGR as operators in Europe and North America seek lower waste-treatment costs and lighter capital investment. Continuous-flow reactors using Cu(II)-bipyridine catalysts have lifted phenol conversion efficiency, signaling a step change toward modular plants that switch feedstocks in response to price swings.
Lower purification loads, absence of acetone, and faster commissioning make H2O2 systems attractive to Southeast Asian entrants that supply nearby acrylic acid complexes. Direct benzene oxidation and aniline-based routes remain niche but offer strategic hedges where nitrobenzene or benzene overhangs exist. Integrated companies such as Eastman maintain dual-route assets, enabling agile raw-material arbitrage whenever propylene or hydrogen-peroxide spreads widen.
Complete Report Scope:
- By Production Process
- Cumene Hydroperoxide Route
- H2O2 Hydroxylation of Phenol
- Aniline Oxidation
- By Application
- Intermediate
- Antioxidant
- Polymerization Inhibitor
- Photosensitive Chemical
- By End-use Industry
- Polymers
- Cosmetics
- Paints and Adhesives
- Rubber
- Other End-use Industries
- By Geography
- Asia-Pacific
- China
- India
- Japan
- South Korea
- Malaysia
- Thailand
- Indonesia
- Vietnam
- Rest of Asia-Pacific
- North America
- United States
- Canada
- Mexico
- Europe
- Germany
- United Kingdom
- Italy
- France
- Russia
- Spain
- Turkey
- NORDIC Countries
- Rest of Europe
- South America
- Brazil
- Argentina
- Colombia
- Rest of South America
- Middle-East and Africa
- Saudi Arabia
- United Arab Emirates
- Qatar
- Egypt
- Nigeria
- South Africa
- Rest of Middle-East and Africa
- Asia-Pacific
Geography Analysis
Asia-Pacific dominated the hydroquinone market with a 47.92% revenue share in 2025 and is advancing at a 4.33% CAGR, fueled by India's capacity ramp-up and China's price-led export strategy. Although discounting compresses margins, regional producers benefit from proximity to acrylic-acid complexes and lower energy tariffs.
North America is supported by strong MEHQ pull from acrylic resin makers and TBHQ demand from snack-food brands. Eastman's dual-route set-up in the United States helps cushion phenol price gyrations and shortens lead times for pharmaceutical-grade shipments.
Europe faces the twin headwinds of REACH compliance costs and elevated electricity prices, restraining local output expansion. Nevertheless, premium niches such as USP-grade hydroquinone and novel antioxidants sustain select high-purity facilities. South America and the Middle-East and Africa collectively consume a low global supply, importing mainly for rubber, petrochemical, and packaging applications.
- Brother Technology
- Camlin Fine Sciences Ltd.
- Clean Science and Technology Limited
- Eastman Chemical Company
- FUJIFILM Wako Pure Chemical Corporation
- Haihang Industry
- Hubei Kaiyuan Chemicals & Technology Co., Ltd.
- Jiangsu Sanjili Chemical Co., LTD
- Mitsui Chemicals, Inc.
- Syensqo
- TIANJIN ZHONGXIN CHEMTECH CO.,LTD.(ZX CHEMTECH)
- UBE Corporation
- Yancheng Fengyang Chemical Co., Ltd.
Additional Benefits:
- The market estimate (ME) sheet in Excel format
- 3 months of analyst support
TABLE OF CONTENTS
1 Introduction
- 1.1 Study Assumptions and Market Definition
- 1.2 Scope of the Study
2 Research Methodology
3 Executive Summary
4 Market Landscape
- 4.1 Market Overview
- 4.2 Market Drivers
- 4.2.1 Rising demand for non-phenolic antioxidants in food packaging
- 4.2.2 Capacity additions in Asia for polymerization inhibitors
- 4.2.3 Growing preference for green H2O2 hydroxylation routes
- 4.2.4 Upcycling of lignin to HQ via biocatalysis unlocking supply flexibility
- 4.2.5 Emergence of HQ-dipalmitate as safer derivative broadens demand
- 4.3 Market Restraints
- 4.3.1 ECHA REACH restrictions on leave-on cosmetics
- 4.3.2 Price volatility of cumene feedstock
- 4.3.3 ESG-driven investor pull-out from phenolic value chains
- 4.4 Value Chain Analysis
- 4.5 Porter's Five Forces Analysis
- 4.5.1 Bargaining Power of Suppliers
- 4.5.2 Bargaining Power of Buyers
- 4.5.3 Threat of New Entrants
- 4.5.4 Threat of Substitutes
- 4.5.5 Degree of Competition
5 Market Size and Growth Forecasts (Value)
- 5.1 By Production Process
- 5.1.1 Cumene Hydroperoxide Route
- 5.1.2 H2O2 Hydroxylation of Phenol
- 5.1.3 Aniline Oxidation
- 5.2 By Application
- 5.2.1 Intermediate
- 5.2.2 Antioxidant
- 5.2.3 Polymerization Inhibitor
- 5.2.4 Photosensitive Chemical
- 5.3 By End-use Industry
- 5.3.1 Polymers
- 5.3.2 Cosmetics
- 5.3.3 Paints and Adhesives
- 5.3.4 Rubber
- 5.3.5 Other End-use Industries
- 5.4 By Geography
- 5.4.1 Asia-Pacific
- 5.4.1.1 China
- 5.4.1.2 India
- 5.4.1.3 Japan
- 5.4.1.4 South Korea
- 5.4.1.5 Malaysia
- 5.4.1.6 Thailand
- 5.4.1.7 Indonesia
- 5.4.1.8 Vietnam
- 5.4.1.9 Rest of Asia-Pacific
- 5.4.2 North America
- 5.4.2.1 United States
- 5.4.2.2 Canada
- 5.4.2.3 Mexico
- 5.4.3 Europe
- 5.4.3.1 Germany
- 5.4.3.2 United Kingdom
- 5.4.3.3 Italy
- 5.4.3.4 France
- 5.4.3.5 Russia
- 5.4.3.6 Spain
- 5.4.3.7 Turkey
- 5.4.3.8 NORDIC Countries
- 5.4.3.9 Rest of Europe
- 5.4.4 South America
- 5.4.4.1 Brazil
- 5.4.4.2 Argentina
- 5.4.4.3 Colombia
- 5.4.4.4 Rest of South America
- 5.4.5 Middle-East and Africa
- 5.4.5.1 Saudi Arabia
- 5.4.5.2 United Arab Emirates
- 5.4.5.3 Qatar
- 5.4.5.4 Egypt
- 5.4.5.5 Nigeria
- 5.4.5.6 South Africa
- 5.4.5.7 Rest of Middle-East and Africa
- 5.4.1 Asia-Pacific
6 Competitive Landscape
- 6.1 Market Concentration
- 6.2 Strategic Moves
- 6.3 Market Share (%)/Ranking Analysis
- 6.4 Company Profiles (includes Global level Overview, Market level overview, Core Segments, Financials as available, Strategic Information, Products and Services, and Recent Developments)
- 6.4.1 Brother Technology
- 6.4.2 Camlin Fine Sciences Ltd.
- 6.4.3 Clean Science and Technology Limited
- 6.4.4 Eastman Chemical Company
- 6.4.5 FUJIFILM Wako Pure Chemical Corporation
- 6.4.6 Haihang Industry
- 6.4.7 Hubei Kaiyuan Chemicals & Technology Co., Ltd.
- 6.4.8 Jiangsu Sanjili Chemical Co., LTD
- 6.4.9 Mitsui Chemicals, Inc.
- 6.4.10 Syensqo
- 6.4.11 TIANJIN ZHONGXIN CHEMTECH CO.,LTD.(ZX CHEMTECH)
- 6.4.12 UBE Corporation
- 6.4.13 Yancheng Fengyang Chemical Co., Ltd.
7 Market Opportunities and Future Outlook
- 7.1 White-space and Unmet-need Assessment


