

|
시장보고서
상품코드
2122239
팔레타이저 : 시장 점유율 분석, 업계 동향과 통계, 성장 예측(2026-2031년)Palletizer - Market Share Analysis, Industry Trends & Statistics, Growth Forecasts (2026 - 2031) |
||||||
 Mordor Intelligence
Mordor Intelligence에 따르면 팔레타이저 시장 규모는 2025년 33억 4,000만 달러에서 2026년에는 35억 4,000만 달러로 확대하며, 2026-2031년에 CAGR 6.12%로 추이하며, 2031년에는 47억 7,000만 달러에 달할 것으로 예측됩니다.
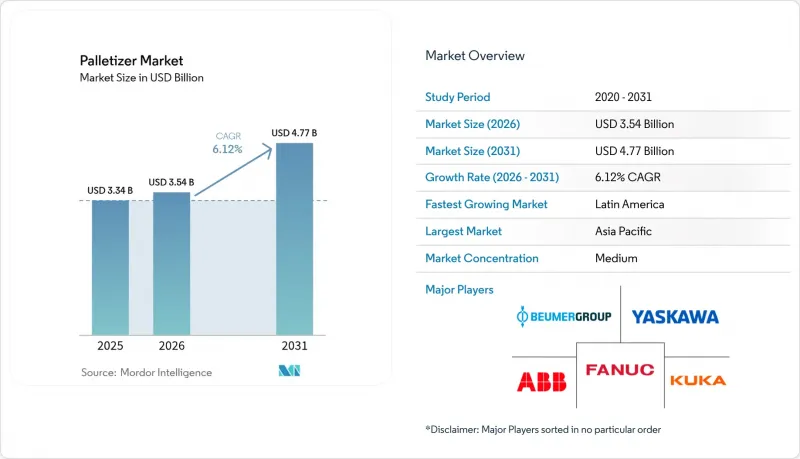
이 보고서는 제품 유형별(기존형 팔레타이저, 로봇식 팔레타이저), 적재 용량별(경량, 중량, 중량급),최종사용자 산업별(식품 및 음료, 의약품, 화학, E-Commerce 및 3PL 등), 판매 채널별(OEM에 대한 직접 판매, 시스템 통합사업자 등), 그리고 지역별로 분류되어 있습니다. 시장 예측은 금액(달러) 기준으로 제시되어 있습니다.
글로벌 팔레타이저 시장의 동향 및 인사이트
E-Commerce에서 SKU의 복잡성이 심화되고 있습니다.
풀필먼트 센터에서는 현재 연간 1,800억 케이스가 넘는 처리량을 처리하고 있으며, 단일 거점에서 5만개 이상의 SKU를 처리하고 있습니다. 이는 기존 소매 허브에서 흔히 볼 수 있는 SKU 다양성의 10배에 해당합니다. 고정 패턴의 설비로는 이를 충분히 감당할 수 없기 때문에 AI를 활용한 시스템(예: Lucas Warehouse Optimization Suite)의 도입이 진행되고 있습니다. 이 시스템은 무게, 파손 용이성, 적재 용이성을 실시간으로 균형 있게 조정함으로써 팔레타이징 효율을 15-20% 향상시킵니다. 프리미엄 플랫폼에서는 이익률이 30-40% 높아지지만, 적재 최적화를 통해 트레일러의 빈 공간을 최대 30%까지 줄일 수 있으므로 총 운송 비용은 여전히 낮게 유지됩니다.
인력 부족이 창고 자동화를 가속화
중국에서는 41개 공장 직종에서 심각한 인력 부족이 발생하고 있으며, 북미 창고에서는 15-20%의 결원율을 보이고 있으며, 자동화 투자 회수 기간이 18개월 미만으로 단축되었습니다. 중견 기업의 공장에서는 현재 시간당 단 100유닛에 불과한 생산 라인에서도 자동화가 진행되고 있으며, 협업형 시스템을 통해 직원이 더 안전하고 부가가치가 높은 업무로 재배치됨에 따라 팔레타이저 시장의 확대가 촉진되고 있습니다.
고적재량 로봇 암의 초기 설비 투자(CAPEX)가 고가
정격 150kg을 초과하는 시스템의 도입 비용은 종종 50만 달러를 초과하기도 하여, 하루 500팔레트 미만을 출하하는 제조업체에게는 장벽이 되고 있습니다. ‘Robotics-as-a-Service(RaaS)’의 선구자인 Formic사 등은 월 3,975달러의 패키지 플랜으로 이러한 장벽을 해소하고 있지만, 맞춤화 및 소유권과 관련된 절충점은 여전히 남아 있습니다.
부문 분석
2025년에도 기존 기계는 매출의 47.62%를 계속 차지하고 있습니다. 이는 시간당 1,000케이스를 초과하는 고속 라인에서 검증된 레이어링 장비에 의존하고 있기 때문입니다. 그러나 팔레타이저 시장에서는 협업형 유닛이 연평균 성장률(CAGR) 6.09%로 성장을 가속화하고 있으며, 안전 인증을 획득하고 펜스가 필요 없는 운영을 원하는 설치 면적이 작은 신규 거점에서의 투자를 유치하고 있습니다. 로봇식 관절 암은 중성능 부문을 차지하고 있으며, 다양한 제품 포트폴리오에 대응하기 위해 처리 능력과 전환 유연성 사이의 균형을 맞추고 있습니다. 레이어 포머와 로봇 피커를 결합한 하이브리드 시스템은 틈새 시장인 음료 및 퍼스널 케어 생산 셀에서 등장하고 있지만, 여전히 비용이 많이 드는 경향이 있습니다.
각 벤더사는 풀스택형 생태계를 통해 차별화를 꾀하고 있습니다. 예를 들어 두상(Doosan)의 ‘P-SERIES’와 로켓팜(RocketFarm)의 ‘Pally’ 소프트웨어를 결합함으로써 도입 시간을 단축하고 사용자의 자율성을 높이고 있습니다. 고객이 단일 하드웨어보다 원스톱 책임 체계를 우선시하는 가운데, 비전, 시뮬레이션, 수명주기 서비스를 묶어 제공하는 공급업체들은 팔레타이저 시장내 비즈니스 기회를 확대하고 있습니다.
중부하용 솔루션이 40.88%의 점유율을 차지하고 있는데, 이는 소비재 업계가 50-150kg 상자를 선호하는 경향을 반영한 것입니다. 그러나 대량 운송 업체들이 인건비와 운임을 절감하기 위해 화물을 통합하는 움직임이 확대됨에 따라 중하중용 팔레타이저 시장 규모는 연평균 성장률(CAGR) 7.18%로 확대될 전망입니다. 에너지 효율이 뛰어난 서보 아키텍처와 첨단 안전 스캐너 덕분에, Bob’s Red Mill의 도입 사례에서 볼 수 있듯이 180kg의 코봇이 직원과 병행하여 작동할 수 있게 되었습니다. 이러한 기능으로 인해 중급급 동종 제품에 비해 40-60%의 가격 상승이 나타나지만, 사용자들은 지게차 이동 횟수 감소 및 산재 보상 청구 감소를 통해 이 프리미엄 가격을 정당화하고 있습니다.
50kg 미만의 경량 셀은 클린룸 기준 준수와 정밀도가 단순한 육체 노동보다 더 중요시되는 제약 및 전자 분야에 대응하고 있습니다. 팔레타이저 시장의 이 분야를 겨냥하는 공급업체들은 고가 제품을 보호하기 위해 클래스 10 인증 인클로저와 진공 그리퍼를 활용하고 있으며, 안정적이긴 하지만 성장 속도는 비교적 완만합니다.
지역별 분석
아시아태평양(APAC)은 2025년 매출의 37.84%를 차지하며, 2022년까지 전 세계 신규 로봇의 52%가 중국 내에서 도입되었습니다. 현재 국내 공급업체들은 자국 시장의 36%를 확보하고 있으며, 이로 인해 가격 수준이 하락하고 2차 공장으로의 보급이 가속화되고 있습니다. 일본은 전 세계 로봇의 45%를 제조하고 있으며, 393억 달러(437억 달러) 규모의 정부 공급망 기금 지원을 받아 2024년에는 물류, 식품, 제약 분야에 73억 5,000만 달러 규모의 수주를 배정하고 있습니다. 인도의 생산 연계형 인센티브 제도는 자동차 및 제네릭 의약품 공장의 자동화를 촉진하고 있지만, 기술 격차로 인해 도입 현황에는 여전히 편차가 나타나고 있습니다.
남미는 브라질의 식품·자동차 부문이 수출 규제를 준수하기 위해 팔레트 조립 자동화를 추진하는 가운데, 2031년까지 연평균 성장률(CAGR) 7.86%라는 가장 강력한 성장 궤도를 보이고 있습니다. 멕시코는 니어쇼어링 추세를 타고 관세 대상이 아닌 상품을 미국 시장에 공급하고 있으며, 북미 안전 기준을 준수하는 로봇에 대한 수요가 증가하고 있습니다. 아르헨티나의 곡물 가공업체들은 거시경제의 변동에도 불구하고 장거리 해상 운송을 견딜 수 있도록 1톤 용량의 벌크백을 안정적으로 고정하는 팔레타이저를 도입하고 있습니다.
북미 및 유럽에서는 생산 능력 확대보다는 기존 설비의 갱신을 통한 완만한 성장이 예상됩니다. 향후 시행될 규정(EU) 2023/1230에 따라 공급업체는 사이버 보안 강화를 의무화하게 되며, 인증된 소프트웨어 스택을 보유한 기업이 우위를 점하게 될 것입니다. 미국의 리쇼어링(국내 복귀) 프로그램으로 인해 팔레타이저 시장이 활성화되고 있습니다. 이는 중소 제조업체들이 빈번한 SKU 전환에 대응하고, 지방의 고령화로 인한 노동력 부족을 완화할 수 있는 유연한 코봇을 요구하고 있기 때문입니다.
기타 혜택:
- 엑셀 형식의 시장 예측(ME) 시트
- 3개월간의 애널리스트 지원
자주 묻는 질문
목차
제1장 서론
제2장 조사 방법
제3장 개요
제4장 시장 구도
제5장 시장 규모와 성장 예측
제6장 경쟁 구도
제7장 시장 기회와 향후 전망
KSA 26.09.04According to Mordor Intelligence, the palletizer market size is expected to grow from USD 3.34 billion in 2025 to USD 3.54 billion in 2026 and is forecast to reach USD 4.77 billion by 2031 at 6.12% CAGR over 2026-2031.
This report is Segmented by Product (Conventional Palletizer, Robotic Palletizer), by Payload Capacity (Light-Duty, Medium-Duty, and Heavy-Duty), by End-User Vertical (Food & Beverages, Pharmaceuticals, Chemicals, E-Commerce and 3PL, and More), by Sales Channel (Direct OEM Sales, System Integrators, and More) and by Geography. The Market Forecasts are Provided in Terms of Value (USD).
Global Palletizer Market Trends and Insights
Growing e-commerce SKU complexity
Fulfilment centres now handle volumes that exceed 180 billion cases yearly, with single sites processing more than 50,000 SKUs-ten times the diversity typical of legacy retail hubs.Fixed-pattern equipment cannot keep up, prompting adoption of AI-powered systems such as the Lucas Warehouse Optimization Suite, which lifts palletizing efficiency 15-20% by balancing weight, fragility, and stackability in real time. Premium platforms fetch 30-40% higher margins but still lower total shipping cost as optimized loads cut empty trailer space by up to 30%.
Labor shortages accelerating warehouse automation
Critical staffing gaps across 41 factory occupations in China and 15-20% vacancy rates in North American warehouses have compressed automation payback to under 18 months. Mid-market plants now automate runs of just 100 units per hour, unlocking a broader palletizer market as collaborative systems redeploy employees to safer, higher-value roles.
High upfront CAPEX for heavy-payload robotic arms
Installations rated above 150 kg often top USD 500,000, a hurdle for manufacturers shipping fewer than 500 pallets daily. Robotics-as-a-service pioneers such as Formic counter this barrier with USD 3,975 monthly bundles, yet tradeoffs around customisation and ownership persist.
Other drivers and restraints analyzed in the detailed report include:
- Packaging-line ROI improvements from plug-and-play cobots
- Surge in FMCG sustainability mandates favouring robotic mixed-load palletizing
- Integration complexity with legacy MES/WMS
For complete list of drivers and restraints, kindly check the Table Of Contents.
Segment Analysis
Conventional machines retained 47.62% revenue in 2025 as high-speed lines exceeding 1,000 cases per hour depend on proven layer devices. Yet the palletizer market sees collaborative units outpace at 6.09% CAGR, capturing greenfield investments in small-footprint sites that crave safety-certified, fence-free operation. Robotic articulated arms occupy the mid-performance tier, balancing throughput against changeover flexibility for mixed product portfolios. Hybrid systems, blending layer formers with robotic pickers, emerge in niche beverage and personal-care cells but remain cost-intensive.
Vendors differentiate through full-stack ecosystems: Doosan's P-SERIES coupled with Rocketfarm's Pally software reduces deployment time and elevates user autonomy. As customers prioritise single-source accountability over stand-alone hardware, suppliers bundling vision, simulation, and lifecycle services widen addressable opportunities inside the palletizer market.
Medium-duty solutions dominated with 40.88% share, reflecting consumer goods' bias toward 50-150 kg boxes. However the palletizer market size for heavy-duty systems is slated to expand at a 7.18% CAGR as bulk shippers consolidate loads to curb labour and freight costs. Energy-efficient servo architectures and advanced safety scanners now let 180 kg cobots operate alongside staff, as seen in Bob's Red Mill installations. These capabilities command 40-60% price uplifts compared with mid-tier peers, yet users justify the premium through reduced forklift moves and lower workers' compensation claims.
Light-duty cells under 50 kg address pharmaceuticals and electronics, where cleanroom compliance and precision trump brute force. Vendors targeting this end of the palletizer market leverage class-10-rated enclosures and vacuum grippers to protect high-value items, maintaining a stable but slower growth profile.
Complete Report Scope:
- By Product Type
- Conventional Palletizer
- High-Level Palletizer
- Low-Level Palletizer
- Robotic Palletizer
- Cartesian/Gantry
- Articulated
- SCARA
- Collaborative (Cobot)
- Hybrid Palletizer
- Conventional Palletizer
- By Payload Capacity
- Light-Duty (<50 kg)
- Medium-Duty (50-150 kg)
- Heavy-Duty (>150 kg)
- By End-user Vertical
- Food & Beverages
- Pharmaceuticals
- Personal Care and Cosmetics
- Chemicals
- E-commerce and 3PL
- Other Verticals
- By Sales Channel
- Direct OEM Sales
- System Integrators
- After-market Retrofits and Upgrades
- Rental / Leasing
- By Geography
- North America
- United States
- Canada
- Mexico
- South America
- Brazil
- Argentina
- Rest of South America
- Europe
- Germany
- United Kingdom
- France
- Italy
- Russia
- Rest of Europe
- APAC
- China
- Japan
- India
- South Korea
- Rest of APAC
- Middle East & Africa
- United Arab Emirates
- Saudi Arabia
- South Africa
- Rest of Middle East and Africa
- North America
Geography Analysis
APAC held 37.84% of 2025 revenue, with China alone installing 52% of new global robots by 2022. Domestic suppliers now secure 36% of their home market, pushing price points lower and accelerating diffusion among tier-two factories. Japan built 45% of the world's robots and channelled USD 7.35 billion in 2024 orders into logistics, food, and pharma lines, backed by a USD 39.3 billion (USD 43.7 billion) government supply-chain fund . India's Production-Linked Incentive schemes spark automation across automotive and generics plants, though adoption pockets remain uneven due to skill gaps.
South America records the strongest 7.86% CAGR trajectory to 2031 as Brazil's food and auto sectors automate pallet building for export compliance. Mexico rides near-shoring trends to supply the US market with tariff-proof goods, intensifying demand for robots certified to North American safety codes. Argentina's grain processors install palletizers that stabilise 1-tonne bulk bags for long ocean voyages despite macroeconomic volatility.
North America and Europe show measured growth driven by replacement rather than capacity additions. Upcoming Regulation (EU) 2023/1230 compels vendors to harden cybersecurity, advantaging those with certified software stacks. US reshoring programs lift the palletizer market as SMB manufacturers seek flexible cobots that accommodate frequent SKU changeovers and mitigate labour constraints in ageing rural workforces.
- ABB Ltd.
- FANUC Corp.
- KUKA AG
- Yaskawa Electric Corp.
- BEUMER Group GmbH and Co. KG
- Honeywell Intelligrated
- Krones AG
- Sidel Group
- A-B-C Packaging
- Schneider Packaging
- Barry-Wehmiller (BW Packaging)
- Premier Tech Chronos
- MMCI Robotics
- Columbia Machine
- Fuji Yusoki
- Brenton Engineering
- Kawasaki Robotics
- Okura Yusoki
- Regal Rexnord Automation
- Sealed Air AUTOBAG
Additional Benefits:
- The market estimate (ME) sheet in Excel format
- 3 months of analyst support
TABLE OF CONTENTS
1 INTRODUCTION
- 1.1 Study Assumptions and Market Definition
- 1.2 Scope of the Study
2 RESEARCH METHODOLOGY
3 EXECUTIVE SUMMARY
4 MARKET LANDSCAPE
- 4.1 Market Overview
- 4.2 Market Drivers
- 4.2.1 Growing e-commerce SKU complexity
- 4.2.2 Labor shortages accelerating warehouse automation
- 4.2.3 Packaging-line ROI improvements from plug-and-play cobots
- 4.2.4 Surge in FMCG sustainability mandates favouring robotic mixed-load palletizing
- 4.2.5 AI-driven vision systems boosting palletizer uptime
- 4.2.6 Resilience re-shoring of supply chains in North America and EU
- 4.3 Market Restraints
- 4.3.1 High upfront CAPEX for heavy-payload robotic arms
- 4.3.2 Integration complexity with legacy MES/WMS
- 4.3.3 Safety-rating certification delays for cobots in EU
- 4.3.4 Volatile steel & servo-motor prices widening payback periods
- 4.4 Value / Supply-Chain Analysis
- 4.5 Regulatory Landscape
- 4.6 Technological Outlook
- 4.7 Porter's Five Forces
- 4.7.1 Bargaining Power of Suppliers
- 4.7.2 Bargaining Power of Buyers
- 4.7.3 Threat of New Entrants
- 4.7.4 Threat of Substitutes
- 4.7.5 Intensity of Competitive Rivalry
- 4.8 Pricing Analysis
5 MARKET SIZE AND GROWTH FORECASTS (VALUE)
- 5.1 By Product Type
- 5.1.1 Conventional Palletizer
- 5.1.1.1 High-Level Palletizer
- 5.1.1.2 Low-Level Palletizer
- 5.1.2 Robotic Palletizer
- 5.1.2.1 Cartesian/Gantry
- 5.1.2.2 Articulated
- 5.1.2.3 SCARA
- 5.1.2.4 Collaborative (Cobot)
- 5.1.3 Hybrid Palletizer
- 5.1.1 Conventional Palletizer
- 5.2 By Payload Capacity
- 5.2.1 Light-Duty (<50 kg)
- 5.2.2 Medium-Duty (50-150 kg)
- 5.2.3 Heavy-Duty (>150 kg)
- 5.3 By End-user Vertical
- 5.3.1 Food & Beverages
- 5.3.2 Pharmaceuticals
- 5.3.3 Personal Care and Cosmetics
- 5.3.4 Chemicals
- 5.3.5 E-commerce and 3PL
- 5.3.6 Other Verticals
- 5.4 By Sales Channel
- 5.4.1 Direct OEM Sales
- 5.4.2 System Integrators
- 5.4.3 After-market Retrofits and Upgrades
- 5.4.4 Rental / Leasing
- 5.5 By Geography
- 5.5.1 North America
- 5.5.1.1 United States
- 5.5.1.2 Canada
- 5.5.1.3 Mexico
- 5.5.2 South America
- 5.5.2.1 Brazil
- 5.5.2.2 Argentina
- 5.5.2.3 Rest of South America
- 5.5.3 Europe
- 5.5.3.1 Germany
- 5.5.3.2 United Kingdom
- 5.5.3.3 France
- 5.5.3.4 Italy
- 5.5.3.5 Russia
- 5.5.3.6 Rest of Europe
- 5.5.4 APAC
- 5.5.4.1 China
- 5.5.4.2 Japan
- 5.5.4.3 India
- 5.5.4.4 South Korea
- 5.5.4.5 Rest of APAC
- 5.5.5 Middle East & Africa
- 5.5.5.1 United Arab Emirates
- 5.5.5.2 Saudi Arabia
- 5.5.5.3 South Africa
- 5.5.5.4 Rest of Middle East and Africa
- 5.5.1 North America
6 COMPETITIVE LANDSCAPE
- 6.1 Market Concentration
- 6.2 Strategic Moves
- 6.3 Market Share Analysis
- 6.4 Company Profiles
- 6.4.1 ABB Ltd.
- 6.4.2 FANUC Corp.
- 6.4.3 KUKA AG
- 6.4.4 Yaskawa Electric Corp.
- 6.4.5 BEUMER Group GmbH and Co. KG
- 6.4.6 Honeywell Intelligrated
- 6.4.7 Krones AG
- 6.4.8 Sidel Group
- 6.4.9 A-B-C Packaging
- 6.4.10 Schneider Packaging
- 6.4.11 Barry-Wehmiller (BW Packaging)
- 6.4.12 Premier Tech Chronos
- 6.4.13 MMCI Robotics
- 6.4.14 Columbia Machine
- 6.4.15 Fuji Yusoki
- 6.4.16 Brenton Engineering
- 6.4.17 Kawasaki Robotics
- 6.4.18 Okura Yusoki
- 6.4.19 Regal Rexnord Automation
- 6.4.20 Sealed Air AUTOBAG
7 MARKET OPPORTUNITIES AND FUTURE OUTLOOK
- 7.1 White-space and Unmet-need Assessment


