

|
시장보고서
상품코드
2122379
백금족 금속 : 시장 점유율 분석, 산업 동향·통계 데이터, 성장 예측(2026-2031년)Platinum Group Metals - Market Share Analysis, Industry Trends & Statistics, Growth Forecasts (2026 - 2031) |
||||||
 Mordor Intelligence
Mordor Intelligence에 따르면 백금족 금속 시장 규모는 2025년에 668.23톤으로 평가되며, 2026년 699.77톤에서 2031년까지 881.26톤에 달할 것으로 예측되고 있으며, 예측 기간(2026-2031년)에 CAGR은 4.72%에 달할 전망입니다.
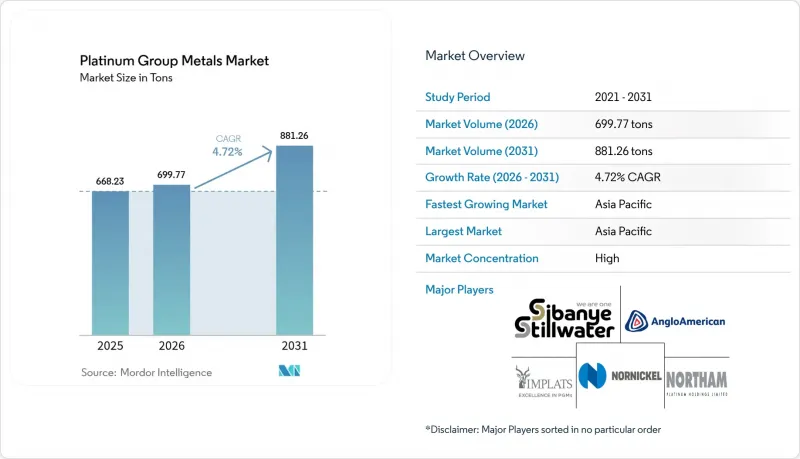
이 보고서는 금속 유형(백금, 팔라듐, 로듐 등), 용도(자동차용 촉매, 전기·전자기기 등), 공급원(1차(채굴), 재생/2차),최종 용도 산업(자동차, 산업용 화학제품 등) 및 지역(아시아태평양, 북미, 유럽, 남미, 중동 및 아프리카)별로 분류되어 있습니다. 시장 예측은 톤 단위로 제시되어 있습니다.
세계 백금족 금속 시장의 동향 및 인사이트
신흥 시장에서 내연기관(ICE) 차량용 자동차 촉매 수요 급증
인도에서는 2024년에 420만 대의 승용차가 생산되었으며, BS-VI 2단계 규제로 인해 엄격한 질소산화물 배출 상한선을 달성하기 위해 차량 1대당 백금족 금속 사용량이 60% 이상 증가했습니다. 태국, 인도네시아, 베트남에서는 2024년에 총 약 400만 대의 차량이 조립되었으며, 브라질의 플렉스 연료 차량에는 더 높은 연소 온도를 견디기 위해 로듐을 풍부하게 함유한 촉매가 추가되었습니다. 미국 수출을 목적으로 한 멕시코의 350만 대 생산은 Tier 3 Bin 70 규제의 적용을 받으며, 이로 인해 금속 함량의 초과 사양이 촉진되고 있습니다. 국제청정교통협의회(ICCT)는 2026-2031년까지 신흥 시장 전체에서 소형차 판매가 1,200만 대 증가할 것으로 전망하며, 가격에 민감한 부문에서는 여전히 내연 기관이 70% 이상의 점유율을 차지할 것으로 예측하고 있습니다.
수소 허브에서의 PEM형 전해조 구축
수소 관련 백금 수요는 2023년 4만 온스에서 2028년까지 47만 6,000온스에 달할 것으로 예상되며, 그 증가분의 대부분은 PEM 시스템에 기인합니다. 미국의 ‘인플레이션 억제법(Inflation Reduction Act)’은 2027년까지 1MW당 200-250g의 백금과 15-20g의 이리듐을 소비하는 지역 허브에 70억 달러를 배정하고 있습니다. 유럽의 ‘Fit for 55’ 패키지는 2030년까지 1,000만 톤의 재생 가능 수소를 목표로 하고 있지만, 대체 전해 기술이 보급되지 않는 한 이리듐 공급 부족으로 인해 PEM 용량은 약 45GW로 제한될 가능성이 있습니다.
PGM 가격의 지속적인 변동이 OEM 계약을 제약
로듐 가격은 2021년 온스당 2만 9,800달러에서 2024년에는 4,500달러로 85% 급락했으며, 고정 계약의 만료에 따라 1차 공급업체의 이익률은 최대 500베이시스포인트까지 압박받았습니다. 팔라듐의 연간 40%에 달하는 가격 변동으로 인해 일본 및 독일의 자동차 제조업체들은 헤지 기간을 6-9개월로 단축할 수밖에 없게 되었고, 재고 리스크가 정제업체로 전가되었습니다. 이리듐에는 장기적인 선물 커브가 존재하지 않기 때문에 가격 형성은 거래량이 적은 양자 간 거래에 의존하고 있으며, 이는 장기적인 생산 능력 투자를 저해하고 있습니다.
부문별 분석
이리듐은 2025년에는 고작 3-4t에 불과할 것으로 예상되지만, 연평균 성장률(CAGR) 8.92%를 기록하며 백금족 금속 시장 내에서 가장 빠르게 성장하고 있는 원소가 되었습니다. PEM형 전해조 제조업체들은 코팅 두께를 3µm에서 1µm으로 얇게 줄이고 있으며, 이로 인해 이리듐 사용량은 절반으로 줄어들겠지만, 2023년 기준치보다 여전히 더 많은 톤수가 필요할 것으로 보입니다. 중국내 배터리식 전기자동차 판매 대수가 증가하고, 미국 및 EU의 가솔린 차량 플랫폼에서 백금 대체가 가속화됨에 따라 팔라듐의 점유율(46.55%)은 축소되고 있습니다. 로듐의 가격 변동성이 심해짐에 따라 각 OEM 업체들은 5-8%의 변환 효율을 희생하더라도 비용 예측 가능성을 확보하기 위해 팔라듐과 로듐의 혼합 개발이 진행되고 있습니다. 루테늄이 5 nm 미만의 배선 재료로 채택됨에 따라 연간 수요는 10-12 t 증가하는 반면, 오스뮴은 500kg 미만의 틈새 시장에 머물러 있습니다. 이러한 변화들이 맞물리면서 백금족 금속 시장의 점유율은 더욱 다양화된 구성으로 재분배되고 있습니다.
연료전지 시장은 연평균 성장률(CAGR) 28.47%로 확대될 것으로 예상되며, 도요타, 현대, 그리고 중국의 트럭 제조사들이 PEM 구동 시스템 및 데이터센터 백업 시스템을 출시함에 따라 2031년까지 백금족 금속 시장 규모의 10%를 초과할 가능성이 있습니다. 보석류(주얼리)는 2025년에 28.75%의 점유율을 차지할 것으로 보이지만, 백금 가격이 온스당 1,000달러를 초과하면 중국과 인도의 소비자들이 금이나 합성 보석으로 눈을 돌릴 것으로 예상되어 성장세가 주춤할 것으로 전망됩니다. 자동차용 촉매는 여전히 수량 면에서 지배적이지만, 2026년까지 주요 시장에서 신차 판매의 4분의 1을 배터리식 전기자동차가 차지하게 됨에 따라 그 점유율은 하락할 전망입니다. 전자 분야에서는 루테늄 인터커넥트로 인해 수요가 점차 확대되는 한편, 의료용 및 화학용 촉매는 안정적인 기초 수요를 창출할 것입니다.
지역별 분석
아시아태평양은 백금족 금속 시장 출하량의 51.60%를 차지하고 있으며, 연평균 5.03%의 성장이 예상됩니다. 인도의 BS-VI 2단계 규제, 아세안(ASEAN)의 400만 대 규모 자동차 조립 거점, 그리고 한국의 반도체 생산 확대가 수요를 지원하고 있습니다. 북미에서는 수소 허브에 대한 70억 달러 규모의 인센티브 정책을 활용하여 1,050만 대의 소형차를 생산하고 있습니다. 이러한 차량들은 Tier 3 기준을 충족하기 위해 다량의 촉매가 필요합니다. 유럽의 ‘Fit for 55’ 계획과 연기된 유로 7 규제로 인해 수소 및 자동차용 촉매 수요는 증가하고 있지만, 재활용을 통해 이미 수요의 57%가 충당되고 있습니다. 남아프리카공화국은 전 세계 백금의 70% 이상을 공급하고 있지만, 전력, 물, 채굴 깊이의 제약으로 인해 2024년 생산량은 두 자릿수 감소가 예상되며, 짐바브웨에서의 45만 온스 증산분만으로는 그 손실을 완전히 메울 수 없습니다. 이러한 동향으로 인해 해당 지역의 수급 균형은 여전히 타이트한 상태가 지속되고 있으며, 백금족 금속 시장에서 재활용의 전략적 가치가 더욱 높아지고 있습니다.
기타 혜택:
- Excel 형식의 시장 예측(ME) 시트
- 3개월간의 애널리스트 지원
자주 묻는 질문
목차
제1장 서론
제2장 분석 방법
제3장 개요
제4장 시장 구도
제5장 시장 규모·성장률 예측
제6장 경쟁 구도
제7장 시장 기회와 향후 전망
KSA 26.09.07According to Mordor Intelligence, the platinum group metals market size was valued at 668.23 tons in 2025 and is estimated to grow from 699.77 tons in 2026 to reach 881.26 tons by 2031, at a CAGR of 4.72% during the forecast period (2026-2031).
This report is Segmented by Metal Type (Platinum, Palladium, Rhodium, and More), Application (Auto Catalysts, Electrical and Electronics, and More), Source (Primary (Mined), Recycled/Secondary), End-Use Industry (Automotive, Industrial Chemicals, and More), and Geography (Asia-Pacific, North America, Europe, South America, and Middle East and Africa). The Market Forecasts are Provided in Terms of Volume (tons).
Global Platinum Group Metals Market Trends and Insights
Surging Demand for Autocatalysts in Emerging-Market ICE Vehicles
India produced 4.2 million passenger vehicles in 2024, and BS-VI Phase 2 rules raised platinum group metal loadings more than 60% per unit to hit stringent nitrogen-oxide caps. Thailand, Indonesia, and Vietnam together assembled about 4 million vehicles in 2024, and flex-fuel cars in Brazil added rhodium-rich catalysts to withstand higher combustion temperatures. Mexico's 3.5 million-unit production for U.S. exports faces Tier 3 Bin 70 rules that prompt over-specification of metal content. The International Council on Clean Transportation foresees 12 million extra light-vehicle sales across emerging markets between 2026 and 2031, with internal-combustion engines still holding more than 70% share in price-sensitive segments.
PEM-Electrolyser Build-Out Across Hydrogen Hubs
Platinum demand for hydrogen climbed from 40 thousand ounces in 2023 to an expected 476 thousand ounces by 2028, with PEM systems contributing most of the rise. The US Inflation Reduction Act earmarked USD 7 billion for regional hubs that will consume 200-250 g of platinum and 15-20 g of iridium per MW by 2027. Europe's Fit for 55 package targets 10 million t of renewable hydrogen by 2030, but iridium scarcity could cap PEM capacity at roughly 45 GW unless alternative electrolysis technologies scale.
Persistent PGM Price Volatility Constraining OEM Contracts
Rhodium plunged 85% from USD 29,800 / oz in 2021 to USD 4,500 / oz in 2024, squeezing tier-one supplier margins by up to 500 bps as fixed contracts matured. Palladium's 40% intrayear swings forced Japanese and German automakers to shorten hedge horizons to six-nine months, shifting inventory risk to refiners. Iridium lacks a deep futures curve, so price discovery depends on thin bilateral trades, deterring long-run capacity investment.
Other drivers and restraints analyzed in the detailed report include:
- IC Substrate Plating Boom in Advanced Electronics
- Dual-Metal Upswing from Pd-for-Pt Catalyst Substitution
- Escalating Energy and Water Intensity of South African Mines
For complete list of drivers and restraints, kindly check the Table Of Contents.
Segment Analysis
Iridium's 8.92% CAGR positions it as the fastest-growing element inside the platinum group metals market, even though it accounted for only 3-4 t in 2025. PEM electrolyser makers are slicing coating thickness from 3 µm to 1 µm, which halves iridium intensity while still demanding more tonnage than the 2023 baseline. Palladium's 46.55% share is receding as battery-electric sales rise in China and substitution into platinum accelerates across US and EU gasoline platforms. Rhodium's volatility spurs OEMs to engineer palladium-rhodium blends that trade 5-8% conversion efficiency for cost predictability. Ruthenium's move into sub-5 nm interconnects lifts yearly demand by 10-12 t, while osmium stays a sub-500 kg niche. Combined, these shifts redistribute platinum group metals market share toward a more diversified mix.
Fuel cells are projected to climb at a 28.47% CAGR and could top 10% of the platinum group metals market size by 2031 as Toyota, Hyundai, and Chinese truck makers roll out PEM drivetrains and data-center backup systems. Jewelry, with a share of 28.75% in 2025, stagnates because Chinese and Indian consumers pivot to gold and synthetics when platinum breaches USD 1,000 / oz. Autocatalysts still dominate volume, but their share declines as battery-electric models take up a quarter of new-car sales in major markets by 2026. Electronics gain incremental lift from ruthenium interconnects, while medical and chemical catalysts provide a steady baseline demand.
Complete Report Scope:
- By Metal Type
- Platinum
- Palladium
- Rhodium
- Iridium
- Ruthenium
- Osmium
- By Application
- Auto Catalysts
- Electrical and Electronics
- Fuel Cells
- Glass, Ceramics and Pigments
- Jewellery
- Medical (Dental and Pharma)
- Chemical Industry
- Other (Aerospace, Sensors, Water, Forensics)
- By Source
- Primary (Mined)
- Recycled/Secondary
- By End-Use Industry
- Automotive
- Industrial Chemicals
- Renewable Energy and Hydrogen
- Electronics and Semiconductors
- Jewellery and Luxury Goods
- Healthcare Devices
- Glass Manufacturing
- Petroleum Refining
- Others
- By Geography
- Asia-Pacific
- China
- India
- Japan
- South Korea
- ASEAN
- Rest of Asia-Pacific
- North America
- United States
- Canada
- Mexico
- Europe
- Germany
- United Kingdom
- France
- Italy
- Spain
- Rest of Europe
- South America
- Brazil
- Argentina
- Rest of South America
- Middle-East and Africa
- Saudi Arabia
- South Africa
- Rest of Middle-East and Africa
- Asia-Pacific
Geography Analysis
Asia Pacific owns 51.60% of the platinum group metals market volume and is set to grow 5.03% annually. India's BS-VI Phase 2 standards, ASEAN's 4 million-vehicle assembly base, and South Korea's semiconductor expansions underpin demand. North America leverages USD 7 billion in hydrogen-hub incentives and produces 10.5 million light vehicles, which hold high catalyst loadings to satisfy Tier 3 standards. Europe's Fit for 55 plan and postponed Euro 7 rules raise both hydrogen and autocatalyst requirements, yet recycling already meets 57% of its needs. South Africa provides more than 70% of the world's platinum, but power, water, and depth constraints cut 2024 output by double digits, while Zimbabwe's incremental 450 k oz cannot fully offset losses. These dynamics keep regional supply-demand balances tight and reinforce the strategic value of recycling in the platinum group metals market.
- African Rainbow Minerals Limited
- Anglo American plc
- BASF SE
- DOWA Holdings Co., Ltd
- Glencore
- Heraeus Group
- Impala Platinum Holdings Ltd
- Ivanhoe Mines
- Jinchuan Group International Resources Co. Ltd
- Johnson Matthey
- Norilsk Nickel
- Northam Platinum Holdings Limited
- Platinum Group Metals Ltd
- Sibanye-Stillwater Limited
- TANAKA PRECIOUS METAL GROUP Co., Ltd.
- Umicore
- Vale
Additional Benefits:
- The market estimate (ME) sheet in Excel format
- 3 months of analyst support
TABLE OF CONTENTS
1 Introduction
- 1.1 Study Assumptions and Market Definition
- 1.2 Scope of the Study
2 Research Methodology
3 Executive Summary
4 Market Landscape
- 4.1 Market Overview
- 4.2 Market Drivers
- 4.2.1 Surging demand for autocatalysts in emerging-market ICE vehicles
- 4.2.2 PEM-electrolyser build-out across North America and EU hydrogen hubs
- 4.2.3 IC substrate plating boom in high-end electronics (Ruthenium focus)
- 4.2.4 Dual-metal upswing from Pd-for-Pt catalyst substitution
- 4.2.5 Platinum-based ammonia cracking solutions for maritime e-fuels
- 4.3 Market Restraints
- 4.3.1 Persistent PGM price volatility constraining OEM offtake contracts
- 4.3.2 Escalating energy and water intensity of deep-level South African mines
- 4.3.3 Closed-loop recycling growth reducing primary metal demand
- 4.4 Value Chain Analysis
- 4.5 Porter's Five Forces
- 4.5.1 Bargaining Power of Suppliers
- 4.5.2 Bargaining Power of Buyers
- 4.5.3 Threat of New Entrants
- 4.5.4 Threat of Substitutes
- 4.5.5 Degree of Competition
5 Market Size and Growth Forecasts (Volume)
- 5.1 By Metal Type
- 5.1.1 Platinum
- 5.1.2 Palladium
- 5.1.3 Rhodium
- 5.1.4 Iridium
- 5.1.5 Ruthenium
- 5.1.6 Osmium
- 5.2 By Application
- 5.2.1 Auto Catalysts
- 5.2.2 Electrical and Electronics
- 5.2.3 Fuel Cells
- 5.2.4 Glass, Ceramics and Pigments
- 5.2.5 Jewellery
- 5.2.6 Medical (Dental and Pharma)
- 5.2.7 Chemical Industry
- 5.2.8 Other (Aerospace, Sensors, Water, Forensics)
- 5.3 By Source
- 5.3.1 Primary (Mined)
- 5.3.2 Recycled/Secondary
- 5.4 By End-Use Industry
- 5.4.1 Automotive
- 5.4.2 Industrial Chemicals
- 5.4.3 Renewable Energy and Hydrogen
- 5.4.4 Electronics and Semiconductors
- 5.4.5 Jewellery and Luxury Goods
- 5.4.6 Healthcare Devices
- 5.4.7 Glass Manufacturing
- 5.4.8 Petroleum Refining
- 5.4.9 Others
- 5.5 By Geography
- 5.5.1 Asia-Pacific
- 5.5.1.1 China
- 5.5.1.2 India
- 5.5.1.3 Japan
- 5.5.1.4 South Korea
- 5.5.1.5 ASEAN
- 5.5.1.6 Rest of Asia-Pacific
- 5.5.2 North America
- 5.5.2.1 United States
- 5.5.2.2 Canada
- 5.5.2.3 Mexico
- 5.5.3 Europe
- 5.5.3.1 Germany
- 5.5.3.2 United Kingdom
- 5.5.3.3 France
- 5.5.3.4 Italy
- 5.5.3.5 Spain
- 5.5.3.6 Rest of Europe
- 5.5.4 South America
- 5.5.4.1 Brazil
- 5.5.4.2 Argentina
- 5.5.4.3 Rest of South America
- 5.5.5 Middle-East and Africa
- 5.5.5.1 Saudi Arabia
- 5.5.5.2 South Africa
- 5.5.5.3 Rest of Middle-East and Africa
- 5.5.1 Asia-Pacific
6 Competitive Landscape
- 6.1 Market Concentration
- 6.2 Strategic Moves
- 6.3 Market Share(%)/Ranking Analysis
- 6.4 Company Profiles (includes Global Overview, Market Overview, Core Segments, Financials, Strategic Information, Products and Services, Recent Developments)
- 6.4.1 African Rainbow Minerals Limited
- 6.4.2 Anglo American plc
- 6.4.3 BASF SE
- 6.4.4 DOWA Holdings Co., Ltd
- 6.4.5 Glencore
- 6.4.6 Heraeus Group
- 6.4.7 Impala Platinum Holdings Ltd
- 6.4.8 Ivanhoe Mines
- 6.4.9 Jinchuan Group International Resources Co. Ltd
- 6.4.10 Johnson Matthey
- 6.4.11 Norilsk Nickel
- 6.4.12 Northam Platinum Holdings Limited
- 6.4.13 Platinum Group Metals Ltd
- 6.4.14 Sibanye-Stillwater Limited
- 6.4.15 TANAKA PRECIOUS METAL GROUP Co., Ltd.
- 6.4.16 Umicore
- 6.4.17 Vale
7 Market Opportunities and Future Outlook
- 7.1 White-Space and Unmet-Need Assessment


