

|
시장보고서
상품코드
2122582
실험실 여과 : 시장 점유율 분석, 업계 동향과 통계, 성장 예측(2026-2031년)Laboratory Filtration - Market Share Analysis, Industry Trends & Statistics, Growth Forecasts (2026 - 2031) |
||||||
 Mordor Intelligence
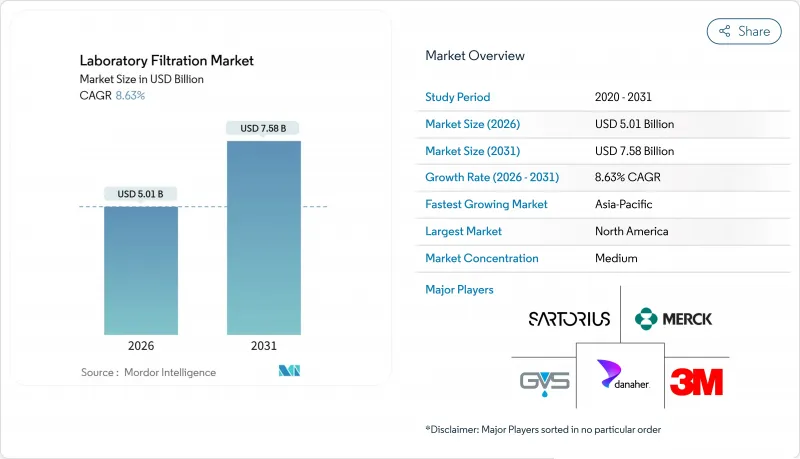
Mordor Intelligence에 의하면, 실험실 여과 시장 규모는 2026년에 50억 1,000만 달러로 추정되며, 예측 기간(2026-2031년)에 CAGR 8.63%로 확대되어 2031년에는 75억 8,000만 달러에 이를 전망입니다.
본 보고서는 제품 유형(여과재, 여과 어셈블리, 여과용 액세서리), 기술(미세 여과, 한외 여과 등), 최종 사용자(제약·바이오기술 기업 등), 지역(북미, 유럽, 아시아태평양, 중동 및 아프리카, 남미)별로 분류되어 있습니다. 시장 전망은 금액(달러) 기준으로 제시되어 있습니다.
전 세계 실험실 여과 시장 동향 및 인사이트
바이오의약품 연구개발비 증가
2025년 전 세계 제약 연구개발비는 2,440억 달러에 달하여 전년 대비 7.5% 증가했습니다. 이 지출 중 바이오의약품이 62%를 차지하고 있습니다. 현재, 임상시험용 의약품 신청 1건당 15-20회의 무균성 및 바이러스 제거 검증 시험이 실시되고 있으며, 이는 3-5배치 분량의 생산에 해당하는 막 면적에 해당합니다. 수탁 시험 기관에서는 안정성 시험의 시료 처리량이 28% 증가함에 따라, 조달 담당자들은 가격과 공급을 확보하기 위한 장기 여과재 계약 협상을 진행하고 있습니다. 규제 당국은 공정 검증에 관한 지침을 지속적으로 세분화하고 있으며, 이로 인해 후원사는 진화하는 무균성 기준을 충족하기 위해 시험을 반복적으로 실시하게 되어 결과적으로 막 소비가 지속되고 있습니다. 그 결과, 정기적인 수주 기반이 견고하게 형성되어 실험실 여과 시장은 거시경제의 변동을 잘 극복하고 있습니다.
세포 및 유전자 치료제 생산 확대
승인된 세포 및 유전자 치료 제품은 2025년 말까지 37건에 달하고, 180건의 프로그램이 2/3상 임상시험 단계로 진입함에 따라 바이러스 벡터 작업 전용 GMP 시설의 도입 대수가 두 배로 증가했습니다. 렌티바이러스 및 AAV 정제에는 탄젠셜 플로우 여과가 필수적이며, 50리터 바이오리액터 1회 가동당 약 12제곱미터의 중공사막이 소비됩니다. 살토리아스(Sartorius)사의 보고에 따르면, 2023년부터 2025년에 걸쳐 동사의 바이오프로세스 매출에서 세포 치료 관련 고객이 차지하는 비중이 11%에서 19%로 상승했으며, 이 분야가 수주 상황에 어떤 변화를 가져오고 있는지가 뚜렷이 드러나고 있습니다. 상업적 규모로 확대하기 위해서는 2028년까지 여과 용량을 10배로 증강해야 하며, CDMO 각사는 여러 공급업체를 사전 인증할 수밖에 없는 상황입니다. 다양한 혈청형에 걸친 바이러스 보유 데이터를 제공할 수 있는 벤더는 실험용 여과 시장에서 경쟁 우위를 더욱 공고히 하고 있습니다.
고품질 막용 폴리머 공급망의 변동성
폴리비닐리덴플루오라이드(PVDF) 및 폴리에테르설폰(PES) 수지는 아시아의 단 3개 제조업체에서만 공급되고 있기 때문에 공급에 차질이 생기면 완성 롤의 리드타임인 8-12주 동안 그 영향이 파급됩니다. 2025년 8월, 태풍으로 인해 대만의 PVDF 공장이 가동을 중단하면서 공급량이 18% 감소한 결과, 의약품 등급 PES의 현물 가격이 23% 상승했습니다. 대형 공급업체들은 수년에 걸친 장기 계약을 통해 리스크를 헤지하고 있지만, 중견 조립 제조업체들은 할당량 감축에 직면하여 이익률이 압박받고 있습니다. 규제 당국에 제출하는 신청 서류에는 특정 멤브레인 화학 성분이 명시되어 있어, 긴급 상황 시 대체품으로 전환하는 데 막대한 비용이 소요됩니다. 살토리아스가 2024년에 PES 컴파운더를 인수한 것과 같은 수직 통합을 통해 주요 기업들은 영향을 어느 정도 피하고 있지만, 공급 충격은 여전히 실험실 여과 시장에 구조적인 역풍으로 작용하고 있습니다.
부문 분석
2025년에는 여과 매체가 매출의 57.31%를 차지했으며, 바이오프로세스의 모든 단계에서 멤브레인 롤, 플리츠 카트리지, 캡슐 필터가 중심적인 역할을 하고 있음이 부각되었습니다. 0.22µm 디스크의 상품화로 인해 이익률은 압박을 받고 있지만, 공급업체들은 친수성 코팅이나 대전층과 같은 차별화 요소를 통해 20%의 프리미엄 가격을 실현하고 있습니다. 여과용 액세서리는 시장 규모는 작지만, 실험실에서의 액체 처리 자동화가 진행됨에 따라 2031년까지 연평균 성장률(CAGR) 10.92%로 확대될 것으로 예측됩니다. 스크리닝 로봇 1대로 하루에 1만 개의 주사기 필터를 처리할 수 있기 때문에 액세서리는 실험실 여과 시장에서 가장 빠르게 성장하는 부문이 되었습니다.
각 바이오의약품 배치마다 수 제곱미터의 막이 소비되기 때문에 막 시장은 여전히 1위를 유지하고 있지만, 현재는 액세서리가 이익 증가를 주도하고 있습니다. 정밀 필터를 피펫팅 데크와 세트로 판매함으로써 애프터마켓 수익을 확보하고, 타사 대체품의 사용을 억제하고 있습니다. 플러그 앤 플레이 방식의 캡슐 및 접선 유동 스키드를 포함한 ‘여과 어셈블리’는 이 두 극단 사이의 중간에 위치하며, 맞춤형 설계보다 신속한 기술 이전을 우선시하는 CDMO로부터 지지를 얻고 있습니다. 어셈블리 기반 연구소용 여과 시장 규모는 일회용 제품의 보급에 따라 확대될 전망이지만, 유닛의 교체 주기가 길기 때문에 그 성장률은 액세서리의 급속한 성장에는 미치지 못할 것으로 보입니다.
지역별 분석
북미는 2025년에 매출의 36.24%를 차지할 것으로 보이며, 1,200개가 넘는 GMP 스위트와 세계에서 가장 밀집된 세포 치료 개발 기업 집적지가 이를 뒷받침하고 있습니다. 미국의 CDMO는 차세대 막을 조기에 시험 도입하고 있어, 공급업체들은 현지 고객에게 파일럿 로트를 공급하고 있으며, 이로 인해 이 지역은 얼리 어답터로서의 입지를 강화하고 있습니다. 캐나다의 백신 이니셔티브에서는 일회용 파일럿 대응 플랜트에 대한 보조금이 투입되고 있어, 이에 따라 액세서리에 대한 수요가 확대되고 있습니다.
아시아태평양은 성장의 원동력이 되고 있으며, 2031년까지의 연평균 성장률(CAGR)은 11.63%로 예측됩니다. 중국은 2024년에 47곳의 바이오시밀러 제조 시설에 대한 허가를 부여했으며, 인도는 2025년에 29곳의 생물학적 제제 시설을 승인했습니다. 이들 시설은 미국 FDA의 수출 기준을 충족하기 위해 일회용 라인을 표준화하고 있습니다. 삼성바이오로직스와 우시바이오로직스는 48시간 이내에 납품할 수 있는 파트너를 선정하여 40만 리터 이상의 생산 능력을 증강했습니다. 일본에서는 세척 및 검증에 따른 가동 중단 시간을 줄이기 위해 스테인리스 스틸 생산 라인에 하이브리드형 일회용 모듈을 추가 장착하고 있으며, 이로 인해 캡슐 필터 수요가 증가하고 있습니다.
유럽에서는 연속 제조에 관한 EMA의 지침에 힘입어 시장이 꾸준히 확대되고 있으며, 이에 따라 인라인 여과에 대한 수요가 증가하고 있습니다. 독일과 스위스는 자가 유래 CAR-T 플랫폼으로 중심을 옮기고 있으며, 환자 1명당 전용 필터가 필요하기 때문에 로트당 비용이 최대 50% 증가하고 있습니다. 영국에서는 브렉시트 이후 EU 기준에 부합함으로써 공급업체의 규정 준수 부담이 경감되고 있습니다. 중동 및 아프리카은 현재 규모는 작지만, 걸프 국가들은 2025년까지 현지 바이오의약품 산업에 10억 달러를 투자하겠다고 약속했으며, 지역 내 제조 거점이 구축될 때까지는 여과 어셈블리를 수입하고 있습니다. 남미의 브라질과 아르헨티나는 백신 자급자족을 추진하고 있으며, 피오크루즈(Fiocruz)는 2025년에 접선류식 일회용 필터를 갖춘 5만 리터 규모의 복합 시설을 개소했습니다. 모든 지역에서 신규 건설 시설은 단숨에 일회용 방식으로 전환되고 있으며, 실험실 여과 시장에서 고품질 캡슐 및 어셈블리의 채택이 가속화되고 있습니다.
기타 혜택:
- 엑셀 형식 시장 예측(ME) 시트
- 3개월간의 애널리스트 지원
자주 묻는 질문
목차
제1장 서론
제2장 조사 방법
제3장 주요 요약
제4장 시장 구도
제5장 시장 규모와 성장 예측
제6장 경쟁 구도
제7장 시장 기회와 향후 전망
LSH 26.09.03According to Mordor Intelligence, the laboratory filtration market size is estimated at USD 5.01 billion in 2026, and is expected to reach USD 7.58 billion by 2031, at a CAGR of 8.63% during the forecast period (2026-2031).
This report is Segmented by Product Type (Filtration Media, Filtration Assemblies, Filtration Accessories), Technique (Microfiltration, Ultrafiltration, and More), End User (Pharmaceutical & Biotechnology Companies, and More), and Geography (North America, Europe, Asia-Pacific, Middle East & Africa, South America). The Market Forecasts are Provided in Terms of Value (USD).
Global Laboratory Filtration Market Trends and Insights
Accelerating Biopharma R&D Spend
Global pharmaceutical R&D reached USD 244 billion in 2025, a 7.5% increase year-over-year, with biologics accounting for 62% of this expenditure. Each investigational new drug submission now triggers 15-20 sterility and viral clearance validation runs, which translates into a membrane area equivalent to three to five production batches. Contract laboratories experienced a 28% increase in sample throughput for stability testing, prompting procurement managers to negotiate long-term filtration-media agreements that secure price and availability. Regulators continue to refine guidance on process validation, prompting sponsors to repeat studies to meet evolving sterility benchmarks, thereby sustaining membrane consumption. The upshot is a durable baseline of recurring orders that helps the laboratory filtration market weather macroeconomic swings.
Expansion of Cell & Gene Therapy Manufacturing
Approved cell- and gene-therapy products climbed to 37 by end-2025, and 180 programs advanced to Phase II/III, doubling the installed base of GMP suites dedicated to viral-vector work. Lentiviral and AAV purification depend on tangential-flow filtration, with each 50-L bioreactor run consuming around 12 m2 of hollow-fiber membrane. Sartorius reported that cell-therapy customers rose from 11% to 19% of its bioprocess revenue between 2023 and 2025, underlining how the segment reshapes order books. Commercial-scale expansion will require a tenfold increase in filtration capacity by 2028, compelling CDMOs to pre-qualify multiple suppliers. Vendors able to furnish viral-retention data across diverse serotypes enjoy a widening moat in the laboratory filtration market.
Supply-Chain Volatility for High-Grade Membrane Polymers
Polyvinylidene fluoride and polyethersulfone resins originate from just three Asian producers, so any disruption cascades through lead times of 8 to 12 weeks for finished rolls. A typhoon shut down a Taiwan PVDF plant in August 2025, reducing availability by 18% and driving up spot prices for pharmaceutical-grade PES by 23%. Large vendors hedge with multi-year offtake contracts, but mid-tier assemblers endure allocation cuts that erode margins. Regulatory dossiers name specific membrane chemistries, making emergency substitutions costly. Vertical integration, such as Sartorius' 2024 acquisition of a PES compounder, partially insulates top players; however, supply shocks remain a structural headwind for the laboratory filtration market.
Other drivers and restraints analyzed in the detailed report include:
- Rapid Adoption of Single-Use Filtration Assemblies
- Miniaturized High-Throughput Screening Driving Microfiltration Demand
- Waste-Disposal Compliance Costs for Single-Use Plastics
For complete list of drivers and restraints, kindly check the Table Of Contents.
Segment Analysis
Filtration Media captured 57.31% of revenue in 2025, underscoring the centrality of membrane rolls, pleated cartridges, and capsule filters to every stage of bioprocessing. Commoditization of 0.22-µm discs compresses margins, so suppliers differentiate through hydrophilic coatings and charged layers that command 20% premiums. Filtration Accessories, though smaller in value, are forecast to expand at a 10.92% CAGR to 2031 as laboratories automate liquid handling. A single screening robot can process 10,000 syringe filters per day, making accessories the fastest-growing segment of the laboratory filtration market.
Media stays on top because each biologics batch consumes square meters of membrane, but accessories now drive incremental profit. Bundling precision filters with pipetting decks locks in aftermarket revenue and discourages third-party alternatives. Filtration Assemblies, which include plug-and-play capsules and tangential-flow skids, sit between the two extremes, winning favor at CDMOs that prioritize rapid tech transfer over bespoke engineering. The laboratory filtration market size for assemblies is poised to increase in line with the uptake of single-use products; however, its growth rate lags behind the accessory boom due to longer unit replacement cycles.
Complete Report Scope:
- By Product Type
- Filtration Media
- Filtration Assemblies
- Filtration Accessories
- By Technique
- Microfiltration
- Ultrafiltration
- Nanofiltration & Reverse Osmosis
- Vacuum / Depth Filtration
- Others
- By End User
- Pharmaceutical & Biotechnology Companies
- Academic & Research Institutes
- Food & Beverage Testing Laboratories
- Environmental Testing Laboratories
- Others
- By Geography
- North America
- United States
- Canada
- Mexico
- Europe
- Germany
- United Kingdom
- France
- Italy
- Spain
- Rest of Europe
- Asia-Pacific
- China
- Japan
- India
- Australia
- South Korea
- Rest of Asia-Pacific
- Middle East & Africa
- GCC
- South Africa
- Rest of Middle East & Africa
- South America
- Brazil
- Argentina
- Rest of South America
- North America
Geography Analysis
North America held 36.24% revenue in 2025, backed by more than 1,200 GMP suites and the world's densest cluster of cell-therapy developers. U.S. CDMOs trial next-generation membranes first, so suppliers channel pilot lots to local customers, reinforcing the region's status as an early adopter. Canada's vaccine initiative funnels grants into single-use, ready-to-pilot plants, expanding the pull of accessories.
The Asia-Pacific region is the growth engine, with an 11.63% CAGR projected through 2031. China licensed 47 biosimilar plants in 2024, and India approved 29 biologics facilities in 2025 that standardized on disposable trains to satisfy U.S. FDA export norms. Samsung Biologics and WuXi Biologics added over 400,000 L of capacity, selecting partners who can deliver within 48 hours. Japan retrofits stainless steel lines with hybrid single-use modules to reduce cleaning and validation downtime, spurring demand for capsule filters.
Europe expands steadily, driven by EMA guidance on continuous manufacturing, which heightens the need for inline filtration. Germany and Switzerland are pivoting to autologous CAR-T platforms, so each patient lot requires dedicated filters, which lifts per-lot spend by up to 50%. The United Kingdom's post-Brexit convergence with EU standards eases supplier compliance. The Middle East & Africa are smaller today, yet Gulf states pledged USD 1 billion in 2025 for local biopharma, importing filtration assemblies until regional conversion plants emerge. South America's Brazil and Argentina push vaccine self-reliance; Fiocruz opened a 50,000-L complex in 2025 fitted with tangential-flow disposables. Across all regions, greenfield facilities leapfrog to single-use, accelerating the adoption of premium capsules and assemblies in the laboratory filtration market.
- 3M
- Agilent Technologies
- Avantor Inc. (VWR)
- Clarcor Industrial Air
- Cobetter Filtration Group
- Cole-Parmer (Antylia Scientific)
- Corning
- Danaher Corp. (Cytiva & Pall)
- Donaldson Company Inc.
- Eaton
- GVS
- Membrane Solutions LLC
- Merck KGaA (MilliporeSigma)
- Parker Hannifin
- Porvair plc
- Repligen
- Sartorius
- Sterlitech
- Thermo Fisher Scientific
Additional Benefits:
- The market estimate (ME) sheet in Excel format
- 3 months of analyst support
TABLE OF CONTENTS
1 Introduction
- 1.1 Study Assumptions & Market Definition
- 1.2 Scope of the Study
2 Research Methodology
3 Executive Summary
4 Market Landscape
- 4.1 Market Overview
- 4.2 Market Drivers
- 4.2.1 Accelerating Biopharma R&D Spend
- 4.2.2 Expansion of Cell & Gene Therapy Manufacturing
- 4.2.3 Rapid Adoption of Single-Use Filtration Assemblies
- 4.2.4 Miniaturized High-Throughput Screening Driving Microfiltration Demand
- 4.2.5 Growth of CROs & CDMOs Boosting Cost-Effective Filtration Assemblies
- 4.2.6 Technological Advancements in Laboratory Filtration
- 4.3 Market Restraints
- 4.3.1 Supply-Chain Volatility for High-Grade Membrane Polymers
- 4.3.2 Waste-Disposal Compliance Costs for Single-Use Plastics
- 4.3.3 Price Pressure from Commoditization of Syringe Filters
- 4.3.4 Emerging PFAS Regulations Limiting PTFE Filter Use
- 4.4 Value / Supply-Chain Analysis
- 4.5 Regulatory Landscape
- 4.6 Technological Outlook
- 4.7 Porter's Five Forces Analysis
- 4.7.1 Threat of New Entrants
- 4.7.2 Bargaining Power of Buyers
- 4.7.3 Bargaining Power of Suppliers
- 4.7.4 Threat of Substitutes
- 4.7.5 Competitive Rivalry
5 Market Size & Growth Forecasts
- 5.1 By Product Type
- 5.1.1 Filtration Media
- 5.1.2 Filtration Assemblies
- 5.1.3 Filtration Accessories
- 5.2 By Technique
- 5.2.1 Microfiltration
- 5.2.2 Ultrafiltration
- 5.2.3 Nanofiltration & Reverse Osmosis
- 5.2.4 Vacuum / Depth Filtration
- 5.2.5 Others
- 5.3 By End User
- 5.3.1 Pharmaceutical & Biotechnology Companies
- 5.3.2 Academic & Research Institutes
- 5.3.3 Food & Beverage Testing Laboratories
- 5.3.4 Environmental Testing Laboratories
- 5.3.5 Others
- 5.4 By Geography
- 5.4.1 North America
- 5.4.1.1 United States
- 5.4.1.2 Canada
- 5.4.1.3 Mexico
- 5.4.2 Europe
- 5.4.2.1 Germany
- 5.4.2.2 United Kingdom
- 5.4.2.3 France
- 5.4.2.4 Italy
- 5.4.2.5 Spain
- 5.4.2.6 Rest of Europe
- 5.4.3 Asia-Pacific
- 5.4.3.1 China
- 5.4.3.2 Japan
- 5.4.3.3 India
- 5.4.3.4 Australia
- 5.4.3.5 South Korea
- 5.4.3.6 Rest of Asia-Pacific
- 5.4.4 Middle East & Africa
- 5.4.4.1 GCC
- 5.4.4.2 South Africa
- 5.4.4.3 Rest of Middle East & Africa
- 5.4.5 South America
- 5.4.5.1 Brazil
- 5.4.5.2 Argentina
- 5.4.5.3 Rest of South America
- 5.4.1 North America
6 Competitive Landscape
- 6.1 Market Concentration
- 6.2 Market Share Analysis
- 6.3 Company Profiles (includes Global level Overview, Market-level Overview, Core Segments, Financials, Strategic Information, Market Rank/Share, Products & Services, Recent Developments)
- 6.3.1 3M
- 6.3.2 Agilent Technologies Inc.
- 6.3.3 Avantor Inc. (VWR)
- 6.3.4 Clarcor Industrial Air
- 6.3.5 Cobetter Filtration Group
- 6.3.6 Cole-Parmer (Antylia Scientific)
- 6.3.7 Corning Inc.
- 6.3.8 Danaher Corp. (Cytiva & Pall)
- 6.3.9 Donaldson Company Inc.
- 6.3.10 Eaton Corporation
- 6.3.11 GVS S.p.A
- 6.3.12 Membrane Solutions LLC
- 6.3.13 Merck KGaA (MilliporeSigma)
- 6.3.14 Parker Hannifin Corp.
- 6.3.15 Porvair plc
- 6.3.16 Repligen Corporation
- 6.3.17 Sartorius AG
- 6.3.18 Sterlitech Corporation
- 6.3.19 Thermo Fisher Scientific Inc.
7 Market Opportunities & Future Outlook
- 7.1 White-space & Unmet-need Assessment


