

|
시장보고서
상품코드
2122630
유선통신 : 시장 점유율 분석, 업계 동향과 통계, 성장 예측(2026-2031년)Fixed-Line Communications - Market Share Analysis, Industry Trends & Statistics, Growth Forecasts (2026 - 2031) |
||||||
 Mordor Intelligence
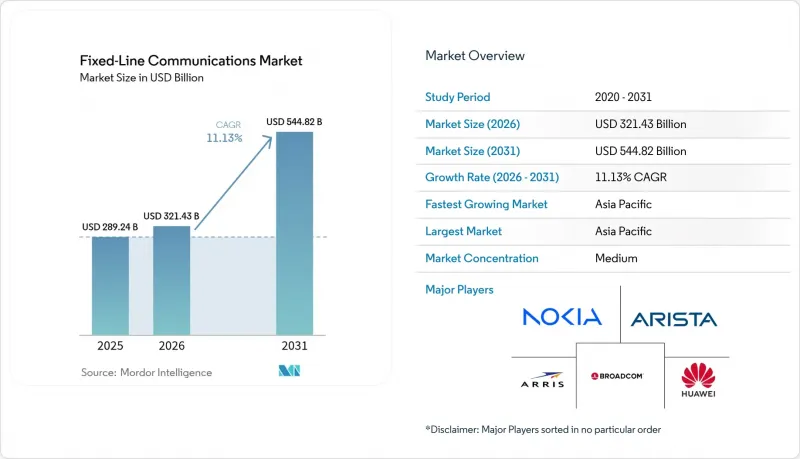
Mordor Intelligence에 의하면, 2026년 유선통신 시장 규모는 3,214억 3,000만 달러로 추정되며, 2025년 2,892억 4,000만 달러에서 2031년에는 5,448억 2,000만 달러에 달할 것으로 예측됩니다.
또한 2026-2031년 연평균 성장률(CAGR)은 11.13%를 나타낼 전망입니다.
본 보고서는 제품 유형(전송 장비, 교환 장비 등), 서비스 유형(고정 음성, 고정 광대역 데이터 등), 기술(디지털 가입자 회선, 동축(DOCSIS) 등), 최종 사용자(가정, 중소기업, 대기업 등) 및 지역별로 분류되어 있습니다.
전 세계 유선 통신 시장 동향 및 인사이트
도시 지역에서 기가비트급 광대역에 대한 수요 증가
주요 하이라이트
- 재택근무, 멀티 스트림 4K 동영상, 클라우드 게임의 보급으로 인해 주요 도시에서는 멀티 기가비트 서비스가 표준적인 기대치가 되었습니다. 통신 사업자는 더 이상 용량 비용을 억제하던 오버구독 규칙에 의존할 수 없게 되었으며, 대신 높은 처리량의 통신 경로를 보장하기 위해 대칭형 광섬유를 공동 주택의 더 깊은 곳까지 설치하고 있습니다. 복합 용도 빌딩의 기업 임차인들은 클라우드 백업 및 화상 협업을 위한 업링크 속도 보장도 요구하고 있으며, 이에 따라 통신 사업자는 사용자 1인당 평균 수익(ARPU)을 높인 프리미엄 SLA를 번들로 제공할 수 있게 되었습니다. 인구 밀도가 높은 지역에서는 광섬유 설치에 대한 투자 회수 기간이 단축되므로, 5G 고정 무선 기반의 대체 서비스가 보급되기 전에 시장 점유율을 확보하기 위한 적극적인 프로모션 가격 책정이 촉진되고 있습니다. 지자체들의 디지털 형평성 정책은 저소득 가구의 접속 비용을 보조함으로써 도입을 더욱 뒷받침하고 있으며, 광섬유가 정비되면 간접적으로 프리미엄 요금제 가입률 향상으로도 이어집니다.
기존 통신 사업자 및 신생 통신 사업자에 의한 대규모 FTTH 구축
기존 통신 사업자들은 구리선 회선의 단계적 업그레이드에서 본격적인 광섬유로의 교체로 전환하고 있습니다. 이는 AT&T가 2026년까지 3,000만 가구에 FTTH를 구축하겠다고 공약한 점에서도 확인할 수 있습니다. 인프라 펀드의 지원을 받는 신흥 통신 사업자(altnets)는 서비스가 미흡한 교외 지역을 잇달아 확보하고 있어, 고객 기반을 지키려는 기존 사업자들에게 더 신속한 대응을 촉구하고 있습니다. 미국의 BEAD(Base of Economic Activity Development)와 같은 보조금 제도는 수십억을 지방 인프라 구축에 투입하고 있어, 비용 면에서의 우위를 ‘딥 파이버’ 쪽으로 더욱 기울이고 있습니다. 신속한 구축 기술(마이크로 트렌칭, 커넥터식 드롭)과 덕트 재사용을 결합함으로써 가구당 설비 투자(CAPEX)가 절감되어, 중밀도 지역이라 하더라도 내부수익률(IRR)을 매력적인 수준으로 유지할 수 있습니다. 장기적으로는 유비쿼터스 광섬유 플랫폼을 구축함으로써 통신 사업자는 엣지 컴퓨팅 호스팅 및 프라이빗 5G 서비스의 업셀링이 가능해집니다.
라스트 마일 광섬유에 대한 높은 설비 투자와 긴 ROI 주기
농촌 지역의 건물 한 채에 광섬유를 끌어오는 데만 1,000달러 이상의 비용이 드는 경우가 있으며, 바위 지대나 산악 지대에서는 이 금액이 급격히 치솟습니다. 규모의 경제 효과를 누릴 수 없는 소규모 통신 사업자는 훨씬 더 높은 자금 조달 비용을 부담하게 되며, 그 부채 계약으로 인해 구축 일정이 지연되는 경우도 흔합니다. 작업자가 전신주에 광섬유를 설치해야 하는 경우, 설치 준비 작업이나 설치 요금을 둘러싼 법적 분쟁으로 인해 수개월의 지연이 발생합니다. 인증된 광섬유 연결 기술자의 임금 상승이 문제를 더욱 심각하게 만들고 있으며, 일부 시장에서는 이전에는 모바일 네트워크 엔지니어에게만 지급되던 입사 보너스가 제시되는 경우도 있습니다. 정부 보조금으로 건설 비용의 일부는 충당되지만, 인증된 공급업체나 기술에 대한 제한으로 인해 프로젝트의 총비용이 상승하여, 투자 회수 기간이 일반 투자자의 투자 기간을 초과하여 길어질 가능성이 있습니다.
부문별 분석
2025년에는 광섬유 케이블이 매출의 28.02%를 차지하며, 유선통신 시장에서 트래픽의 주력으로서의 입지를 확고히 했습니다. 800G 코히런트 전송에 대한 수요가 증가함에 따라 통신 사업자들은 실외 설비의 업그레이드를 가속화할 수밖에 없게 되었으며, 관련 광회선 단말기 및 패시브 스플리터가 액세스 장비에 대한 지출을 연평균 성장률(CAGR) 13.45%로 끌어올리고 있습니다. 통신 사업자들이 기존의 100G 광 모듈을 비트당 전력 소비를 절반으로 줄이고 네트워크 전체의 효율을 향상시키는 플러그인 가능한 모듈로 교체함에 따라, 전송 장비 공급업체들은 그 혜택을 누리고 있습니다. 또한, 소프트웨어 정의 제어 플레인에는 중앙국 내의 고성능 리프-스파인 패브릭이 필요하기 때문에 이에 따라 스위칭 장비 매출도 확대되고 있습니다.
가정에서 Wi-Fi 7 라우터와 메쉬 노드가 보급됨에 따라, 고객 구내 장비(CPE)는 계속해서 멀티 기가비트 열풍을 타고 있습니다. 각 벤더는 현재 통신 사업자가 가정 내 성능을 원격으로 문제 해결할 수 있는 관리형 Wi-Fi 분석 기능을 번들로 제공하고 있으며, 이를 통해 현장 방문 횟수를 줄이고 있습니다. 한편, 고정 무선 CPE의 출하 대수는 2024년에 DOCSIS 모뎀을 넘어섰으며, 광섬유를 통한 유선통신 시장 규모가 여전히 지배적임에도 불구하고 특정 도입 시나리오에서는 무선으로 대체가 가능함을 보여주고 있습니다.
2025년 총 수익 중 고정 광대역 데이터 서비스가 68.45%를 차지하며, 통화 시간 기반 과금에서 대역폭 수익화로의 돌이킬 수 없는 전환이 확인되었습니다. IPTV 및 기타 부가가치 플랫폼은 12.05%의 연평균 성장률(CAGR)로 그 뒤를 이었으며, 이는 통신 사업자들이 이미 광섬유에 투자한 자금을 지속적인 컨텐츠 수익 및 클라우드 게임 수익으로 전환하고 있는 실태를 반영합니다. 기업이 클라우드 PBX 서비스로 전환하고 일반 가정이 휴대폰에만 의존하게 됨에 따라, 기존의 유선 음성 서비스는 장기적인 감소 추세를 이어가고 있습니다.
연결성, 사이버 보안, 엣지 컴퓨팅 오케스트레이션을 통합한 매니지드 서비스 번들은 특히 사내 IT 팀을 보유하지 않은 중견 기업들 사이에서 지지를 얻고 있습니다. 네트워크상의 AI 엔진으로 강화된 동영상 분석 기능은 매우 정밀한 타겟팅 광고를 가능하게 하여, 추가 자본 지출(CAPEX) 없이도 이익률 향상을 가져오고 있습니다.
지역별 분석
아시아태평양은 2025년 매출의 38.45%를 차지하고 연평균 성장률(CAGR) 11.18%로 확대될 것으로 예상되어, 유선 통신 시장 최대 기업으로서의 입지를 공고히 하고 있습니다. 중국의 ‘10G 도시 네트워크’ 정책이 전국적인 광섬유 구축을 추진하는 한편, 인도의 ‘디지털 바라트(Digital Bharat)’ 프로그램은 민관 공동 사업을 촉진하여 연간 50만 루트 킬로미터 이상의 광섬유를 새로 부설하고 있습니다. 일본 및 한국의 통신 사업자들은 몰입형 미디어와 산업 자동화에 대응하기 위해 25G 및 50G PON으로의 업그레이드를 추진하고 있습니다.
북미에서는 BEAD 프로그램을 활용하여 지방 지역의 격차 해소를 도모하고 있습니다. Tier 1 통신사는 도시 지역의 구축을 가속화하고, 위성 광대역 사업자와의 경쟁을 펼치면서 장기적인 가입자 확보를 목표로 하고 있습니다. 버라이즌의 고정 무선 가입자 수 증가는 대체 위험을 부각시키고 있지만, 전신주 설치 규제 개혁으로 인해 허가 취득까지의 대기 시간이 단축됨에 따라 광섬유 설치 건수는 분기 기준으로 사상 최고치를 기록했습니다. 캐나다의 오픈 액세스 규제에 따라 기존 사업자는 광섬유 루프의 도매를 의무화하고 있으며, 이를 통해 소매 경쟁이 촉진되어 네트워크 소유자의 수익성을 해치지 않으면서도 도입률 향상으로 이어지고 있습니다.
유럽의 ‘기가비트 인프라법’은 굴착 허가 절차를 간소화하고 ‘한 번의 굴착’을 통한 조정을 의무화함으로써 토목 공사비를 두 자릿수 비율로 절감하고 있습니다. 프랑스와 스페인에서는 현재 FTTH 보급률이 75%를 넘어서고 있으며, 과거에는 어디에나 있었던 기가비트 서비스를 이용할 수 있게 되면 수요의 탄력성이 입증될 것임이 밝혀졌습니다. 독일에서는 사모펀드가 자금을 지원하는 알터넷(대체 통신 사업자)을 배경으로, 지연되었던 전개가 가속화되고 있습니다. 한편, 영국의 ‘프로젝트 기가비트’ 경매를 통해 접근이 어려운 마을로의 서비스 제공 범위가 확대되고 있습니다.
기타 혜택:
- 엑셀 형식 시장 예측(ME) 시트
- 3개월간의 애널리스트 지원
자주 묻는 질문
목차
제1장 서론
제2장 조사 방법
제3장 주요 요약
제4장 시장 구도
제5장 시장 규모와 성장 예측
제6장 경쟁 구도
제7장 시장 기회와 향후 전망
LSH 26.09.03According to Mordor Intelligence, fixed-line communications market size in 2026 is estimated at USD 321.43 billion, growing from 2025 value of USD 289.24 billion with 2031 projections showing USD 544.82 billion, growing at 11.13% CAGR over 2026-2031.
This report is Segmented by Product Type (Transmission Equipment, Switching Equipment, and More), Service Type (Fixed Voice, Fixed Broadband Data, and More), Technology (Digital Subscriber Line, Coaxial (Docsis), and More), End User (Residential, Small and Medium Enterprises, Large Enterprises, and More), and Geography.
Global Fixed-Line Communications Market Trends and Insights
Rising demand for gigabit-speed broadband in urban clusters
Key Highlights
- Remote work, multi-stream 4K video, and cloud gaming have made multi-gigabit service a baseline expectation in major cities. Operators can no longer rely on oversubscription rules that once kept capacity costs in check; instead, they push symmetric fiber deeper into apartment blocks to guarantee high-throughput paths. Enterprise tenants in mixed-use buildings additionally request guaranteed uplink speeds for cloud backup and video collaboration, allowing carriers to bundle premium SLAs at higher average revenue per user. Dense geography shortens fiber build paybacks, encouraging aggressive promotional pricing that locks in market share before 5G fixed-wireless alternatives gain traction. Municipal digital-equity policies further amplify adoption by underwriting low-income household connections, indirectly boosting take rates for premium tiers once the fiber is in place.
Massive fiber-to-the-home roll-outs by incumbents and altnets
Incumbent telcos have shifted from incremental copper upgrades to full-scale fiber replacement, as seen in AT&T's pledge to pass 30 million premises with FTTH by 2026. Challenger altnets, backed by infrastructure funds, pick off pockets of under-served suburbs, forcing faster reactions from legacy operators eager to defend their base. Subsidy frameworks such as BEAD in the United States redirect billions toward rural builds, further tilting the cost equation in favor of deep fiber. The combination of faster deployment techniques (micro-trenching, connectorized drops) and duct re-use lowers capex per home, keeping internal rates of return attractive even in mid-density territories. Longer term, establishing a ubiquitous fiber platform positions carriers to upsell edge-compute hosting and private 5G services.
High capex and long ROI cycles for last-mile fiber
Passing a single rural premise can cost more than USD 1,000, a figure that climbs sharply in rocky or mountainous terrain. Smaller carriers without scale economics shoulder significantly higher financing costs, and their debt covenants often dictate slower roll-out schedules. Where crews must attach fiber to utility poles, make-ready work and legal disputes over attachment fees add months of delay. Wage inflation for certified fiber splicers compounds the problem, with some markets offering signing bonuses that previously only mobile-network engineers received. Although government grants defray part of the build expense, restrictions on permissible vendors or technology can push total project cost back up, stretching payback periods beyond typical investor horizons.
Other drivers and restraints analyzed in the detailed report include:
- Cloud/hyperscale data-center back-haul requirements
- Government universal-service and subsidy programs (BEAD, RDOF, EU CEF-2)
- Substitution risk from 5G fixed-wireless and satellite broadband
For complete list of drivers and restraints, kindly check the Table Of Contents.
Segment Analysis
Fiber-optic cables generated 28.02% of revenue in 2025, cementing their position as the volume backbone of the fixed-line communications market. Intensifying demand for 800 G coherent transmission pushes operators to accelerate outside-plant upgrades, while associated optical line terminals and passive splitters lift access-equipment spend at a 13.45% CAGR. Transmission-equipment vendors benefit as carriers swap legacy 100 G optics for pluggables that halve power per bit, enhancing total network efficiency. Switching gear revenue expands in tandem because software-defined control planes require high-performance leaf-spine fabrics inside central offices.
Customer-premises equipment continues to ride the multi-gigabit wave as households adopt Wi-Fi 7 routers and mesh nodes. Vendors now bundle managed Wi-Fi analytics that let carriers troubleshoot in-home performance remotely, reducing truck rolls. Meanwhile, fixed-wireless CPE shipments overtook DOCSIS modems in 2024, showing that wireless substitution can capture specific deployment scenarios even as the fixed-line communications market size for fiber remains dominant.
Fixed broadband data services accounted for 68.45% of total 2025 revenue, confirming the irreversible pivot from minutes-based billing to bandwidth monetization. IPTV and other value-added platforms follow with a 12.05% CAGR, reflecting how carriers translate sunk fiber investments into recurring content and cloud-gaming revenue. Traditional fixed voice continues its secular slide as enterprises migrate to cloud PBX offerings and households rely exclusively on mobile.
Managed service bundles that merge connectivity with cybersecurity and edge-compute orchestration gain favor, especially among mid-sized enterprises lacking in-house IT teams. Enhanced video analytics powered by on-network AI engines enable ultra-targeted advertising, adding incremental margins without additional capex.
Complete Report Scope:
- By Product Type
- Transmission Equipment
- Switching Equipment
- Access Equipment (DSLAM, OLT, etc.)
- Customer-Premises Equipment (Routers, STB, ONT)
- Fiber-optic Cables
- Others
- By Service Type
- Fixed Voice
- Fixed Broadband Data
- IPTV / Value-added Services
- By Technology
- Digital Subscriber Line
- Coaxial (Docsis)
- Fiber (FTTx/FTTH)
- Hybrid Fiber-Coax
- By End User
- Residential
- Small and Medium Enterprises
- Large Enterprises
- Government and Public Sector
- Data Centers
- By Geography
- North America
- United States
- Canada
- Mexico
- South America
- Brazil
- Argentina
- Rest of South America
- Europe
- Germany
- United Kingdom
- France
- Russia
- Rest of Europe
- Asia Pacific
- China
- India
- Japan
- South Korea
- ASEAN
- Rest of Asia Pacific
- Middle East and Africa
- Middle East
- Saudi Arabia
- United Arab Emirates
- Turkey
- Rest of Middle East
- Africa
- South Africa
- Nigeria
- Rest of Africa
- Middle East
- North America
Geography Analysis
Asia Pacific retained 38.45% of 2025 revenue and is projected to expand at an 11.18% CAGR, cementing its position as the largest fixed-line communications market. China's mandate for 10 G city networks drives nationwide fiber deployment, while India's Digital Bharat program triggers public-private joint ventures that add more than 0.5 million route-kilometers annually. Japanese and Korean operators upgrade to 25 G and 50 G PON to support immersive media and industrial automation.
North America leverages the BEAD program to close rural gaps. Tier-1 carriers accelerate urban builds, racing satellite broadband players to lock in long-term subscribers. Verizon's fixed-wireless subscriber gains highlight substitution risk, yet fiber build counts hit new quarterly highs as pole-attachment reforms shorten permitting queues. Canadian open-access rules compel incumbents to wholesale fiber loops, fostering retail competition that stimulates take-rates without eroding network-owner economics.
Europe's Gigabit Infrastructure Act streamlines trenching approvals and enforces "dig-once" coordination, cutting civil-works costs by double digits. France and Spain now post FTTH take-up rates above 75%, proving demand elasticity once ubiquitous gigabit service is available. Germany's late start accelerates on the back of private-equity-funded altnets, while the United Kingdom's Project Gigabit auctions extend coverage to hard-to-reach hamlets.
- Huawei Technologies Co. Ltd
- Cisco Systems Inc.
- Nokia Corp.
- ZTE Corp.
- Broadcom Inc.
- Arris (CommScope)
- Arista Networks Inc.
- Avaya Inc.
- Allied Telesis Inc.
- Corning Inc.
- Prysmian Group
- Adtran Inc.
- Calix Inc.
- DZS Inc.
- Ribbon Communications
- Telefonaktiebolaget LM Ericsson
- Juniper Networks Inc.
- FiberHome Telecommunication
- CommScope Holding Co.
- NEC Corp.
Additional Benefits:
- The market estimate (ME) sheet in Excel format
- 3 months of analyst support
TABLE OF CONTENTS
1 INTRODUCTION
- 1.1 Study Assumptions and Market Definition
- 1.2 Scope of the Study
2 RESEARCH METHODOLOGY
3 EXECUTIVE SUMMARY
4 MARKET LANDSCAPE
- 4.1 Market Overview
- 4.2 Market Drivers
- 4.2.1 Rising demand for gigabit-speed broadband in urban clusters
- 4.2.2 Massive fiber-to-the-home (FTTH) roll-outs by incumbents and altnets
- 4.2.3 Cloud/hyperscale data-center back-haul requirements
- 4.2.4 Government universal-service and subsidy programs (BEAD, RDOF, EU CEF-2)
- 4.2.5 Repurposing of legacy copper ducts lowers civil-works cost (under-reported)
- 4.2.6 Edge-compute densification needs ultra-low-latency fixed links (under-reported)
- 4.3 Market Restraints
- 4.3.1 High capex and long ROI cycles for last-mile fiber
- 4.3.2 Substitution risk from 5G FWA and satellite broadband
- 4.3.3 Skilled-labor shortages for fiber splicing and testing
- 4.3.4 Municipal right-of-way and pole-attachment delays (under-reported)
- 4.4 Value Chain Analysis
- 4.5 Regulatory Landscape
- 4.6 Technological Outlook
- 4.7 Porter's Five Forces Analysis
- 4.7.1 Threat of New Entrants
- 4.7.2 Bargaining Power of Buyers
- 4.7.3 Bargaining Power of Suppliers
- 4.7.4 Threat of Substitutes
- 4.7.5 Competitive Rivalry
- 4.8 Investment Analysis
5 MARKET SIZE AND GROWTH FORECASTS (VALUE)
- 5.1 By Product Type
- 5.1.1 Transmission Equipment
- 5.1.2 Switching Equipment
- 5.1.3 Access Equipment (DSLAM, OLT, etc.)
- 5.1.4 Customer-Premises Equipment (Routers, STB, ONT)
- 5.1.5 Fiber-optic Cables
- 5.1.6 Others
- 5.2 By Service Type
- 5.2.1 Fixed Voice
- 5.2.2 Fixed Broadband Data
- 5.2.3 IPTV / Value-added Services
- 5.3 By Technology
- 5.3.1 Digital Subscriber Line
- 5.3.2 Coaxial (Docsis)
- 5.3.3 Fiber (FTTx/FTTH)
- 5.3.4 Hybrid Fiber-Coax
- 5.4 By End User
- 5.4.1 Residential
- 5.4.2 Small and Medium Enterprises
- 5.4.3 Large Enterprises
- 5.4.4 Government and Public Sector
- 5.4.5 Data Centers
- 5.5 By Geography
- 5.5.1 North America
- 5.5.1.1 United States
- 5.5.1.2 Canada
- 5.5.1.3 Mexico
- 5.5.2 South America
- 5.5.2.1 Brazil
- 5.5.2.2 Argentina
- 5.5.2.3 Rest of South America
- 5.5.3 Europe
- 5.5.3.1 Germany
- 5.5.3.2 United Kingdom
- 5.5.3.3 France
- 5.5.3.4 Russia
- 5.5.3.5 Rest of Europe
- 5.5.4 Asia Pacific
- 5.5.4.1 China
- 5.5.4.2 India
- 5.5.4.3 Japan
- 5.5.4.4 South Korea
- 5.5.4.5 ASEAN
- 5.5.4.6 Rest of Asia Pacific
- 5.5.5 Middle East and Africa
- 5.5.5.1 Middle East
- 5.5.5.1.1 Saudi Arabia
- 5.5.5.1.2 United Arab Emirates
- 5.5.5.1.3 Turkey
- 5.5.5.1.4 Rest of Middle East
- 5.5.5.2 Africa
- 5.5.5.2.1 South Africa
- 5.5.5.2.2 Nigeria
- 5.5.5.2.3 Rest of Africa
- 5.5.5.1 Middle East
- 5.5.1 North America
6 COMPETITIVE LANDSCAPE
- 6.1 Market Concentration
- 6.2 Strategic Moves
- 6.3 Market Share Analysis
- 6.4 Company Profiles (includes Global level Overview, Market level overview, Core Segments, Financials, Strategic Information, Market Rank/Share, Products and Services, Recent Developments)
- 6.4.1 Huawei Technologies Co. Ltd
- 6.4.2 Cisco Systems Inc.
- 6.4.3 Nokia Corp.
- 6.4.4 ZTE Corp.
- 6.4.5 Broadcom Inc.
- 6.4.6 Arris (CommScope)
- 6.4.7 Arista Networks Inc.
- 6.4.8 Avaya Inc.
- 6.4.9 Allied Telesis Inc.
- 6.4.10 Corning Inc.
- 6.4.11 Prysmian Group
- 6.4.12 Adtran Inc.
- 6.4.13 Calix Inc.
- 6.4.14 DZS Inc.
- 6.4.15 Ribbon Communications
- 6.4.16 Telefonaktiebolaget LM Ericsson
- 6.4.17 Juniper Networks Inc.
- 6.4.18 FiberHome Telecommunication
- 6.4.19 CommScope Holding Co.
- 6.4.20 NEC Corp.
7 MARKET OPPORTUNITIES AND FUTURE OUTLOOK
- 7.1 White-space and Unmet-need Assessment


