

|
시장보고서
상품코드
2122820
산업용 조명 : 시장 점유율 분석, 업계 동향 및 통계, 성장 예측(2026-2031년)Industrial Lighting - Market Share Analysis, Industry Trends & Statistics, Growth Forecasts (2026 - 2031) |
||||||
 Mordor Intelligence
산업용 조명 시장 규모는 2025년 78억 3,000만 달러로 평가되었습니다. 2026년에는 84억 2,000만 달러로 확대되어 2026년부터 2031년에 걸쳐 CAGR 7.5%로 성장을 지속하여, 2031년에는 120억 9,000만 달러에 이를 것으로 예측됩니다.

본 보고서는 광원(고휘도 방전등 등), 제품 형태(램프 및 조명 기구 등), 설치 형태(신축, 개보수, 교체), 제품 유형(하이베이/로우베이, 플러드/에리어 등), 최종 사용자용도(석유 및 가스,광업 및 금속, 기타), 지역(북미, 남미, 기타)별로 분류되어 있습니다. 시장 전망은 금액(달러) 기준으로 제시되어 있습니다.
세계의 산업용 조명 시장 동향 및 인사이트
LED 가격-성능 곡선의 가파른 상승
LED의 광속 효율은 1와트당 200루멘을 초과하고, 생산 비용은 매년 15-20%씩 지속적으로 하락하고 있어 공장 개보수 시 투자 회수 기간이 단축되고 있습니다. 현재 스마트 조명 기구에는 센서 및 무선 통신 기능이 내장되어 있어 별도의 제어 인프라가 필요하지 않으며, 예기치 못한 가동 중지 시간을 줄여주는 예측 유지보수가 가능해졌습니다. 효율성과 지능성이라는 두 가지 장점을 모두 갖춘 LED는 신축 및 개조 모두에서 표준적인 선택지로 자리매김하고 있습니다.
리모델링용 조명 기구에 대한 수요
1980년부터 2010년 사이에 건설된 공장의 경우, 형광등이나 HID 조명 기구의 수명이 다해가고 있지만 건물 구조 자체는 여전히 양호합니다. ‘플러그 앤 플레이’ 방식의 LED 개조 키트는 기존 배선에 그대로 통합할 수 있어 생산 중단을 최소화하고 설치 공수를 최대 40%까지 줄여줍니다. 50-70%의 에너지 절감 효과로 24개월 이내에 투자 회수가 가능해져, 경제 상황이 불투명한 상황에서도 재무 담당자가 프로젝트를 승인하는 데 힘을 실어주고 있습니다.
LED 드라이버에 대한 관세 변동
멕시코 및 캐나다에서 수입되는 드라이버에 부과되는 최대 25%의 미국 관세는 프로젝트 비용을 상승시키고 조달 일정을 복잡하게 만들고 있습니다. 많은 제조업체가 주문처를 동남아시아로 전환하고 있지만, 운송 시간 증가 및 품질 보증 관련 과제는 여전히 남아 있습니다.
부문별 분석
2025년 기준, LED는 산업용 조명 시장 점유율의 65.20%를 차지했으며, 스마트형 제품은 2031년까지 연평균 성장률(CAGR) 9.8%로 성장하고 있습니다. 산업용 조명 시장 전체에서는 고휘도 방전(HID) 조명 기구가 초고휘도가 필요한 용도에서 20.05%의 점유율을 유지하고 있는 반면, 에너지 절약 규제가 강화됨에 따라 형광등의 점유율은 13.65%로 하락했습니다.
가격 인하와 통합된 연결성 덕분에 LED의 우위가 확고해지고 있습니다. 스마트 LED에는 재실 감지 기능과 별도의 배선이 필요 없는 무선 메쉬 제어 기능이 내장되어 있습니다. 5만루멘 이상의 출력이 필요한 제철소나 조선소에서는 여전히 HID가 사용되고 있지만, 각 OEM 업체들은 현재 이 틈새 시장에 혁신을 가져오기 위해 고출력 LED 프로토타입 개발을 추진하고 있습니다. OLED는 여전히 1.10%라는 극히 미미한 점유율에 그치고 있지만, 주로 균일한 빛으로 오염을 방지해야 하는 클린룸의 곡면 표면 등에서 활용되고 있습니다.
2025년 매출액 중 램프 및 조명 기구가 48.80%를 차지했으나, 제어 시스템과 센서는 2031년까지 연평균 성장률(CAGR) 9.6%를 나타낼 것으로 예측되며, 이는 산업용 조명 시장 내에서 가장 높은 성장률입니다. 제어 모듈은 점등 시간을 최적화하고 에너지 소비를 25-35% 절감할 뿐만 아니라, 부품의 노후화를 감지하는 예측 알고리즘에 데이터를 제공합니다.
서비스는 29.05%의 점유율을 차지하고 있으며, 재무 부서가 설비 투자(CapEx)보다 운영비(OpEx)를 선호하는 경향이 있어 LaaS(Lighting as a Service) 계약은 연평균 32.8%의 성장률을 보이고 있습니다. 서비스 제공업체는 하드웨어, 제어 시스템, 유지보수를 하나의 월정액 요금에 통합하여, 플랜트 소유주에게 기술 노후화에 따른 위험을 경감시켜 줍니다.
지역별 분석
아시아태평양은 2025년 매출의 39.10%를 차지했으며, 2031년까지 연평균 성장률(CAGR) 8.05%로 성장할 것으로 전망됩니다. 중국의 스마트 공장 지원금 및 인도의 산업 회랑 구축으로 인해 조명 기구 수요는 높은 수준을 유지하고 있는 반면, 일본과 한국에서는 프로젝트 입찰 시 디지털 트윈 도입이 명시되어 있습니다. 동남아시아는 중국에서 비롯된 공급망 재편의 혜택을 받고 있으며, 그린필드(Greenfield)에서의 조명 설비 설치가 촉진되고 있습니다.
북미는 2025년 매출의 30.65%를 차지하며 연평균 성장률(CAGR) 6.95%로 확대되고 있습니다. 공장의 평균 연식이 30년인 만큼, 이 지역에서는 개보수 프로젝트에서 산업용 조명 시장 점유율이 가장 높습니다. ANSI/IES 규격의 갱신으로 인해 업그레이드가 의무화되었으나, 멕시코산 수입품에 대한 관세가 부품 원가(BOM)를 상승시켜 베트남 및 태국으로의 조달처 전환을 촉진하고 있습니다. 캐나다의 탄소 배출 감축 인센티브로 인해 중공업 분야의 LED 도입이 더욱 가속화되고 있습니다.
유럽은 2025년 매출의 30.25%를 차지했으며, 연평균 성장률(CAGR)은 6.65%에 달할 전망입니다. 독일은 조명과 로봇공학을 연계하는 ‘인더스트리 4.0’ 시범 프로젝트에서 주도적인 역할을 수행하고 있는 반면, 프랑스와 영국은 2030년 기후 목표를 달성하기 위해 에너지 절약을 추진하고 있습니다. 폴란드와 체코를 포함한 동유럽은 제조업 현대화에 할당된 EU 구조 기금을 바탕으로 8.95%라는 높은 성장률을 보이고 있습니다.
기타 혜택 :
- 엑셀 형식 시장 예측(ME) 시트
- 3개월간의 애널리스트 지원
자주 묻는 질문
목차
제1장 유도등
제2장 조사 방법
제3장 주요 요약
제4장 시장 구도
제5장 시장 규모 및 성장 예측
제6장 경쟁 구도
제7장 시장 기회 및 향후 전망
KTH 26.09.08According to Mordor Intelligence, the industrial lighting market size is expected to grow from USD 7.83 billion in 2025 to USD 8.42 billion in 2026 and is forecast to reach USD 12.09 billion by 2031 at 7.5% CAGR over 2026-2031.
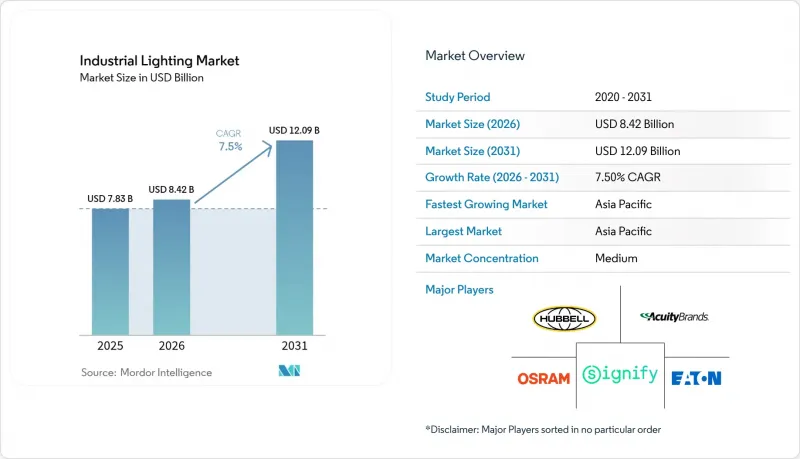
This report is Segmented by Light Source (High-Intensity Discharge, and More), Offering (Lamps and Luminaires, and More), Installation Type (New Build, Retrofit, Replacement), Product Type (High/Low Bay, Flood/Area, and More), End-User Application (Oil and Gas, Mining and Metals, and More), and Geography (North America, South America, and More). The Market Forecasts are Provided in Terms of Value (USD).
Global Industrial Lighting Market Trends and Insights
Steepening LED price-performance curve
LED efficacy has surpassed 200 lumens per watt and production costs keep falling by 15-20% every year, shortening payback periods in factory retrofits. Smart luminaires now embed sensors and wireless radios, eliminating separate control infrastructure and enabling predictive maintenance that reduces unplanned downtime. The combined efficiency and intelligence edge positions LEDs as the default choice for both new builds and upgrades.
Demand for retrofit-ready luminaires
Factories built between 1980 and 2010 approach end-of-life for fluorescent and HID fixtures, yet remain structurally sound. Plug-and-play LED retrofit kits slot into existing wiring and minimize production interruptions, slashing installation labor by up to 40%. Energy savings of 50-70% deliver sub-24-month paybacks, persuading financial controllers to green-light projects even amid economic uncertainty.
Tariff volatility on LED drivers
U.S. duties of up to 25% on drivers imported from Mexico and Canada inflate project costs and complicate procurement schedules. Many manufacturers are rerouting orders to Southeast Asia, but longer shipping times and quality-assurance challenges linger.
Other drivers and restraints analyzed in the detailed report include:
- Stricter workplace-safety illumination codes
- Digital twin-enabled lighting tools
- Cybersecurity concerns over connected fixtures
For complete list of drivers and restraints, kindly check the Table Of Contents.
Segment Analysis
LED held 65.20% of the industrial lighting market share in 2025, and smart variations are growing at a 9.8% CAGR through 2031. Within the industrial lighting market size, high-intensity discharge fixtures retain 20.05% share for extreme-output tasks, while fluorescent slips to 13.65% as energy codes tighten.
Affordability gains and integrated connectivity consolidate LED dominance. Smart LEDs incorporate occupancy sensing and wireless mesh control that bypasses separate wiring. HID persists in steel mills and shipyards demanding >50,000 lumen outputs, yet OEMs now prototype high-power LEDs to disrupt this niche. Organic LED remains a 1.10% sliver, mainly for curved cleanroom surfaces where uniform light prevents contamination.
Lamps and luminaires supplied 48.80% of 2025 revenue, but control systems and sensors are forecast to post a 9.6% CAGR to 2031, the fastest within the industrial lighting market. Control modules optimize burn hours, slash energy by 25-35%, and feed predictive algorithms that flag component fatigue.
Services contribute 29.05% share, with LaaS contracts growing 32.8% annually as finance teams prefer OpEx over CapEx. Providers bundle hardware, controls, and maintenance in one monthly fee, de-risking technology obsolescence for plant owners.
Complete Report Scope:
- By Light Source
- LED
- High-Intensity Discharge (HID)
- Fluorescent
- Induction
- Organic LED (OLED)
- By Offering
- Lamps and Luminaires
- Control Systems and Sensors
- Services (Design, LaaS, Maintenance)
- By Installation Type
- New Build
- Retrofit
- Replacement
- By Product Type
- High / Low Bay
- Flood / Area
- Task and Spotlight
- Explosion-proof / Harsh-Environment
- By End-user Application
- Oil and Gas
- Mining and Metals
- Pharmaceutical and Clean-room
- Discrete and Process Manufacturing
- Warehousing and Logistics
- Food and Beverage
- Chemical and Petrochemical
- By Geography
- North America
- United States
- Canada
- Mexico
- South America
- Brazil
- Argentina
- Rest of South America
- Europe
- Germany
- United Kingdom
- France
- Italy
- Rest of Europe
- Asia-Pacific
- China
- Japan
- South Korea
- India
- Rest of Asia-Pacific
- Middle East
- Saudi Arabia
- United Arab Emirates
- Rest of Middle East
- Africa
- South Africa
- Rest of Africa
- North America
Geography Analysis
Asia-Pacific contributed 39.10% of 2025 revenue and is forecast for an 8.05% CAGR to 2031. China's smart-factory subsidies and India's industrial corridor build-outs keep fixture demand high, while Japan and South Korea specify digital twins in project tenders. Southeast Asia benefits from supply-chain realignment away from China, boosting greenfield lighting installations.
North America captured 30.65% of turnover in 2025, advancing at a 6.95% CAGR. The industrial lighting market share for retrofit projects is greatest here because plants average 30 years old. ANSI/IES updates compel upgrades, yet tariffs on Mexican drivers inflate BOM costs and spur sourcing shifts to Vietnam and Thailand. Canadian carbon-reduction incentives further accelerate LED uptake across heavy industry.
Europe generated 30.25% of 2025 sales and will post a 6.65% CAGR. Germany leads with Industry 4.0 pilots linking lighting to robotics, while France and the UK target energy savings to meet 2030 climate goals. Eastern Europe, including Poland and Czechia, grows faster at 8.95% on the back of EU structural funds earmarked for manufacturing upgrades.
- Signify Holding N.V.
- Cree Lighting, a division of IDEAL INDUSTRIES, Inc.
- Eaton Corporation plc
- Emerson Electric Co.
- Dialight plc
- Legrand SA
- Zumtobel Group AG
- Acuity Brands, Inc.
- ams OSRAM AG
- TRILUX GmbH & Co. KG
- Hubbell Incorporated
- Larson Electronics, LLC
- Hilclare Lighting (Group Sylvania)
- Raytec Ltd
- Glamox AS
- Nemalux Inc.
- R. STAHL AG
- ABB Installation Products Inc.
- Schneider Electric SE
- Cooper Lighting Solutions (Signify)
- TOYODA GOSEI Co., Ltd.
- Seoul Semiconductor Co., Ltd.
- Current (dba GE Current, a DAI Company)
- Warom Technology Incorporated Company
Additional Benefits:
- The market estimate (ME) sheet in Excel format
- 3 months of analyst support
TABLE OF CONTENTS
1 INTRODUCTION
- 1.1 Study Assumptions and Market Definition
- 1.2 Scope of the Study
2 RESEARCH METHODOLOGY
3 EXECUTIVE SUMMARY
4 MARKET LANDSCAPE
- 4.1 Market Overview
- 4.2 Market Drivers
- 4.2.1 LED price/performance curve keeps steepening
- 4.2.2 Demand for retrofit-ready luminaires in aged factories
- 4.2.3 Stricter workplace-safety illumination codes (ANSI/IES)
- 4.2.4 Digital twin-enabled lighting design tools
- 4.2.5 Warehouse automation triggering task-specific optics
- 4.2.6 Lighting-as-a-Service (LaaS) contracts unlocking CapEx
- 4.3 Market Restraints
- 4.3.1 Persistent tariff volatility on LED drivers
- 4.3.2 Industrial cybersecurity concerns over connected fixtures
- 4.3.3 Skills gap for controls commissioning and maintenance
- 4.3.4 Legacy hazardous-location certification timelines
- 4.4 Industry Value Chain Analysis
- 4.5 Regulatory Landscape
- 4.6 Technological Outlook
- 4.7 Porter's Five Forces Analysis
- 4.7.1 Threat of New Entrants
- 4.7.2 Bargaining Power of Suppliers
- 4.7.3 Bargaining Power of Buyers
- 4.7.4 Threat of Substitutes
- 4.7.5 Competitive Rivalry
- 4.8 Impact of Macroeconomic Trends on the Market
- 4.9 Investment Analysis
5 MARKET SIZE AND GROWTH FORECASTS (VALUE)
- 5.1 By Light Source
- 5.1.1 LED
- 5.1.2 High-Intensity Discharge (HID)
- 5.1.3 Fluorescent
- 5.1.4 Induction
- 5.1.5 Organic LED (OLED)
- 5.2 By Offering
- 5.2.1 Lamps and Luminaires
- 5.2.2 Control Systems and Sensors
- 5.2.3 Services (Design, LaaS, Maintenance)
- 5.3 By Installation Type
- 5.3.1 New Build
- 5.3.2 Retrofit
- 5.3.3 Replacement
- 5.4 By Product Type
- 5.4.1 High / Low Bay
- 5.4.2 Flood / Area
- 5.4.3 Task and Spotlight
- 5.4.4 Explosion-proof / Harsh-Environment
- 5.5 By End-user Application
- 5.5.1 Oil and Gas
- 5.5.2 Mining and Metals
- 5.5.3 Pharmaceutical and Clean-room
- 5.5.4 Discrete and Process Manufacturing
- 5.5.5 Warehousing and Logistics
- 5.5.6 Food and Beverage
- 5.5.7 Chemical and Petrochemical
- 5.6 By Geography
- 5.6.1 North America
- 5.6.1.1 United States
- 5.6.1.2 Canada
- 5.6.1.3 Mexico
- 5.6.2 South America
- 5.6.2.1 Brazil
- 5.6.2.2 Argentina
- 5.6.2.3 Rest of South America
- 5.6.3 Europe
- 5.6.3.1 Germany
- 5.6.3.2 United Kingdom
- 5.6.3.3 France
- 5.6.3.4 Italy
- 5.6.3.5 Rest of Europe
- 5.6.4 Asia-Pacific
- 5.6.4.1 China
- 5.6.4.2 Japan
- 5.6.4.3 South Korea
- 5.6.4.4 India
- 5.6.4.5 Rest of Asia-Pacific
- 5.6.5 Middle East
- 5.6.5.1 Saudi Arabia
- 5.6.5.2 United Arab Emirates
- 5.6.5.3 Rest of Middle East
- 5.6.6 Africa
- 5.6.6.1 South Africa
- 5.6.6.2 Rest of Africa
- 5.6.1 North America
6 COMPETITIVE LANDSCAPE
- 6.1 Market Concentration
- 6.2 Strategic Moves
- 6.3 Market Share Analysis
- 6.4 Company Profiles (includes Global Level Overview, Market Level Overview, Core Segments, Financials as available, Strategic Information, Market Rank/Share, Products and Services, Recent Developments)
- 6.4.1 Signify Holding N.V.
- 6.4.2 Cree Lighting, a division of IDEAL INDUSTRIES, Inc.
- 6.4.3 Eaton Corporation plc
- 6.4.4 Emerson Electric Co.
- 6.4.5 Dialight plc
- 6.4.6 Legrand SA
- 6.4.7 Zumtobel Group AG
- 6.4.8 Acuity Brands, Inc.
- 6.4.9 ams OSRAM AG
- 6.4.10 TRILUX GmbH & Co. KG
- 6.4.11 Hubbell Incorporated
- 6.4.12 Larson Electronics, LLC
- 6.4.13 Hilclare Lighting (Group Sylvania)
- 6.4.14 Raytec Ltd
- 6.4.15 Glamox AS
- 6.4.16 Nemalux Inc.
- 6.4.17 R. STAHL AG
- 6.4.18 ABB Installation Products Inc.
- 6.4.19 Schneider Electric SE
- 6.4.20 Cooper Lighting Solutions (Signify)
- 6.4.21 TOYODA GOSEI Co., Ltd.
- 6.4.22 Seoul Semiconductor Co., Ltd.
- 6.4.23 Current (dba GE Current, a DAI Company)
- 6.4.24 Warom Technology Incorporated Company
7 MARKET OPPORTUNITIES AND FUTURE OUTLOOK
- 7.1 White-space and Unmet-need Assessment


