

|
시장보고서
상품코드
2122951
에너지 분야 블록체인 : 시장 점유율 분석, 업계 동향 및 통계, 성장 예측(2026-2031년)Blockchain In Energy - Market Share Analysis, Industry Trends & Statistics, Growth Forecasts (2026 - 2031) |
||||||
 Mordor Intelligence
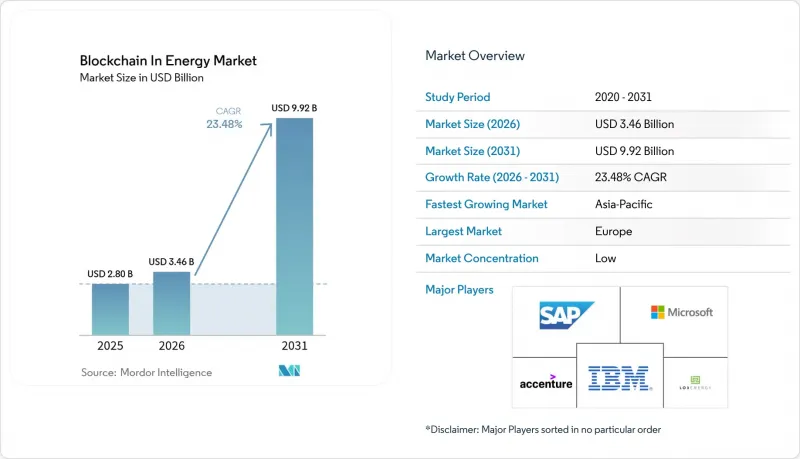
Mordor Intelligence에 의하면, 에너지 분야 블록체인 시장 규모는 2026년에 34억 6,000만 달러로 추정되고 2025년 28억 달러에서 확대해, 2031년에는 99억 2,000만 달러에 이를 것으로 예측됩니다.
2026-2031년 동안의 연평균 성장률(CAGR)은 23.48%가 될 것으로 전망됩니다.

본 보고서는 용도별(결제, 스마트 계약, 디지털 ID, 거버넌스, 리스크, 컴플라이언스(GRC), 기타) 및 지역별로 분류되어 있습니다.
세계의 에너지 분야 블록체인 시장 동향 및 인사이트
변동 요금제와 P2P 거래의 부상
변동 요금제는 정액 요금 대신 수급 불균형을 반영한 실시간 가격 책정을 도입하여, 프로슈머(생산자 겸 소비자)에게 차익 거래 기회를 창출하고 있습니다. 오스트리아의 ‘smartCOMMUNITY’ 플랫폼에서는 각 가정이 전력 구매 계약을 맞춤 설정하고, 잉여 태양광 발전 전력을 경쟁 가격으로 거래할 수 있게 되어, 2030년까지 100% 재생에너지를 달성하겠다는 오스트리아의 목표에 부합하는 노력으로 자리 잡고 있습니다. 일본 간사이 전력(KEPCO)의 실증 실험에서는 고정 임베디드 가격 제도의 폐지로 185억 달러의 절감 효과가 예상되며, 이는 시장 주도형 가격 책정이 국가 에너지 경제를 어떻게 변화시킬 수 있는지를 보여주고 있습니다. 지방의 마이크로그리드에 도입된 컨소시엄형 블록체인은 기존 넷 미터링에 비해 뛰어난 투자 회수율을 실현하고 있으며, 분산형 시장의 상업적 실행 가능성을 부각시키고 있습니다. 참가자가 늘어남에 따라 네트워크 효과로 인해 유동성이 깊어지며, 에너지 분야에서의 블록체인 보급이 가속화되고 있습니다.
유틸리티자가 지원하는 블록체인 인증 프로그램
각 전력 회사는 재생에너지 도입 의무를 준수하면서도 시장에 대한 영향력을 유지하기 위해 블록체인을 활용한 인증 제도를 출범시키고 있습니다. 한국의 KEPCO가 주도하는 파트너십을 통해 블록체인 상에 전국적인 재생에너지 인증(REC) 기준을 구축하고 있으며, 규제 당국의 감독 하에 투명한 발행과 거래를 보장하고 있습니다. 캐나다에서는 알렉트라(Alectra)의 ‘GridExchange’가 전력 회사가 운영하는 시장에서 통제권을 양도파관 않고도 분산형 에너지 자원(DER) 소유자에게 계통 지원에 대한 대가를 지급하는 시스템을 실증하고 있습니다. 텍사스주 ERCOT의 REC 프로그램은 블록체인이 기존 체계를 대체하는 것이 아니라 강화할 수 있는 검증된 거래 메커니즘을 제공하고 있으며, 가장 확장성이 높은 도입 사례는 기존 사업자들에게 혼란을 주는 것이 아니라 협력해 나가는 방향을 시사하고 있습니다.
확장성과 거래 비용의 제약
기존의 작업 증명(PoW) 체인에서는 실시간 계통 균형 조정에 필요한 마이크로 트랜잭션을 처리할 수 없습니다. SNARK를 활용한 병렬 실행에 대한 연구에서는 처리량이 1만 배 향상되는 것으로 나타났으며, 이는 실용적 규모로의 실현 가능한 길을 시사합니다. 솔라나(Solana)의 지분 증명(PoS) 네트워크는 트랜잭션당 단 0.00412Wh만 소비하며, 2024년 총 소비량은 미국 일반 가정 833가구 분에 해당합니다. 이는 에너지 효율이 높은 합의 방식을 통해 배출량과 수수료를 모두 줄일 수 있음을 증명합니다. EV 에너지 거래를 위해 테스트된 하이브리드 블록체인은 작업 증명(PoW)의 보안성과 지분 증명(PoS)의 효율성을 융합하여, 에너지 분야에서 블록체인의 실용적인 솔루션을 제시하고 있습니다.
부문별 분석
분산형 에너지 자원(DER)의 유연성을 활용하는 스마트 계약은 2025년에 6억 5,000만 달러 규모 시장을 차지했으며, 2031년까지 연평균 성장률(CAGR) 28.74%로 성장할 전망입니다. 이 하위 부문은 전기차(EV) 차량군 및 가정용 배터리의 운영을 자동화하여 인적 개입을 최소화하는 동시에, 수요 피크 시간대의 전력 시스템 안정성을 뒷받침합니다. 결제 및 P2P 에너지 거래는 2025년 에너지 분야 블록체인 시장 규모의 37.30%라는 최대 점유율을 유지하며, 자동 청구 및 결제의 즉각적인 상업적 실현 가능성을 입증하고 있습니다. 기업 조달 분야에서 재생에너지의 1시간 단위 매칭이 표준화됨에 따라 거버넌스, 리스크, 컴플라이언스(GRC) 솔루션이 탄력을 받고 있으며, 이는 에너지 분야 블록체인 시장에서 현재 다루고 있는 이용 사례의 폭이 얼마나 넓은지를 여실히 보여주고 있습니다.
AI와 블록체인의 스마트 계약을 통합함으로써 운영 효율성이 향상되고 있습니다. 마이크로소프트(Microsoft)와 플렉시다오(Flexidao)가 추진하는 해상 풍력 발전의 발전량과 데이터센터의 전력 소비량을 1시간 단위로 매칭하는 이니셔티브는 위조 불가능한 원장이 이중 계산을 방지하고, 고도화된 알고리즘이 동기화 점수를 극대화하는 메커니즘을 보여줍니다. 제로 지식 증명을 활용한 디지털 ID 프레임워크는 전기차가 스마트 그리드와 연동될 때 사용자의 프라이버시를 보호하며, 에너지 효율 향상 인센티브 제도는 수요 반응(Demand Response) 참여에 대해 토큰 보상을 제공합니다. 이러한 끊임없이 진화하는 활용 사례들이 결합되어 에너지 부문에서 블록체인의 활용 범위를 넓히고, 전력망 전반에 걸친 장기적인 가치 창출의 기반을 마련하고 있습니다.
지역별 분석
유럽은 2025년 매출의 31.60%를 차지하며, 일관된 정책 수단과 대규모 공공 지출을 통해 주도적 지위를 확고히 했습니다. 유럽 집행위원회가 2,250만 유로 규모로 추진하는 함부르크 난방 전환 프로젝트에서는 블록체인을 활용하여 열원의 출처를 검증하고 있으며, 투명성이 높은 에너지 시스템을 위한 국가 차원의 노력이 강조되고 있습니다. Enoda의 ENSEMBLE 플랫폼을 심사한 ‘유럽 블록체인 샌드박스’와 같은 규제 샌드박스는 혁신 기업의 규정 준수 비용을 절감하고 상용화를 가속화합니다. 오스트리아의 P2P 거래 도입은 일관된 정책 지원이 상업적 채택으로 이어져 에너지 부문 시장에서 블록체인의 기반을 공고히 한다는 사실을 입증하고 있습니다.
아시아태평양은 가장 빠르게 성장하는 지역으로, 연평균 성장률(CAGR)은 27.10%로 예측됩니다. 일본의 개정된 펀드 규정에 따라 유한파트너십(LP)이 암호화폐를 보유할 수 있게 되면서, 국내 자본이 Web3 에너지 벤처 기업으로 유입되고 있습니다. 한국의 전력사 컨소시엄은 정부 부처의 감독 하에 블록체인 기반 재생에너지 크레딧(REC) 시장을 구축하고 있으며, 그 정당성이 추가 투자를 유치하고 있습니다(tokenpost.kr). 호주의 V2G(Vehicle-to-Grid) 요금에 관한 조사에서는 적응형 요금 설계가 고객의 비용 절감과 전력망 지원 모두를 극대화한다는 점이 부각되었으며, 이는 미래의 블록체인 플랫폼을 위한 재현 가능한 청사진을 제시하고 있습니다.
북미 시장에서는 대규모 통합이 진행되고 있습니다. 미국 에너지부가 수립한 10년 V2G 로드맵은 사이버 보안과 스마트 충전을 우선 과제로 삼고 있으며, 이는 블록체인의 상호 운용성을 뒷받침하는 기반 계층이 될 것입니다. 캘리포니아주의 급속 충전 시범 사업에서는 분산형 원장을 통해 재생에너지의 통합과 송전망 서비스가 최적화될 때 비용 절감이 실현된다는 사실이 입증되었습니다. 캐나다의 Alectra GridExchange는 전력 회사가 운영하는 시장의 실증 사례로, 기존의 역할을 유지하면서 새로운 거래 아키텍처를 도입하고 있습니다.
기타 혜택
- 엑셀 형식 시장 예측(ME) 시트
- 3개월간 애널리스트 지원
자주 묻는 질문
목차
제1장 서론
제2장 조사 방법
제3장 주요 요약
제4장 시장 구도
제5장 시장 규모 및 성장 예측
제6장 경쟁 구도
제7장 시장 기회 및 향후 전망
KTH 26.09.08According to Mordor Intelligence, blockchain in energy market size market size in 2026 is estimated at USD 3.46 billion, growing from 2025 value of USD 2.80 billion with 2031 projections showing USD 9.92 billion, growing at 23.48% CAGR over 2026-2031.
This report is Segmented by Application (Payments, Smart Contracts, Digital Identities, Governance, Risk and Compliance (GRC), Other Applications) and Geography
Global Blockchain In Energy Market Trends and Insights
Emergence of Variable Tariffs & P2P Trading
Variable tariffs are replacing flat rates with real-time pricing that reflects supply-demand imbalances, creating arbitrage opportunities for prosumers. Austria's smartCOMMUNITY platform lets households customize power-purchase agreements and trade surplus solar at competitive rates, aligning with the nation's 100% renewable goal by 2030. Japan's KEPCO trial projected USD 18.5 billion in savings from abandoning fixed feed-in tariffs, showing how market-driven pricing can reshape national energy economics. Consortium blockchains deployed in rural microgrids deliver superior paybacks versus traditional net-metering, highlighting the commercial viability of distributed marketplaces. As participation rises, network effects deepen liquidity, accelerating adoption across the blockchain in the energy sector market.
Utility-Backed Blockchain Certificate Programs
Utilities are launching blockchain certificate schemes to comply with renewable mandates while retaining market influence. South Korea's KEPCO partnership is building a national renewable-energy certificate (REC) standard on blockchain, ensuring transparent issuance and trade under regulatory supervision. In Canada, Alectra's GridExchange demonstrates how a utility-operated marketplace pays DER owners for grid support without ceding control. Texas's ERCOT REC program offers a proven trading mechanism that blockchain can enhance rather than replace, signaling that the most scalable deployments will collaborate with, not disrupt, incumbent operators
Scalability & Transaction-Cost Constraints
Legacy proof-of-work chains cannot process the micro-transactions needed for real-time grid balancing. Research on SNARK-based parallel execution shows 10,000-fold throughput gains, hinting at a viable path to utility scale. Solana's proof-of-stake network consumes only 0.00412 Wh per transaction, with total 2024 usage equal to 833 US homes, proving that energy-efficient consensus can cut both emissions and fees. Hybrid blockchains tested for EV energy trading blend proof-of-work security with proof-of-stake efficiency, demonstrating practical solutions for the blockchain in the energy sector market.
Other drivers and restraints analyzed in the detailed report include:
- VC Funding Surge into Energy-Token Start-ups
- Token-Based Financing for DER Roll-Outs
- Fragmented Energy-Data Standards
For complete list of drivers and restraints, kindly check the Table Of Contents.
Segment Analysis
Smart contracts for DER flexibility accounted for USD 0.65 billion in 2025 and are poised to grow at a 28.74% CAGR to 2031. This sub-segment automates the dispatch of EV fleets and household batteries, minimizing human intervention and supporting grid stability during peak demand. Payments and P2P energy trading maintained the largest 37.30% share of the blockchain in the energy sector market size in 2025, proving immediate commercial viability for automated billing and settlement. Governance, risk, and compliance solutions are gaining momentum as hourly renewable-energy matching becomes standard in corporate procurement, underscoring the breadth of use cases now captured by the blockchain in the energy sector market.
Integrating AI with blockchain smart contracts is elevating operational efficiency. Microsoft and Flexidao's hourly matching of offshore wind output with data center consumption shows how immutable ledgers prevent double-counting while advanced algorithms maximize synchronicity scores. Digital-identity frameworks relying on zero-knowledge proofs safeguard user privacy as EVs interact with smart grids, and energy-efficiency incentive schemes deliver token rewards for demand-response participation. Together, these evolving applications expand the blockchain in the energy sector industry toolkit and anchor long-term value creation across the grid.
Complete Report Scope:
- By Application
- Payments
- Smart Contracts
- Digital Identities
- Governance, Risk and Compliance (GRC)
- Other Applications
- By Geography
- North America
- United States
- Canada
- Europe
- United Kingdom
- Germany
- Netherlands
- Rest of Europe
- Asia-Pacific
- Japan
- Australia
- New Zealand
- Rest of APAC
- South America
- Brazil
- Mexico
- Rest of South America
- Middle East and Africa
- United Arab Emirates
- Israel
- Rest of Middle East and Africa
- North America
Geography Analysis
Europe contributed 31.60% of 2025 revenue, cementing its lead through cohesive policy instruments and sizable public outlays. The European Commission's EUR 22.5 million Hamburg heating transition leverages blockchain to verify heat-source provenance, emphasizing state-level commitment to transparent energy systems. Regulatory sandboxes, such as the European Blockchain Sandbox that vetted Enoda's ENSEMBLE platform, lower the compliance cost for innovators and accelerate commercialization. Austria's P2P trading roll-out confirms that consistent policy support translates to commercial adoption and underpins the blockchain in the energy sector market.
Asia-Pacific is the fastest-growing geography, projected at 27.10% CAGR. Japan's revised fund rules allow limited partnerships to hold crypto, channeling domestic capital toward Web3 energy ventures. South Korea's utility consortium is establishing blockchain-based REC markets under ministerial oversight, granting legitimacy that draws additional investment, tokenpost.kr. Australia's vehicle-to-grid tariff research highlights how adaptive rate design maximizes both customer savings and grid support, offering a replicable blueprint for future blockchain platforms.
North America's market advances on large-scale integration. The US Department of Energy's 10-year vehicle-to-grid roadmap prioritizes cybersecurity and smart charging-the foundational layers for blockchain interoperability. California's fast-charging pilots demonstrate cost reductions when renewable integration and grid services are optimized through distributed ledgers. Canada's Alectra GridExchange provides a proof point for utility-operated marketplaces, preserving incumbent roles while embracing new transactional architectures.
- SAP SE
- Electron
- Accenture
- IBM
- LO3 Energy
- GREENEUM
- Drift Marketplace
- IOTA Foundation
- BTL Group
- Power Ledger
- ImpactPPA
Additional Benefits:
- The market estimate (ME) sheet in Excel format
- 3 months of analyst support
TABLE OF CONTENTS
1 INTRODUCTION
- 1.1 Study Assumptions and Market Definition
- 1.2 Scope of the Study
2 RESEARCH METHODOLOGY
3 EXECUTIVE SUMMARY
4 MARKET LANDSCAPE
- 4.1 Market Overview
- 4.2 Market Drivers
- 4.2.1 Emergence of variable tariffs and P2P trading
- 4.2.2 Utility-backed blockchain certificate programs
- 4.2.3 VC funding surge into energy-token start-ups
- 4.2.4 Token-based financing for DER roll-outs (under-reported)
- 4.2.5 24/7 carbon-free energy tracking demand (under-reported)
- 4.2.6 Grid-service monetisation for EV fleets (under-reported)
- 4.3 Market Restraints
- 4.3.1 Scalability and transaction-cost constraints
- 4.3.2 Fragmented energy-data standards
- 4.3.3 Token-price volatility impacting business models (under-reported)
- 4.3.4 Regulatory uncertainty on energy-token securities (under-reported)
- 4.4 Value / Supply-Chain Analysis
- 4.5 Regulatory Landscape
- 4.6 Technological Outlook (DLT stacks, PoS, PoA)
- 4.7 Porter's Five Forces
- 4.7.1 Bargaining Power of Suppliers
- 4.7.2 Bargaining Power of Consumers
- 4.7.3 Threat of New Entrants
- 4.7.4 Intensity of Competitive Rivalry
- 4.7.5 Threat of Substitutes
5 MARKET SIZE AND GROWTH FORECASTS (VALUE)
- 5.1 By Application
- 5.1.1 Payments
- 5.1.2 Smart Contracts
- 5.1.3 Digital Identities
- 5.1.4 Governance, Risk and Compliance (GRC)
- 5.1.5 Other Applications
- 5.2 By Geography
- 5.2.1 North America
- 5.2.1.1 United States
- 5.2.1.2 Canada
- 5.2.2 Europe
- 5.2.2.1 United Kingdom
- 5.2.2.2 Germany
- 5.2.2.3 Netherlands
- 5.2.2.4 Rest of Europe
- 5.2.3 Asia-Pacific
- 5.2.3.1 Japan
- 5.2.3.2 Australia
- 5.2.3.3 New Zealand
- 5.2.3.4 Rest of APAC
- 5.2.4 South America
- 5.2.4.1 Brazil
- 5.2.4.2 Mexico
- 5.2.4.3 Rest of South America
- 5.2.5 Middle East and Africa
- 5.2.5.1 United Arab Emirates
- 5.2.5.2 Israel
- 5.2.5.3 Rest of Middle East and Africa
- 5.2.1 North America
6 COMPETITIVE LANDSCAPE
- 6.1 Market Concentration
- 6.2 Strategic Moves
- 6.3 Market Share Analysis
- 6.4 Company Profiles {(includes Global level Overview)}
- 6.4.1 SAP SE
- 6.4.2 Electron
- 6.4.3 Accenture
- 6.4.4 IBM
- 6.4.5 LO3 Energy
- 6.4.6 GREENEUM
- 6.4.7 Drift Marketplace
- 6.4.8 IOTA Foundation
- 6.4.9 BTL Group
- 6.4.10 Power Ledger
- 6.4.11 ImpactPPA
7 MARKET OPPORTUNITIES AND FUTURE OUTLOOK
- 7.1 White-space and Unmet-need Assessment


