

|
시장보고서
상품코드
2123093
제조업 분야 블록체인 시장 : 점유율 분석, 업계 동향과 통계, 성장 예측(2026-2031년)Blockchain In Manufacturing - Market Share Analysis, Industry Trends & Statistics, Growth Forecasts (2026 - 2031) |
||||||
 Mordor Intelligence
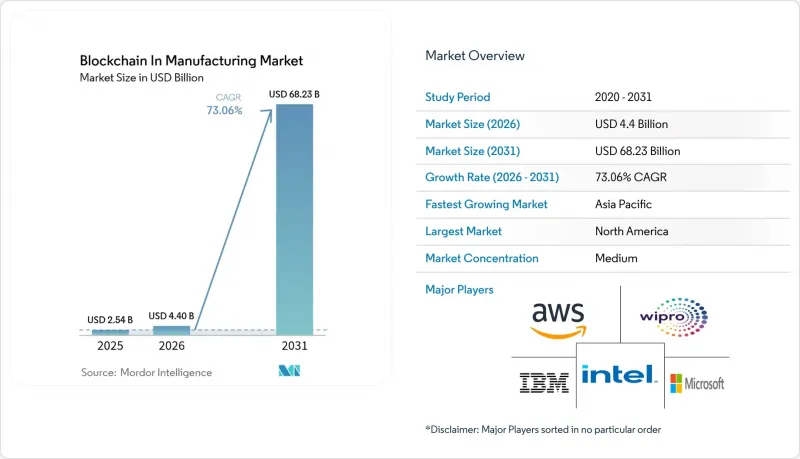
Mordor Intelligence에 의하면, 제조업 분야 블록체인 시장 규모는 2025년에 25억 4,000만 달러로 평가되었고 2026년 44억 달러에서 2031년까지 682억 3,000만 달러에 이를 것으로 예측됩니다.
예측 기간(2026-2031년) 동안 연평균 성장률(CAGR)은 73.06%가 될 것으로 전망됩니다.
본 보고서는 용도(물류·공급망 관리, 위조품 관리, 품질 관리·규정 준수 등), 최종 사용자 산업(자동차, 항공우주 및 방위, 제약·생명과학 등), 배포 방식(On-Premise, 클라우드/블록체인-어-서비스, 하이브리드/엣지), 블록체인 유형(퍼블릭, 프라이빗/퍼미션형 등) 및 지역별로 분류되어 있습니다.
전 세계 제조업 분야 블록체인 시장 동향 및 인사이트
개별 제조업에서의 BaaS 도입 확대
현재, 이산 제조업체의 도입 선정에서 클라우드를 통해 제공되는 BaaS가 61.8%를 차지하고 있으며, 이 점유율은 전문적인 노드 관리의 필요성을 배제하는 턴키 환경에 의해 뒷받침되고 있습니다. 마이크로소프트가 블록체인 텔레메트리 기능을 자사의 Fabric 분석 제품군에 통합함에 따라, 사용자는 기업 데이터와 함께 생산 라인 이벤트를 조회할 수 있게 되어 시스템 통합 시간을 35% 단축할 수 있게 되었습니다. 비용 절감과 간소화된 DevOps가 결합되어, 신속한 도입과 엄격한 가동 시간이 요구되는 자동차, 전자기기, 산업용 기기 제조 공장에서 BaaS의 보급이 확실하게 진행되고 있습니다.
공급망 내 원산지 및 추적성 의무화
FDA는 식품 추적성 규정 적용 기한을 연장했으나, 변경 불가능한 로트 단위의 보고 요건에 블록체인이 적합하다는 점을 재확인했습니다. 이와 병행하여 EU의 ‘디지털 제품 여권’ 규정 또한 제품 수명 주기의 모든 단계에 걸친 분산형 기록의 필요성을 강조하고 있습니다. 제약, 항공우주 및 민수용 전자기기 제조업체들은 리콜 프로세스를 자동화하기 위해 일련번호 데이터를 공유 원장에 통합하고 있으며, 이를 통해 수동 감사 비용을 28% 절감하고 있습니다.
표준화의 파편화와 상호 운용성의 격차
보편적인 데이터 모델이 존재하지 않기 때문에 공급업체는 거래처마다 비용이 많이 드는 미들웨어 브리지를 구축할 수밖에 없습니다. GS1 및 ISO 워킹 그룹은 공통 스키마 초안을 작성하고 있지만, 그 채택 속도는 급속히 다가오는 도입 기한을 따라가지 못하고 있습니다. 자동차 및 화학 업계의 컨소시엄 주도 시범 프로젝트는 진전을 보이고 있지만, 여전히 예외적인 사례에 그치고 있으며 표준으로 자리 잡지는 못했습니다.
부문 분석
품질 관리 및 규정 준수 도구는 2031년까지 연평균 성장률(CAGR) 74.20%를 나타낼 것으로 예측되며, 2025년에는 제조업 분야 블록체인 시장 점유율의 45.20%를 차지하는 물류 관리를 능가하는 성장이 전망됩니다. FDA의 일련번호 부여 시범 사업을 시행 중인 제약 기업들은 배치 이력이 분산 원장에 저장됨에 따라 부적합 사항 해결이 30% 빨라졌습니다고 보고하고 있습니다. 감사 증명서를 자동으로 발급하는 스마트 계약 워크플로가 종이 기반 기록 관리를 대체하여 규정 준수 대응 시간을 40% 단축하고 있습니다. 2차 활용 사례로는 예측 유지보수 로그와 보증 심사가 꼽히며, 위조가 불가능한 이력을 통해 분쟁 발생률이 감소하고 있습니다. 고급 화학제품의 태그가 진위성 해시를 퍼블릭 원장에 반영하여 소비자의 신뢰를 높임으로써, 위조품 감지는 여전히 중요한 위치를 차지하고 있습니다. 이용 사례가 늘어남에 따라, 제조 업계의 블록체인은 그린필드 및 브라운필드 공장 모두에서 현저한 보급세를 보이고 있습니다.
품질 관리 시스템은 적층 가공 분야에서 새로운 지적 재산권 보호 체계의 기반이 되고 있으며, 제로 지식 증명을 통해 기업 기밀을 공개하지 않고도 설계의 규정 준수를 확인하고 있습니다. 전자 부품 제조업체는 장치상의 암호 서명을 원장(ledger)과 통합함으로써 리콜의 정확도를 높이고 있습니다. 이처럼 품질, 규정 준수, 위조 방지가 융합됨에 따라 상호 운용 가능한 플랫폼에 대한 기업의 관심이 가속화되고 있으며, 이는 제조업 분야 블록체인의 성장세를 뒷받침하고 있습니다.
2025년에는 자동차 공장이 매출의 30.60%를 차지하며 시장을 주도했습니다. 이는 광범위한 부품 추적성 의무와 성숙한 인더스트리 4.0에 대한 투자를 반영한 결과입니다. 그럼에도 불구하고, 생명과학 분야의 제조업체들은 전 세계 의료 규제에 따라 일련번호 부여, 콜드체인 추적, 환자 단위 원산지 추적이 의무화됨에 따라, 2031년까지 연평균 성장률(CAGR) 75.60%로 제조업 분야 블록체인 시장 규모를 확대해 나갈 전망입니다. IBM 및 Merck와 제휴하고 있는 제약 기업들은 모의 감사에서 리콜 대응 속도가 25% 빨라졌습니다고 보고했습니다. 항공우주 및 방위 분야의 시스템 통합사업자들은 3D 프린팅 부품에 안전한 부품 계보 장부를 도입하여 위조 위험을 줄이고 있습니다. 가전 제조업체는 사후 서비스를 효율화하기 위해 제품에 보증 토큰을 내장하고 있으며, 한편 식품 및 음료 가공업체는 지속가능성 감사 요건을 충족하기 위해 ‘농장에서 식탁까지’ 추적 시스템을 도입하고 있습니다. 이러한 산업별 다각화를 통해 제조업 분야 블록체인의 보급 범위는 조기 도입 기업에 그치지 않고 더욱 확대되고 있습니다.
지역별 분석
북미는 FDA의 규제, 확립된 클라우드 인프라, 그리고 원장 스타트업에 대한 강력한 벤처 캐피탈 지원 덕분에 2025년 매출의 43.80%를 차지했습니다. 의약품 일련번호 부여 및 항공우주 부품의 계보에 관한 요건이 초기 실증 사업을 촉진했으며, 이는 이후 여러 공장으로 확대되었습니다. 주 차원의 인센티브도 중소기업의 도입을 더욱 뒷받침했습니다.
아시아태평양은 2026년부터 2031년까지 75.20%라는 가장 높은 연평균 성장률(CAGR)이 예측되는데, 이는 중국의 산업용 블록체인 시범 사업이나 일본의 ‘사회 5.0’ 스마트 팩토리 로드맵과 같은 광범위한 디지털화 이니셔티브를 반영한 것입니다. 아시아개발은행(ADB)의 ‘프로젝트 트라이데카곤’은 제조업의 수출 신용 흐름과 연계된 은행 간 분산형 결제에 대한 해당 지역의 노력을 상징합니다. 인도의 전자기기 클러스터와 한국의 배터리 공급망 협정이 탄력을 받으며, 2차 공급업체의 도입을 촉진하고 있습니다.
유럽은 탄소 발자국 및 순환 경제 지표를 기록하기 위해 ‘디지털 제품 여권’을 활용하며, 지속가능성을 중시하는 도입 지역으로 부상하고 있습니다. 독일의 자동차 OEM 기업들은 재활용 철강 함유량을 추적하기 위해 공동 원장을 채택하고 있는 반면, 프랑스의 주요 항공우주 기업들은 적층 가공용 분말 관리에 블록체인을 도입하고 있습니다. 북유럽의 제조업체들은 수력 발전과 풍력 발전을 활용해 허가형 네트워크를 운영하며 ESG에 대한 기대에 부응하고 있습니다. 국경을 초월한 데이터 스페이스 프로젝트는 상호 운용성을 촉진하고 있으며, 제조 시장에서 블록체인이 전 세계적으로 성숙해짐에 따라 지역별 도입 사례가 공통된 거버넌스 아래 통합되어 나갈 것으로 예측됩니다.
기타 혜택:
- 엑셀 형식 시장 예측(ME) 시트
- 3개월간의 애널리스트 지원
자주 묻는 질문
목차
제1장 서론
제2장 조사 방법
제3장 주요 요약
제4장 시장 구도
제5장 시장 규모와 성장 예측
제6장 경쟁 구도
제7장 시장 기회와 향후 전망
JHS 26.09.09According to Mordor Intelligence, the blockchain in manufacturing market size was valued at USD 2.54 billion in 2025 and estimated to grow from USD 4.4 billion in 2026 to reach USD 68.23 billion by 2031, at a CAGR of 73.06% during the forecast period (2026-2031).
This report is Segmented by Application (Logistics and Supply Chain Management, Counterfeit Management, Quality Control and Compliance, and More), End-User Vertical (Automotive, Aerospace and Defense, Pharmaceutical and Life Sciences, and More), Deployment Mode (On-Premises, Cloud/Blockchain-as-a-Service, and Hybrid/Edge), Blockchain Type (Public, Private/Permissioned, and More), and Geography.
Global Blockchain In Manufacturing Market Trends and Insights
Escalating Adoption of BaaS Across Discrete Manufacturing
Cloud-delivered BaaS now represents 61.8% of implementation preferences among discrete manufacturers, a share propelled by turnkey environments that eliminate the need for specialized node management. Microsoft's integration of blockchain telemetry into its Fabric analytics suite allows users to query production-line events alongside enterprise data, reducing system-integration time by 35%. Cost savings combine with simplified DevOps to ensure that BaaS gains traction in automotive, electronics, and industrial equipment factories that require rapid onboarding yet stringent uptime.
Supply-Chain Provenance and Traceability Mandates
The FDA extended its Food Traceability Rule deadline yet reaffirmed blockchain's suitability for immutable lot-level reporting requirements. Parallel EU Digital Product Passport rules reinforce the need for distributed records across every product lifecycle phase. Pharmaceutical, aerospace, and consumer electronics producers are embedding serialization data onto shared ledgers to automate recall, thereby trimming manual audit costs by 28%.
Fragmented Standards and Interoperability Gaps
The absence of universal data models forces suppliers to build costly middleware bridges for each trading partner. GS1 and ISO working groups are drafting common schemas, yet adoption lags fast-moving implementation deadlines. Consortium-based pilots in automotive and chemicals signal progress but remain pockets rather than norms.
Other drivers and restraints analyzed in the detailed report include:
- Demand for Counterfeit Mitigation in High-Value Components
- Tokenization Enabling Equipment-as-a-Service Models
- Limited Blockchain Talent in OT Environments
For complete list of drivers and restraints, kindly check the Table Of Contents.
Segment Analysis
Quality control and compliance tools are projected to post a 74.20% CAGR to 2031, outpacing logistics management despite the latter's 45.20% hold on the blockchain in manufacturing market share in 2025. Pharmaceutical firms running FDA serialization pilots report 30% faster deviation resolution when batch histories sit on a distributed ledger. Smart-contract workflows that auto-issue audit certificates replace paper record-keeping, cutting compliance hours by 40%. Second-wave applications include predictive maintenance logs and warranty adjudication, where immutable histories lower dispute rates. Counterfeit detection remains central as luxury-grade chemical tags feed authenticity hashes into public ledgers, enhancing consumer trust. As use cases multiply, the blockchain in the manufacturing market registers significant traction across both greenfield and brownfield plants.
Quality systems also form the backbone for emerging intellectual-property protection schemes in additive manufacturing, where zero-knowledge proofs confirm design compliance without revealing trade secrets. Electronic-component makers integrate on-device cryptographic signatures with the ledger, strengthening recall precision. This convergence of quality, compliance, and anti-counterfeiting accelerates enterprise interest in interoperable platforms, reinforcing the blockchain in the manufacturing market growth narrative.
Automotive factories dominated revenue with 30.60% in 2025, reflecting extensive part traceability obligations and mature Industry 4.0 investments. Nonetheless, life-sciences producers will expand the blockchain in the manufacturing market size for their segment at a 75.60% CAGR through 2031 as serialization, cold-chain tracking, and patient-level provenance become mandatory under global health regulations. Drug makers collaborating with IBM and Merck reported 25% faster recall execution during simulated audits. Aerospace and defense integrators adopt secure part genealogy ledgers for 3D-printed components, mitigating tampering risks. Consumer-electronics brands embed warranty tokens into products to streamline after-sales service, while food and beverage processors deploy farm-to-fork tracking to satisfy sustainability audits. Collectively, vertical diversification broadens the blockchain in the manufacturing industry footprint beyond early movers.
Complete Report Scope:
- By Application
- Logistics and Supply Chain Management
- Counterfeit Management
- Quality Control and Compliance
- Predictive Maintenance and Asset Tracking
- Smart Contracts for Procurement
- Other Applications
- By End-user Vertical
- Automotive
- Aerospace and Defense
- Pharmaceutical and Life Sciences
- Consumer Electronics
- Industrial Machinery
- Food and Beverage
- Other Verticals
- By Deployment Mode
- On-premises
- Cloud/Blockchain-as-a-Service (BaaS)
- Hybrid/Edge
- By Blockchain Type
- Public
- Private/Permissioned
- Consortium
- By Geography
- North America
- United States
- Canada
- Mexico
- South America
- Brazil
- Argentina
- Rest of South America
- Europe
- Germany
- United Kingdom
- France
- Italy
- Spain
- Rest of Europe
- Asia-Pacific
- China
- Japan
- India
- South Korea
- Rest of Asia-Pacific
- Middle East and Africa
- Middle East
- Saudi Arabia
- United Arab Emirates
- Turkey
- Rest of Middle East
- Africa
- South Africa
- Nigeria
- Kenya
- Rest of Africa
- Middle East
- North America
Geography Analysis
North America held 43.80% of 2025 revenue owing to FDA mandates, established cloud infrastructure, and strong venture capital backing for ledger startups. Pharmaceutical serialization and aerospace part pedigree requirements drove early proofs that have since scaled to multi-plant deployments. State-level incentives further supported SME adoption.
Asia Pacific registers the highest 75.20% CAGR forecast between 2026 and 2031, reflecting sweeping digitization initiatives such as China's industrial blockchain pilots and Japan's Society 5.0 smart-factory roadmap. The Asian Development Bank's Project Tridecagon showcases regional commitment to inter-bank distributed settlements that align with manufacturing export-credit flows. India's electronics clusters and South Korea's battery-supply chain agreements add momentum, catalyzing adoption by Tier-2 suppliers.
Europe emerges as a sustainability-centric adopter, leveraging Digital Product Passports to document carbon footprints and circular-economy metrics. Germany's automotive OEMs employ joint ledgers to track recycled steel content, while France's aerospace primes adopt blockchain to manage additive-manufacturing powders. Nordic manufacturers power permissioned networks with hydro and wind energy, addressing ESG expectations. Cross-border data-spaces projects promote interoperability, suggesting that regional implementations will converge under common governance as the blockchain in the manufacturing market matures globally.
- IBM Corporation
- Microsoft Corporation
- SAP SE
- Oracle Corporation
- Amazon Web Services Inc.
- Accenture PLC
- Wipro Limited
- Infosys Ltd
- Intel Corporation
- Advanced Micro Devices Inc.
- VeChain Technology
- Chronicled Inc.
- SyncFab
- Siemens AG
- Honeywell International Inc.
- General Electric
- R3 LLC
- ConsenSys
- Kaleido
- BlockApps Inc.
Additional Benefits:
- The market estimate (ME) sheet in Excel format
- 3 months of analyst support
TABLE OF CONTENTS
1 INTRODUCTION
- 1.1 Study Assumptions and Market Definition
- 1.2 Scope of the Study
2 RESEARCH METHODOLOGY
3 EXECUTIVE SUMMARY
4 MARKET LANDSCAPE
- 4.1 Market Overview
- 4.2 Market Drivers
- 4.2.1 Escalating adoption of BaaS across discrete manufacturing
- 4.2.2 Supply-chain provenance and traceability mandates
- 4.2.3 Demand for counterfeit mitigation in high-value components
- 4.2.4 Tokenisation enabling equipment-as-a-service models
- 4.2.5 Integration with additive manufacturing for secure part genealogy
- 4.2.6 Privacy-preserving zero-knowledge-proof pilots for IP protection
- 4.3 Market Restraints
- 4.3.1 Fragmented standards and interoperability gaps
- 4.3.2 Limited blockchain talent in OT environments
- 4.3.3 Rising energy-use concerns for on-chain traceability
- 4.3.4 Uncertainty around post-quantum security requirements
- 4.4 Value/Supply-Chain Analysis
- 4.5 Regulatory Landscape
- 4.6 Technological Outlook
- 4.7 Porter's Five Forces Analysis
- 4.7.1 Bargaining Power of Suppliers
- 4.7.2 Bargaining Power of Buyers
- 4.7.3 Threat of New Entrants
- 4.7.4 Threat of Substitutes
- 4.7.5 Intensity of Competitive Rivalry
- 4.8 Impact of Macroeconomic Trends on the Market
5 MARKET SIZE AND GROWTH FORECASTS (VALUE)
- 5.1 By Application
- 5.1.1 Logistics and Supply Chain Management
- 5.1.2 Counterfeit Management
- 5.1.3 Quality Control and Compliance
- 5.1.4 Predictive Maintenance and Asset Tracking
- 5.1.5 Smart Contracts for Procurement
- 5.1.6 Other Applications
- 5.2 By End-user Vertical
- 5.2.1 Automotive
- 5.2.2 Aerospace and Defense
- 5.2.3 Pharmaceutical and Life Sciences
- 5.2.4 Consumer Electronics
- 5.2.5 Industrial Machinery
- 5.2.6 Food and Beverage
- 5.2.7 Other Verticals
- 5.3 By Deployment Mode
- 5.3.1 On-premises
- 5.3.2 Cloud/Blockchain-as-a-Service (BaaS)
- 5.3.3 Hybrid/Edge
- 5.4 By Blockchain Type
- 5.4.1 Public
- 5.4.2 Private/Permissioned
- 5.4.3 Consortium
- 5.5 By Geography
- 5.5.1 North America
- 5.5.1.1 United States
- 5.5.1.2 Canada
- 5.5.1.3 Mexico
- 5.5.2 South America
- 5.5.2.1 Brazil
- 5.5.2.2 Argentina
- 5.5.2.3 Rest of South America
- 5.5.3 Europe
- 5.5.3.1 Germany
- 5.5.3.2 United Kingdom
- 5.5.3.3 France
- 5.5.3.4 Italy
- 5.5.3.5 Spain
- 5.5.3.6 Rest of Europe
- 5.5.4 Asia-Pacific
- 5.5.4.1 China
- 5.5.4.2 Japan
- 5.5.4.3 India
- 5.5.4.4 South Korea
- 5.5.4.5 Rest of Asia-Pacific
- 5.5.5 Middle East and Africa
- 5.5.5.1 Middle East
- 5.5.5.1.1 Saudi Arabia
- 5.5.5.1.2 United Arab Emirates
- 5.5.5.1.3 Turkey
- 5.5.5.1.4 Rest of Middle East
- 5.5.5.2 Africa
- 5.5.5.2.1 South Africa
- 5.5.5.2.2 Nigeria
- 5.5.5.2.3 Kenya
- 5.5.5.2.4 Rest of Africa
- 5.5.5.1 Middle East
- 5.5.1 North America
6 COMPETITIVE LANDSCAPE
- 6.1 Market Concentration
- 6.2 Strategic Moves and Partnerships
- 6.3 Market Share Analysis
- 6.4 Company Profiles (includes Global level Overview, Market level overview, Core Segments, Financials as available, Strategic Information, Market Rank/Share for key companies, Products and Services, Recent Developments)
- 6.4.1 IBM Corporation
- 6.4.2 Microsoft Corporation
- 6.4.3 SAP SE
- 6.4.4 Oracle Corporation
- 6.4.5 Amazon Web Services Inc.
- 6.4.6 Accenture PLC
- 6.4.7 Wipro Limited
- 6.4.8 Infosys Ltd
- 6.4.9 Intel Corporation
- 6.4.10 Advanced Micro Devices Inc.
- 6.4.11 VeChain Technology
- 6.4.12 Chronicled Inc.
- 6.4.13 SyncFab
- 6.4.14 Siemens AG
- 6.4.15 Honeywell International Inc.
- 6.4.16 General Electric
- 6.4.17 R3 LLC
- 6.4.18 ConsenSys
- 6.4.19 Kaleido
- 6.4.20 BlockApps Inc.
7 MARKET OPPORTUNITIES AND FUTURE OUTLOOK
- 7.1 White-space and Unmet-need Assessment


