

|
시장보고서
상품코드
2123136
입체 디스플레이 시장 : 점유율 분석, 산업 동향 및 통계 데이터, 성장 예측(2026-2031년)Volumetric Display - Market Share Analysis, Industry Trends & Statistics, Growth Forecasts (2026 - 2031) |
||||||
 Mordor Intelligence
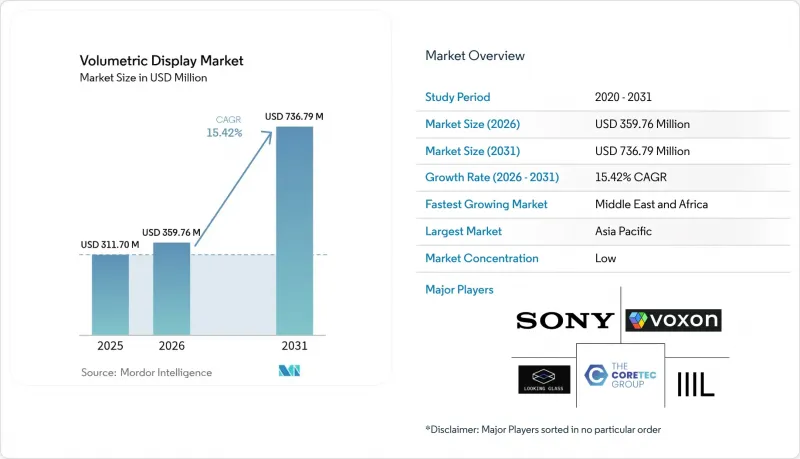
Mordor Intelligence에 의하면, 입체 디스플레이 시장 규모는 2025년에 3억 1,170만 달러로 평가되었고 2026년 3억 5,976만 달러에서 2031년까지 7억 3,679만 달러에 이를 것으로 예측되며, 예측 기간(2026-2031년) CAGR은 15.42%를 나타낼 전망입니다.
본 보고서는 디스플레이 유형(스윕형 입체 디스플레이, 정적 입체 디스플레이), 구성 요소(프로젝터·레이저 모듈 등), 디스플레이 크기(시야각 360° 미만, 기타),용도(의료용 영상 진단·수술 계획 등), 최종 사용자 산업(자동차 및 운송 기계 등), 지역별로 분류되어 있습니다. 시장 예측은 금액(달러) 기준으로 제시되어 있습니다.
세계 입체 디스플레이 시장 동향 및 인사이트
저침습 수술에서의 3D 해부학적 시각화 기술 도입
병원에서는 평면 모니터의 공간적 한계를 극복하기 위해 입체 디스플레이를 도입하고 있습니다. RealView Imaging사의 Holoscope-i.와 같은 시스템은 외과의사가 모든 각도에서 확인할 수 있는 인터랙티브 3D/4D 홀로그램을 투영하여 눈의 피로를 줄여줄 뿐만 아니라 수술 시간을 단축합니다. 여러 의료 기관을 대상으로 한 연구에 따르면, 수술팀은 61%의 사례에서 2D 영상보다 홀로그래픽을 이용한 수술 전 계획을 선택하고 있으며, 이는 이러한 임상적 추세를 뒷받침합니다. 형광 유도 수술과 홀로그래픽 출력이 융합됨에 따라 플랫폼은 단순한 뷰어에서 통합형 수술 콘솔로 진화하고 있습니다. 구매 동향을 보면, 2027년까지 이 장비가 복잡한 수술실에서 표준 장비로 자리 잡을 것으로 예상되며, 이에 따라 입체 디스플레이 시장의 연간 하드웨어 수요가 증가할 전망입니다.
국방 분야의 안경 없이 사용 가능한 360° 상황 인식 시스템에 대한 수요
중동 군에서는 지휘소 내에 입체 디스플레이를 도입하여, 여러 장교가 헤드셋을 착용하지 않고도 동일한 3D 전장 화면을 공유할 수 있도록 하고 있습니다. 미국 공군 연구소가 자금을 지원한 시험에서는 타일 형태로 배열된 2D 지도와 비교하여 표적 인식 및 임무 계획 주기가 단축되는 것이 확인되었습니다. ISR(정보·감시·정찰) 시스템 업데이트를 위한 예산 배분에서는 현재 안경이 필요 없는 3D 테이블에 중점적으로 예산이 할당되고 있으며, 2026년까지 안정적인 조달이 예상됩니다. 각 OEM 업체들이 군사 규격에 부합하는 케이스와 모래·먼지에 대한 내성을 인증함에 따라, 방위 분야에서의 수주는 입체 디스플레이 시장에 있어 신뢰할 수 있는 수익원이 되고 있습니다.
여전히 지속되고 있는 HD 미만의 네이티브 해상도가 임상 진단을 제한하고 있습니다.
현재의 입체 디스플레이 시스템 대부분은 미세혈관 검사나 병리 진단에 임상 의사가 필요로 하는 화소 밀도에 미치지 못하고 있습니다. 대형 협업용 테이블에서는 가로 방향 해상도의 낮음이 더욱 두드러져, 방사선과 의사는 세부 사항을 확인하기 위해 CT 워크스테이션으로 돌아갈 수밖에 없습니다. 색 정보를 고려한 홀로그래픽 최적화에 대한 연구를 통해 그 격차는 점차 좁혀지고 있지만, 진단 등급의 프로토타입은 여전히 실험실 단계에 머물러 있습니다. 픽셀 피치가 디지털 현미경의 임계값에 도달할 때까지는 입체 디스플레이 시장이 의료 분야의 수익원으로 진단이 아닌 수술 계획에 의존할 수밖에 없습니다.
부문 분석
스윕 볼륨 방식은 성숙한 생산 설비와 현장에서 입증된 신뢰성 덕분에 2025년에는 입체 디스플레이 시장의 66.85% 점유율을 차지할 전망입니다. 회전에 의한 잔상 효과로 인해 콤팩트한 설치 공간 내에서 고휘도 이미지를 구현하고 있어, 의료 및 방위 분야의 콘솔에 최적입니다. 스태틱 볼륨 방식의 장치는 현재로서는 소형이지만, 홀로그래픽 레이저 여기 그래픽을 통해 가동 부품이 제거되고 유지보수 주기가 대폭 단축되기 때문에 17.48%라는 가장 높은 연평균 성장률(CAGR)을 기록하고 있습니다.
최근 진행된 컬러 정적 체적 큐브 시연에서는 뛰어난 환경 내성이 입증되어, 기계적 진동을 허용할 수 없는 연구소의 관심을 끌고 있습니다. 홀로그래픽 소재의 소형화가 진행됨에 따라, 정적 체적 시스템은 스윕 체적의 우위를 서서히 잠식하여 2031년까지 정적 아키텍처의 입체 디스플레이 시장 규모를 2억 2,860만 달러 이상으로 끌어올릴 것으로 예측됩니다. 두 기술 경로를 모두 습득한 공급업체는 향후 고객 선호도의 변화에 대한 위험을 헤지할 수 있게 됩니다.
광학 하드웨어(프로젝터 및 레이저 엔진)는 밝기와 색 영역이 여전히 광자 효율에 의존하기 때문에 36.52%의 점유율을 유지하고 있습니다. 그러나 구매자들이 실시간 4K 홀로그램을 요구함에 따라, 렌더링 소프트웨어와 고대역폭 GPU는 연평균 성장률(CAGR) 16.31%로 성장하고 있으며, 광학 시스템을 능가하는 추세를 보이고 있습니다. 홀로그램 전용 명령어 세트를 갖춘 프로세서가 상용 보드에 탑재됨에 따라, 컴퓨팅 서브시스템용 입체 디스플레이 시장 규모는 2026년부터 2031년 사이에 거의 두 배로 증가할 것으로 예측됩니다.
이에 대응하여 하드웨어 중심 기업들은 게임 엔진 벤더와 제휴하여 SDK를 번들로 제공하는 한편, 소프트웨어 전문 기업들은 프로젝터 제조업체에 IP 블록 라이선스를 제공합니다. 이러한 변화로 인해 시각적 아티팩트를 발생시키지 않으면서 간섭 패턴을 압축하는 알고리즘으로 가치 창출의 초점이 이동하고 있으며, 입체 디스플레이 업계 내에서 다음 경쟁의 무대가 형성되고 있습니다.
지역별 분석
2025년, 아시아태평양은 반도체 분야의 강점과 국내 엔터테인먼트 분야의 막대한 소비를 겸비한 일본, 중국, 한국의 대기업을 견인력으로 삼아 입체 디스플레이 시장에서 32.78%의 점유율을 차지하며 1위를 차지하고 있습니다. 일본이 새 지폐에 홀로그램 초상을 도입하기로 결정한 것은 이 기술이 주류로 받아들여졌음을 나타내며, 국내 광학 부품 공급업체에 활력을 불어넣고 있습니다. 한국의 통신 사업자들은 5G 홀로그램 통화를 시연하여 기업들의 시범 프로젝트 참여를 유도했습니다. 이 지역에는 공급업체가 밀집해 있어 리드타임이 짧고 제품 업데이트 주기가 가속화되고 있습니다.
북미는 2위를 차지하고 있으며, 그 원동력은 미국의 수술용 로봇 제조업체와 C2(지휘통제) 시스템에 입체형 콘솔을 통합하는 방위 연구소들입니다. 첨단 제조 테스트베드에 대한 연방 정부의 자금 지원으로 중소기업도 이 기술을 접할 기회가 늘어나며, 중견 시장에서의 전망이 넓어지고 있습니다. 캐나다 온타리오주 및 브리티시컬럼비아주에 위치한 의료 기술 클러스터는 임상시험 거점을 늘려 지역의 신뢰도를 높이고 있습니다.
유럽은 계속해서 자동차 분야로의 통합에 주력하고 있습니다. 독일의 Tier 1 공급업체는 광학 전문 기업과 제휴하여 유엔 유럽 경제 위원회(UN ECE)의 눈부심 규정을 준수하는 전면 유리 내장형 홀로그램 개발을 추진하고 있습니다. EU의 레이저 안전 기준 도입은 지연되고 있지만, 궁극적으로는 품질 기준을 높여 인증 획득 후 수출 경쟁력을 강화하게 될 것입니다.
중동 및 아프리카은 2031년까지 연평균 성장률(CAGR)이 16.92%로 가장 높은데, 이는 각국 국방부가 합동작전센터를 위해 유리가 필요 없는 360° 테이블을 조달하고 있기 때문입니다. 걸프 국가들의 정부 계열 펀드는 홀로그래픽 어트랙션을 갖춘 엔터테인먼트 복합 시설에 자금을 지원하고 있으며, 이로 인해 판매 대수가 더욱 증가하고 있습니다. 라틴아메리카에서는 도입이 초기 단계에 있지만, 브라질의 한 대학에서는 산업 디자인 커리큘럼을 위해 입체형 실험실의 시범 운영을 진행하고 있어, 대륙 전체에 미래 수요의 씨앗이 뿌려지고 있습니다.
기타 혜택:
- Excel 형식 시장 예측(ME) 시트
- 3개월간의 애널리스트 지원
자주 묻는 질문
목차
제1장 서론
제2장 분석 방법
제3장 주요 요약
제4장 시장 구도
제5장 시장 규모 및 성장률 예측
제6장 경쟁 구도
제7장 시장 기회와 향후 전망
JHS 26.09.09According to Mordor Intelligence, the volumetric display market size was valued at USD 311.7 million in 2025 and estimated to grow from USD 359.76 million in 2026 to reach USD 736.79 million by 2031, at a CAGR of 15.42% during the forecast period (2026-2031).
This report is Segmented by Display Type (Swept Volume Display, and Static Volume Display), Component (Projectors and Laser Modules, and More), Display Size (Below 360° Viewing Volume, and More), Application (Medical Imaging and Surgical Planning, and More), End-User Industry (Automotive and Transportation, and More), and Geography. The Market Forecasts are Provided in Terms of Value (USD).
Global Volumetric Display Market Trends and Insights
Adoption of 3D Anatomical Visualization in Minimally Invasive Surgeries
Hospitals integrate volumetric displays to overcome the spatial constraints of flat monitors. Systems such as RealView Imaging's Holoscope-i project interactive 3D/4D holograms that surgeons can inspect from any angle, lowering eye strain and shortening procedure times. Multi-institutional studies show surgical teams preferred holographic planning in 61% of cases over 2D images, reinforcing clinical momentum. As fluorescence-guided surgery merges with holographic output, the platform evolves from simple viewer to integrated surgical console. Purchasing patterns indicate the equipment will be standard in complex surgery suites by 2027, lifting annual hardware demand inside the volumetric display market.
Defense Demand for Glass-Free 360° Situational-Awareness Systems
Armed forces in the Middle East deploy volumetric displays inside command posts to let multiple officers share the same 3D battlespace view without headsets. Tests funded by the US Air Force Research Lab confirm quicker target recognition and mission-planning cycles compared with tiled 2D maps. Budget allocations for ISR upgrades now earmark glass-free 3D tables, signaling steady procurement through 2026. As OEMs certify mil-spec housing and sand-dust tolerance, defense orders form a reliable revenue stream for the volumetric display market.
Persistent Sub-HD Native Resolution Limiting Clinical Diagnostics
Most current volumetric systems fall below the pixel density clinicians need for micro-vascular inspection or pathology review. Lower lateral resolution becomes more pronounced on large collaborative tables, forcing radiologists to revert to CT workstations for fine detail. Research into color-aware holographic optimization is closing the gap, yet diagnostic-grade prototypes remain in labs. Until pixel pitches match digital microscopy thresholds, the volumetric display market must rely on surgical planning rather than diagnostics for medical revenue.
Other drivers and restraints analyzed in the detailed report include:
- Automotive HUD Evolution Toward In-Cabin 3D Instrument Clusters
- Media and Entertainment Pivot to Location-Based Holographic Attractions
- High Acquisition Cost versus Competing 3D Visualization Tools in SMEs
For complete list of drivers and restraints, kindly check the Table Of Contents.
Segment Analysis
Swept-volume architectures capture 66.85% volumetric display market share in 2025 thanks to mature production tooling and field-proven reliability. Rotational persistence of vision enables bright images inside compact footprints, ideal for medical and defense consoles. Static-volume units, though smaller today, post the strongest 17.48% CAGR as holographic-laser-excited graphics eliminate moving parts, slashing maintenance cycles.
Recent demonstrations of color static-volume cubes show excellent environmental robustness, enticing laboratories that cannot tolerate mechanical vibration. As holographic materials scale, static-volume systems are forecast to erode swept-volume dominance, pushing the volumetric display market size for static architectures past USD 228.6 million by 2031. Vendors that master both paths hedge against future customer preference swings.
Optical hardware-projectors and laser engines-retains 36.52% share because brightness and color gamut still depend on photon efficiency. Yet rendering software and high-bandwidth GPUs accelerate at 16.31% CAGR, outpacing optics as buyers demand real-time 4K holograms. The volumetric display market size for compute subsystems is forecast to nearly double between 2026 and 2031 as processors with hologram-specific instruction sets reach commercial boards.
In response, hardware-centric firms form alliances with game-engine vendors to bundle SDKs, while pure-play software houses license IP blocks to projector manufacturers. The shift recasts value capture toward algorithms that compress interference patterns without visual artifacts, setting the next competitive battleground inside the volumetric display industry.
Complete Report Scope:
- By Display Type
- Swept Volume Display
- Static Volume Display
- By Component
- Projectors and Laser Modules
- Display Panels and Optical Elements
- Rendering Software and GPU Hardware
- Holographic Materials
- Other Components
- By Display Size
- Below 360° Viewing Volume (Sub 24 inch cube)
- 360° Table-Top (24 inch-40 inch cube)
- Large-Format (Above 40 inch cube)
- By Application
- Medical Imaging and Surgical Planning
- Telepresence and Videoconferencing
- Education and Training Simulations
- Advertising and Digital Signage
- Entertainment and Gaming
- Engineering and Design Visualization
- Defence and Security Command Centers
- Other Applications
- By End-user Industry
- Healthcare Providers
- Automotive and Transportation
- Media, Sports and Entertainment Venues
- Industrial and Manufacturing
- Aerospace and Defence
- Academic and Research Institutes
- Others
- By Geography
- North America
- United States
- Canada
- Mexico
- Europe
- Germany
- United Kingdom
- France
- Nordics
- Rest of Europe
- South America
- Brazil
- Rest of South America
- Asia-Pacific
- China
- Japan
- India
- South-East Asia
- Rest of Asia-Pacific
- Middle East and Africa
- Middle East
- Gulf Cooperation Council Countries
- Turkey
- Rest of Middle East
- Africa
- South Africa
- Rest of Africa
- Middle East
- North America
Geography Analysis
Asia-Pacific led with 32.78% share of the volumetric display market in 2025, anchored by Japanese, Chinese, and South-Korean conglomerates that combine semiconductor strength with large domestic entertainment spend. Japan's decision to embed holographic portraits in new banknotes signals mainstream acceptance, catalyzing local optics suppliers. South-Korea's telcos demonstrated live 5G hologram calls, drawing enterprise pilot projects. The region's dense supplier base keeps lead-times short, accelerating refresh cycles.
North America ranks second, propelled by US surgical-robot makers and defense labs that integrate volumetric consoles into C2 suites. Federal funding for advanced manufacturing testbeds exposes SMEs to the technology, expanding mid-market prospects. Canada's med-tech clusters in Ontario and British Columbia add clinical validation sites, reinforcing regional credibility.
Europe remains focused on automotive integration. German Tier-1s partner with optics specialists to engineer windshield-embedded holograms compliant with UN ECE glare rules. EU laser-safety norms slow deployments but ultimately raise baseline quality, building export appeal once certificates are issued.
The Middle East and Africa register the highest 16.92% CAGR through 2031 as defense ministries procure glass-free 360° tables for joint-ops centers. Sovereign funds in the Gulf finance entertainment complexes that feature holographic attractions, further boosting unit flow. Latin America shows nascent adoption, with Brazil's universities piloting volumetric labs for industrial design curricula, seeding future demand across the continent.
- Voxon Photonics
- Looking Glass Factory Inc.
- Coretec Group Inc.
- Seekway Technology Ltd.
- Burton Inc.
- Leia Inc.
- LightSpace Technologies
- HoloTech Studios
- SeeReal Technologies
- Sony Corporation
- Magic Leap Inc.
- Google LLC
- Microsoft Corporation
- RealView Imaging Ltd.
- WayRay AG
- zSpace Inc.
- Deepsky Corporation
- Alioscopy
- Holoxica Ltd.
- The 3rd Dimension Technologies
- VividQ
- ForwardX Robotics
- Shenzhen Giant Real Technology
Additional Benefits:
- The market estimate (ME) sheet in Excel format
- 3 months of analyst support
TABLE OF CONTENTS
1 INTRODUCTION
- 1.1 Study Assumptions and Market Definition
- 1.2 Scope of the Study
2 RESEARCH METHODOLOGY
3 EXECUTIVE SUMMARY
4 MARKET LANDSCAPE
- 4.1 Market Overview
- 4.2 Market Drivers
- 4.2.1 Adoption of 3D Anatomical Visualization in Minimally Invasive Surgeries (North America and Europe)
- 4.2.2 Defense Demand for Glass-Free 360° Situational Awareness Systems (Middle East)
- 4.2.3 Automotive HUD Evolution Toward In-Cabin 3D Instrument Clusters (Germany, Japan)
- 4.2.4 Media and Entertainment Pivot to Location-Based Holographic Attractions (Asia)
- 4.2.5 Falling Projection Cost per Lumen via Solid-State Lasers (Global)
- 4.2.6 Telecom 5G Rollout Enabling Real-time Volumetric Telepresence (US, South Korea)
- 4.3 Market Restraints
- 4.3.1 Persistent Sub-HD Native Resolution Limiting Clinical Diagnostics
- 4.3.2 High Acquisition Cost vs. Competing 3D Visualization Tools in SMEs
- 4.3.3 Limited Content Authoring Ecosystem Hindering Mass Adoption
- 4.3.4 Safety Regulations around High-Intensity Laser Sources (EU)
- 4.4 Industry Ecosystem Analysis
- 4.5 Regulatory and Technological Outlook
- 4.6 Porter's Five Forces Analysis
- 4.6.1 Threat of New Entrants
- 4.6.2 Bargaining Power of Buyers
- 4.6.3 Bargaining Power of Suppliers
- 4.6.4 Threat of Substitutes
- 4.6.5 Competitive Rivalry
5 MARKET SIZE AND GROWTH FORECASTS (VALUES)
- 5.1 By Display Type
- 5.1.1 Swept Volume Display
- 5.1.2 Static Volume Display
- 5.2 By Component
- 5.2.1 Projectors and Laser Modules
- 5.2.2 Display Panels and Optical Elements
- 5.2.3 Rendering Software and GPU Hardware
- 5.2.4 Holographic Materials
- 5.2.5 Other Components
- 5.3 By Display Size
- 5.3.1 Below 360° Viewing Volume (Sub 24 inch cube)
- 5.3.2 360° Table-Top (24 inch-40 inch cube)
- 5.3.3 Large-Format (Above 40 inch cube)
- 5.4 By Application
- 5.4.1 Medical Imaging and Surgical Planning
- 5.4.2 Telepresence and Videoconferencing
- 5.4.3 Education and Training Simulations
- 5.4.4 Advertising and Digital Signage
- 5.4.5 Entertainment and Gaming
- 5.4.6 Engineering and Design Visualization
- 5.4.7 Defence and Security Command Centers
- 5.4.8 Other Applications
- 5.5 By End-user Industry
- 5.5.1 Healthcare Providers
- 5.5.2 Automotive and Transportation
- 5.5.3 Media, Sports and Entertainment Venues
- 5.5.4 Industrial and Manufacturing
- 5.5.5 Aerospace and Defence
- 5.5.6 Academic and Research Institutes
- 5.5.7 Others
- 5.6 By Geography
- 5.6.1 North America
- 5.6.1.1 United States
- 5.6.1.2 Canada
- 5.6.1.3 Mexico
- 5.6.2 Europe
- 5.6.2.1 Germany
- 5.6.2.2 United Kingdom
- 5.6.2.3 France
- 5.6.2.4 Nordics
- 5.6.2.5 Rest of Europe
- 5.6.3 South America
- 5.6.3.1 Brazil
- 5.6.3.2 Rest of South America
- 5.6.4 Asia-Pacific
- 5.6.4.1 China
- 5.6.4.2 Japan
- 5.6.4.3 India
- 5.6.4.4 South-East Asia
- 5.6.4.5 Rest of Asia-Pacific
- 5.6.5 Middle East and Africa
- 5.6.5.1 Middle East
- 5.6.5.1.1 Gulf Cooperation Council Countries
- 5.6.5.1.2 Turkey
- 5.6.5.1.3 Rest of Middle East
- 5.6.5.2 Africa
- 5.6.5.2.1 South Africa
- 5.6.5.2.2 Rest of Africa
- 5.6.5.1 Middle East
- 5.6.1 North America
6 COMPETITIVE LANDSCAPE
- 6.1 Strategic Moves
- 6.2 Market Share Analysis
- 6.3 Company Profiles {(includes Global level Overview, Market level overview, Core Segments, Financials as available, Strategic Information, Market Rank/Share for key companies, Products and Services, and Recent Developments)}
- 6.3.1 Voxon Photonics
- 6.3.2 Looking Glass Factory Inc.
- 6.3.3 Coretec Group Inc.
- 6.3.4 Seekway Technology Ltd.
- 6.3.5 Burton Inc.
- 6.3.6 Leia Inc.
- 6.3.7 LightSpace Technologies
- 6.3.8 HoloTech Studios
- 6.3.9 SeeReal Technologies
- 6.3.10 Sony Corporation
- 6.3.11 Magic Leap Inc.
- 6.3.12 Google LLC
- 6.3.13 Microsoft Corporation
- 6.3.14 RealView Imaging Ltd.
- 6.3.15 WayRay AG
- 6.3.16 zSpace Inc.
- 6.3.17 Deepsky Corporation
- 6.3.18 Alioscopy
- 6.3.19 Holoxica Ltd.
- 6.3.20 The 3rd Dimension Technologies
- 6.3.21 VividQ
- 6.3.22 ForwardX Robotics
- 6.3.23 Shenzhen Giant Real Technology
7 MARKET OPPORTUNITIES AND FUTURE OUTLOOK
- 7.1 White-space and Unmet-need Assessment


