

|
시장보고서
상품코드
2124096
인프라 모니터링 시장 : 점유율 분석, 업계 동향과 통계, 성장 예측(2026-2031년)Infrastructure Monitoring - Market Share Analysis, Industry Trends & Statistics, Growth Forecasts (2026 - 2031) |
||||||
 Mordor Intelligence
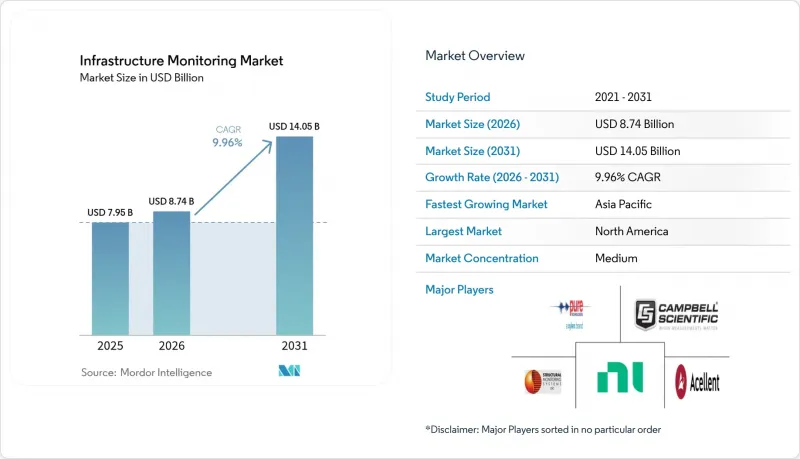
Mordor Intelligence에 의하면, 2026년 인프라 모니터링 시장 규모는 87억 4,000만 달러로 추정되고 있어 2025년 79억 5,000만 달러에서 확대되어, 2031년에는 140억 5,000만 달러에 이를 것으로 예측됩니다. 2026년부터 2031년까지 CAGR은 9.96%를 나타낼 전망입니다.
본 보고서는 기술별(유선, 무선), 제공 형태별(하드웨어, 소프트웨어, 서비스), 도입 모델별(On-Premise, 클라우드), 용도별(부식 모니터링, 균열·변형 감지 등), 최종 사용자 산업별(토목 인프라, 에너지,항공우주 및 방위 등), 그리고 지역별로 분류되어 있습니다. 시장 예측은 금액(달러) 기준으로 제시되어 있습니다.
세계 인프라 모니터링 시장 동향 및 인사이트
노후화된 교량에 대한 무선 센서 네트워크 도입 가속화(북미 및 EU)
노후화된 교량(45%가 준공 50년 이상)을 배경으로, 자산 소유자들은 변형 및 진동 데이터를 지속적으로 전송하는 무선 노드의 설치를 추진하고 있습니다. 직선형 무선 센서 네트워크 설계로 인해 전력 소비가 절감되었으며, 장스팬 구조물에 대한 설치가 용이해졌습니다. 그 대표적인 사례가 64개의 노드가 설치된 골든게이트 브리지로, 교통 혼잡을 유발하지 않으면서 1kHz의 데이터를 수집하고 있습니다. 클라우드 기반 대시보드를 통해 엔지니어는 원격으로 센서의 성능을 검증할 수 있으므로, 현장 재방문이나 비계 설치 비용을 최소화하고 프로젝트 기간을 단축하고 있습니다.
스마트 시티 메가 프로젝트가 실시간 SHM 수요를 견인
유엔 인간정주계획(UN-Habitat)은 2050년까지 아시아태평양(APAC)의 도시 인구가 35억 명에 달할 것으로 예측하고 있으며, 이에 따라 지자체 당국은 교통 회랑, 터널, 공공 건축물에 SHM을 도입해야 하는 압박을 받고 있습니다. 아세안(ASEAN)에서는 108건의 스마트 시티 프로그램이 진행 중이며, 구조용 센서의 데이터 교환이 표준화되고 있습니다. 한편, 마카오와 홍콩의 5G 연합 에지 플랫폼에서는 기가바이트 규모의 동적 하중 데이터를 50밀리초 미만으로 스트리밍하고 있습니다. 현재 조달 프레임워크에서는 오픈 API가 필수 사항으로 지정되어 있으며, 균열 감지, 부식 매핑, 이상 현상 우선순위 지정을 위한 마이크로서비스 라이선싱을 스타트업 기업들에게 장려하고 있습니다.
원격 지역의 무선 링크에 대한 고액의 설비 투자
외딴 지역의 백홀 인프라가 미흡하여 도입 비용이 최대 45% 증가했으며, 도시 지역에서 ROI가 입증되었음에도 불구하고 이는 도입에 걸림돌이 되고 있습니다. 저궤도 위성 군집이 해결책이 될 것으로 기대되지만, 단말기 가격은 많은 지자체에게 여전히 감당하기 어려운 수준이어서 지방의 교량이나 파이프라인에 센서를 도입하는 것이 미뤄지고 있습니다.
부문 분석
무선 플랫폼은 2025년 매출 48억 8,000만 달러를 차지하며, 이는 인프라 모니터링 시장의 61.35%에 해당합니다. 메시 라우팅, 서브GHz 대역 무선, 에너지 수확 기술의 발전에 힘입어 무선 네트워크는 현재 5년의 배터리 수명을 실현하고 있으며, 유선 네트워크의 가동 시간 벤치마크에 필적하면서도 배관 및 도랑 파기 비용을 절감하고 있습니다. 무선 시스템을 활용한 인프라 모니터링 시장 규모는 북미 및 유럽의 공공 교량 개보수를 원동력으로 연평균 성장률(CAGR) 11.45%로 확대될 것으로 예측됩니다. 대조적으로, 유선 시스템은 결정론적 지연이 절대적인 조건인 원자력 발전소나 장대 스팬 터널에서 여전히 중요한 역할을 하고 있습니다.
클라우드 벤더들이 디지털 신호 처리 서비스를 도입함에 따라, 자산 관리자는 On-Premise 서버를 유지 관리할 필요 없이 진동 및 음향 알고리즘을 도입할 수 있게 됩니다. 무선 게이트웨이에 내장된 엣지 최적화 AI 칩은 현재 모드 분석을 로컬에서 실행하고, 원시 파형이 아닌 압축된 특징량을 전송함으로써 대역폭 비용을 70% 절감하고 있습니다. 이러한 변화로 인해 3G/4G 커버리지가 아직 불충분하지만 점차 확대되고 있는 신흥 경제국에서 새로운 비즈니스 기회가 열릴 것입니다.
2025년 매출에서 하드웨어가 차지하는 비중은 여전히 54.30%이지만, 서비스 부문은 연평균 성장률(CAGR) 12.44%로 다른 모든 카테고리를 능가하는 성장을 보일 것으로 예측됩니다. 소유주들이 데이터 엔지니어링, AI 모델 훈련, 대시보드 맞춤 설정을 토목 공학 노하우와 클라우드 네이티브 기술을 융합한 기업에 아웃소싱함에 따라, 인프라 모니터링 시장의 서비스 규모는 확대될 것입니다. 특히 라틴아메리카와 동남아시아에서는 엔지니어 부족으로 인해 사내 프로그램 개발이 지장을 받고 있어 수요가 특히 높아지고 있습니다.
소프트웨어 플랫폼은 지출의 나머지 18.35%를 차지하고 있지만, 통합과 관련된 과제는 여전히 남아 있습니다. 오픈소스 미들웨어 이니셔티브에서는 메시지 브로커 및 시맨틱 모델의 표준화가 추진되고 있지만, 벤더 종속 현상은 여전히 일반적입니다. 사이버 보안 강화 기능(제로 트러스트 액세스, 시큐어 부트, OTA 패치 적용)은 현재 기업 조달의 기본 요건이 되고 있습니다.
지역별 분석
북미는 2025년 매출의 29.40%를 차지하고 있으며, IIJA 자금을 통한 디지털 트윈 시범 사업과 건설된 지 50년 이상 된 교량의 개보수를 추진하는 정책에 힘입고 있습니다. 스마트 센서를 활용한 보수 공사를 통해 유지 관리 비용이 20% 절감된다는 사실이 입증됨에 따라, 주 정부 기관들은 포장 공사 계약에 센서 도입 예산을 반영하고 있습니다. 캐나다의 각 주에서는 연방 정부의 그린 인프라 보조금을 활용하여 외딴 지역의 목조 교량에서 엣지 AI를 이용한 균열 감지 시범 운영을 진행하고 있는 반면, 멕시코에서는 운영 개시 초기부터 상태 모니터링을 의무화하는 유료 도로 운영권 계약을 가속화하고 있습니다.
아시아태평양은 2031년까지 연평균 성장률(CAGR) 11.86%라는 가장 급격한 성장 궤도를 그리고 있습니다. 중국의 ‘제14차 5개년 계획’에서는 고속철도 고가교의 구조물 상태 모니터링(SHM)이 우선 과제로 지정되어 있으며, 일본의 ‘사회 5.0’ 목표에는 터널 유지 관리에 로봇 기술 도입이 포함되어 있습니다. 인도의 ‘스마트 시티 미션’은 수위계 및 교통 센서 데이터를 수집하는 통합 지휘 센터에 자금을 지원하고 있으며, 이는 아세안 전역의 중규모 도시들에게 모범 사례가 되고 있습니다. 호주 자산관리협의회는 해일 피해를 예측하기 위해 해안 방파제에 광섬유식 변형 센서를 도입하고 있으며, 이러한 노력은 현재 뉴질랜드와 태평양 도서 국가들로도 확산되고 있습니다.
유럽의 엄격한 규제로 인해 예측 유지보수의 의무화가 조기에 도입되었습니다. 북유럽 국가들에서는 도급업체가 지속적인 모니터링을 통해 가동 시간을 보장하는 ‘인프라-어즈-어-서비스(IaaS)’ 방식의 운영권 계약이 선구적으로 도입되었습니다. 네덜란드에서는 해수면 상승에 대응하기 위해 제방에 실시간 처짐 감지 기술을 적용하고 있는 반면, 독일에서는 아우토반 기초 아래의 지반 침하를 감지하기 위해 양자 중력 측정법의 시범 운영을 진행하고 있습니다. 남유럽에서는 팬데믹 회복 자금을 내진 보강에 충당하고, 가속도계 설치를 에너지 효율 개선 공사와 병행하고 있습니다.
기타 혜택:
- 엑셀 형식 시장 예측(ME) 시트
- 3개월간의 애널리스트 지원
자주 묻는 질문
목차
제1장 서론
제2장 조사 방법
제3장 주요 요약
제4장 시장 구도
제5장 시장 규모와 성장 예측
제6장 경쟁 구도
제7장 시장 기회와 향후 전망
JHS 26.09.07According to Mordor Intelligence, infrastructure monitoring market size in 2026 is estimated at USD 8.74 billion, growing from 2025 value of USD 7.95 billion with 2031 projections showing USD 14.05 billion, growing at 9.96% CAGR over 2026-2031.
This report is Segmented by Technology (Wired, Wireless), Offering (Hardware, Software, and Services), Deployment Model (On-Premise, Cloud), Application (corrosion Monitoring, Crack/Strain Detection, and More), End-User Industry (Civil Infrastructure, Energy, Aerospace and Defense, and More), and by Geography. The Market Forecasts are Provided in Terms of Value (USD).
Global Infrastructure Monitoring Market Trends and Insights
Accelerating Deployment of Wireless Sensor Networks in Aging Bridges (NA & EU)
Aging bridges-45% are more than 50 years old-are prompting asset owners to install wireless nodes that stream strain and vibration data continuously. Linear wireless sensor network designs have cut power consumption and eased installation on long-span structures, evidenced by the 64-node Golden Gate Bridge deployment collecting 1 kHz data without traffic disruption. Project timelines are shortening because cloud-based dashboards allow engineers to validate sensor performance remotely, minimizing field revisits and scaffolding costs.
Smart-City Megaprojects Fuel Real-Time SHM Demand
UN-Habitat forecasts APAC's urban population to reach 3.5 billion by 2050, pushing municipal authorities to embed SHM into transit corridors, tunnels, and public buildings. ASEAN's 108 active smart-city programs are standardizing data exchanges for structural sensors, while 5G federated edge platforms in Macau and Hong Kong stream gigabyte-scale dynamic-load data in under 50 milliseconds. Procurement frameworks now require open APIs, encouraging start-ups to license micro-services for crack detection, corrosion mapping, and anomaly triage.
High Capex for Remote-Area Wireless Links
Sparse backhaul in remote regions raises deployment costs by up to 45%, deterring adoption despite proven ROI in urban settings. While low-earth-orbit satellite constellations promise relief, terminals remain price-prohibitive for many municipalities, postponing sensor roll-outs on rural bridges and pipelines.
Other drivers and restraints analyzed in the detailed report include:
- EU & Japan Predictive-Maintenance Mandates for Dams/Tunnels
- US IIJA-Funded Digital-Twin Roll-outs
- Data-Governance & Cyber-Security Barriers in EU Public Assets
For complete list of drivers and restraints, kindly check the Table Of Contents.
Segment Analysis
Wireless platforms underpin USD 4.88 billion of 2025 revenue, equivalent to 61.35% of the infrastructure monitoring market. Supported by improvements in mesh routing, sub-GHz radios, and energy harvesting, wireless networks now achieve five-year battery life, matching wired uptime benchmarks while avoiding conduit and trenching expenses. The infrastructure monitoring market size for wireless systems is forecast to expand at 11.45% CAGR, driven by public bridge retrofits in North America and Europe. In contrast, the wired cohort retains relevance for nuclear plants and long-span tunnels where deterministic latency is non-negotiable.
As cloud vendors introduce digital-signal-processing services, asset managers can deploy vibration and acoustic algorithms without maintaining on-premise servers. Edge-optimized AI chips embedded in wireless gateways now execute modal analysis locally, transmitting compressed features rather than raw waveforms-cutting bandwidth costs by 70%. This shift unlocks green-field opportunities in emerging economies where 3G/4G coverage is patchy yet growing.
Hardware still represents 54.30% of 2025 revenue, but services are set to outpace all other categories with a 12.44% CAGR. The infrastructure monitoring market size for services will rise as owners outsource data engineering, AI model training, and dashboard customization to firms that blend civil-engineering know-how with cloud-native skills. Demand is especially acute in Latin America and Southeast Asia, where engineer shortages hamper in-house program development.
Software platforms account for the remaining 18.35% of spending, yet face persistent integration challenges. Open-source middleware initiatives seek to standardize message brokers and semantic models, but vendor lock-in remains common. Cyber-security hardening features-zero-trust access, secure boot, over-the-air patching-are now baseline requirements for enterprise procurement.
Complete Report Scope:
- By Technology
- Wired
- Wireless
- By Offering
- Hardware
- Software
- Services
- By Deployment Model
- On-premise
- Cloud / Edge
- By Application
- Corrosion Monitoring
- Crack / Strain Detection
- Vibration and Dynamic Load Monitoring
- Remote Structural-Health Monitoring (SHM)
- Environmental and Seismic Monitoring
- By End-user Industry
- Civil Infrastructure (Bridges, Roads, Tunnels, Dams)
- Energy and Utilities
- Aerospace and Defense
- Mining and Metals
- Oil and Gas / Petro-chemicals
- Transportation (Harbors, Rail, Airports)
- By Geography
- North America
- United States
- Canada
- Mexico
- South America
- Brazil
- Argentina
- Rest of South America
- APAC
- China
- Japan
- India
- South Korea
- ASEAN
- Rest of APAC
- Europe
- Germany
- United Kingdom
- France
- Italy
- Nordics
- Rest of Europe
- Middle East and Africa
- GCC
- Turkey
- Rest of Middle East and Africa
- North America
Geography Analysis
North America anchors 29.40% of 2025 revenue, supported by IIJA-funded digital-twin pilots and a policy push to rehabilitate bridges older than 50 years. Smart-sensor retrofits demonstrate 20% maintenance cost savings, prompting state agencies to incorporate sensing budgets into resurfacing contracts. Canadian provinces leverage federal green-infrastructure grants to trial edge-AI crack detection on remote timber bridges, while Mexico accelerates toll-road concessions that stipulate condition-based monitoring from day one.
Asia-Pacific delivers the steepest trajectory with a 11.86% CAGR through 2031. China's 14th Five-Year Plan prioritizes SHM on high-speed rail viaducts, and Japan's Society 5.0 target embeds robotics in tunnel maintenance. India's Smart Cities Mission funds integrated command centers that ingest flood gauges and traffic sensors, offering a blueprint for mid-tier cities across ASEAN. Australia's asset-management councils adopt fiber-optic strain lines on coastal seawalls to anticipate storm-surge damage, a practice now spreading to New Zealand and Pacific Island states.
Europe's regulatory rigor fosters early adoption of predictive-maintenance mandates. Nordic countries pioneer infrastructure-as-a-service concessions where contractors guarantee uptime using continuous monitoring. The Netherlands applies real-time deflection sensing on dykes to counter sea-level rise, while Germany pilots quantum gravimetry to detect subsidence beneath Autobahn foundations. Southern Europe channels pandemic-recovery funds into seismic retrofits, bundling accelerometers with energy-efficiency upgrades.
- Schneider Electric SE
- Pure Technologies Ltd. Company (Xylem Inc.)
- Structural Monitoring Systems plc
- Acellent Technologies Inc.
- National Instruments Corp.
- Campbell Scientific, Inc.
- Siemens AG
- Trimble Inc.
- HBM (Hottinger Bruel & Kjaer)
- Geocomp Corporation
- Geokon Inc.
- SISGEO SRL
- RST Instruments Ltd.
- Bridge Diagnostics Inc.
- Sixense Group
- Digitexx Data Systems Inc.
- AVT Reliability (AES Engineering)
- Honeywell International Inc.
- Civionics
- Topcon Positioning Systems
- Nova Metrix LLC
- Worldsensing
Additional Benefits:
- The market estimate (ME) sheet in Excel format
- 3 months of analyst support
TABLE OF CONTENTS
1 INTRODUCTION
- 1.1 Study Assumptions and Market Definition
- 1.2 Scope of the Study
2 RESEARCH METHODOLOGY
3 EXECUTIVE SUMMARY
4 MARKET LANDSCAPE
- 4.1 Market Overview
- 4.2 Market Drivers
- 4.2.1 Accelerating Deployment of Wireless Sensor Networks in Aging Bridges
- 4.2.2 Smart-City Megaprojects Fuel Real-Time SHM Demand
- 4.2.3 EU and Japan Predictive-Maintenance Mandates for Dams / Tunnels
- 4.2.4 US IIJA-Funded Digital-Twin Roll-outs
- 4.2.5 Cloud-First Monitoring Adoption by GCC EPC Majors
- 4.2.6 Falling MEMS Sensor Cost Enabling Secondary-Road Instrumentation
- 4.3 Market Restraints
- 4.3.1 High Capex for Remote-area Wireless Links
- 4.3.2 Data-Governance and Cyber-Security Barriers in EU Public Assets
- 4.3.3 Shortage of Structural-Data Scientists in Emerging Markets
- 4.3.4 Interoperability Gaps between Legacy Wired and IoT Sensors
- 4.4 Value / Supply-Chain Analysis
- 4.5 Regulatory Outlook
- 4.6 Porter's Five Forces
- 4.6.1 Threat of New Entrants
- 4.6.2 Bargaining Power of Buyers
- 4.6.3 Bargaining Power of Suppliers
- 4.6.4 Threat of Substitutes
- 4.6.5 Intensity of Competitive Rivalry
- 4.7 Impact of Covid-19 on the Market
5 MARKET SIZE AND GROWTH FORECASTS (VALUE)
- 5.1 By Technology
- 5.1.1 Wired
- 5.1.2 Wireless
- 5.2 By Offering
- 5.2.1 Hardware
- 5.2.2 Software
- 5.2.3 Services
- 5.3 By Deployment Model
- 5.3.1 On-premise
- 5.3.2 Cloud / Edge
- 5.4 By Application
- 5.4.1 Corrosion Monitoring
- 5.4.2 Crack / Strain Detection
- 5.4.3 Vibration and Dynamic Load Monitoring
- 5.4.4 Remote Structural-Health Monitoring (SHM)
- 5.4.5 Environmental and Seismic Monitoring
- 5.5 By End-user Industry
- 5.5.1 Civil Infrastructure (Bridges, Roads, Tunnels, Dams)
- 5.5.2 Energy and Utilities
- 5.5.3 Aerospace and Defense
- 5.5.4 Mining and Metals
- 5.5.5 Oil and Gas / Petro-chemicals
- 5.5.6 Transportation (Harbors, Rail, Airports)
- 5.6 By Geography
- 5.6.1 North America
- 5.6.1.1 United States
- 5.6.1.2 Canada
- 5.6.1.3 Mexico
- 5.6.2 South America
- 5.6.2.1 Brazil
- 5.6.2.2 Argentina
- 5.6.2.3 Rest of South America
- 5.6.3 APAC
- 5.6.3.1 China
- 5.6.3.2 Japan
- 5.6.3.3 India
- 5.6.3.4 South Korea
- 5.6.3.5 ASEAN
- 5.6.3.6 Rest of APAC
- 5.6.4 Europe
- 5.6.4.1 Germany
- 5.6.4.2 United Kingdom
- 5.6.4.3 France
- 5.6.4.4 Italy
- 5.6.4.5 Nordics
- 5.6.4.6 Rest of Europe
- 5.6.5 Middle East and Africa
- 5.6.5.1 GCC
- 5.6.5.2 Turkey
- 5.6.5.3 Rest of Middle East and Africa
- 5.6.1 North America
6 COMPETITIVE LANDSCAPE
- 6.1 Market Concentration
- 6.2 Strategic Moves
- 6.3 Market Share Analysis
- 6.4 Company Profiles (includes Global Level Overview, Market Level Overview, Core Segments, Financials as available, Strategic Information, Market Rank/Share, Products and Services, Recent Developments)
- 6.4.1 Schneider Electric SE
- 6.4.2 Pure Technologies Ltd. Company (Xylem Inc.)
- 6.4.3 Structural Monitoring Systems plc
- 6.4.4 Acellent Technologies Inc.
- 6.4.5 National Instruments Corp.
- 6.4.6 Campbell Scientific, Inc.
- 6.4.7 Siemens AG
- 6.4.8 Trimble Inc.
- 6.4.9 HBM (Hottinger Bruel & Kjaer)
- 6.4.10 Geocomp Corporation
- 6.4.11 Geokon Inc.
- 6.4.12 SISGEO SRL
- 6.4.13 RST Instruments Ltd.
- 6.4.14 Bridge Diagnostics Inc.
- 6.4.15 Sixense Group
- 6.4.16 Digitexx Data Systems Inc.
- 6.4.17 AVT Reliability (AES Engineering)
- 6.4.18 Honeywell International Inc.
- 6.4.19 Civionics
- 6.4.20 Topcon Positioning Systems
- 6.4.21 Nova Metrix LLC
- 6.4.22 Worldsensing
7 MARKET OPPORTUNITIES AND FUTURE OUTLOOK
- 7.1 White-space and Unmet-Need Assessment


