

|
시장보고서
상품코드
2154221
에너지 물류 : 시장 점유율 분석, 업계 동향과 통계, 성장 예측(2026-2031년)Energy Logistics - Market Share Analysis, Industry Trends & Statistics, Growth Forecasts (2026 - 2031) |
||||||
 Mordor Intelligence
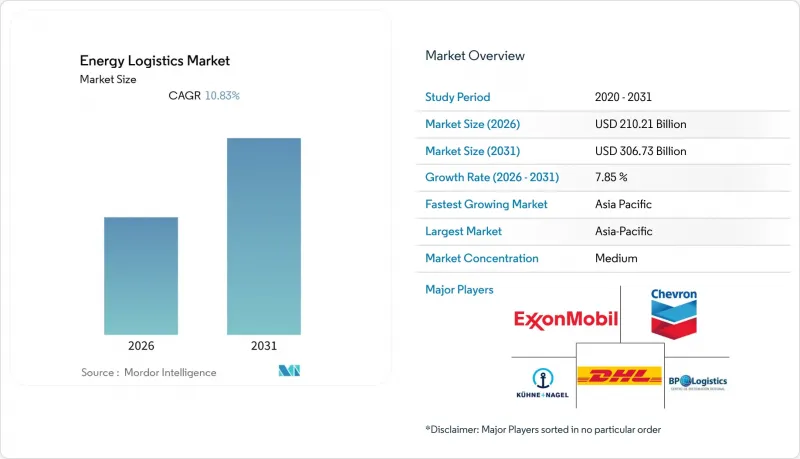
에 따르면 에너지 물류 시장 규모는 2025년에 1,930억 2,000만 달러로 평가되며, 2026년 2,102억 1,000만 달러에서 2031년까지 3,067억 3,000만 달러에 달할 것으로 추정되고 있으며, 2026-2031년까지 CAGR은 7.85%에 달할 전망입니다.
LNG, 석유 제품, 핵심 광물, 재생에너지 관련 장비의 국경 간 무역은 생산 지역과 소비 지역을 불문하고 화물 운송 계획의 양상을 지속적으로 변화시키고 있습니다. 이 보고서는 서비스별(운송, 창고·보관, 부가가치 서비스), 최종사용자별(석유 및 가스, 발전·유틸리티, 재생에너지, 광업·금속, EPC 도급업체, 정부·공공 인프라, 기타) 및 지역별(북미, 남미, 유럽, 아시아태평양, 중동 및 아프리카)로 분류되어 있습니다. 시장 전망은 금액(달러) 기준으로 제시되어 있습니다.
글로벌 에너지 물류 시장의 동향 및 인사이트
국경을 초월한 에너지 무역 및 에너지 안보에 대한 투자 확대
국경을 넘는 에너지 무역으로 인해 수출 시설 및 수입 인프라에서 지속적인 화물 운송 수요가 발생했습니다. 2025년 전 세계 LNG 무역은 6.7% 증가할 것이며, LNG 공급량은 2026년 말까지 7% 이상 확대될 것으로 예측됩니다. 2026년 공급 증가분의 85% 이상을 북미가 차지했습니다. 북미의 LNG 수출 능력은 2024년 초 하루 114억 입방피트에서 2029년까지 하루 287억 입방피트로 증가할 전망이었습니다. 2026년 상반기 LNG 수출량은 하루 평균 174억 입방피트로, 전년 대비 23% 증가했습니다. 새로운 수출 터미널에는 건설 자재가 필요했으며, 반면 수입 터미널에는 설비 조달, 운송 및 저장 능력이 필요했습니다. 미국 국제개발금융공사(USIDFC)와 I Squared Capital은 남아시아 및 동남아시아 전역의 LNG 및 석유 제품 수입, 저장, 운송 인프라를 위해 30억 달러 규모의 플랫폼을 출범한다고 발표했습니다.
재생에너지 및 배터리 프로젝트 분야의 물류 확대
재생에너지 설비 용량의 증가에 따라 에너지 물류 시장 전반에서 전문적인 운송, 저장 및 라스트 마일 배송에 대한 수요가 높아졌습니다. 2025-2030년에 재생에너지 설비 용량은 4,600기가와트 가까이 증가할 것으로 예측되며, 그 증가분의 80%를 태양광발전이 차지할 것으로 전망됩니다. 배터리 에너지 저장 시스템은 위험물 인증, 온도 관리, 그리고 송전망 가동 개시에 맞춘 배송이 필요했으므로 프로젝트 화물의 주요 범주가 되었습니다. DHL 그룹은 신에너지 물류 매출을 2025년 6억 5,000만 달러에서 2030년까지 33억 달러로 확대할 계획을 발표했습니다. 이에 따라 에너지 물류 시장에서는 공급업체에게 처리 능력과 화물 엔지니어링을 모두 갖추는 것이 요구되었습니다. 배터리 시스템은 이를 지지하는 태양광 모듈에 비해 무게가 더 나가고 복잡하여, 위험물로 취급해야 하는 작업을 발생시켰습니다. 초기 재생에너지 프로젝트의 예산에는 이러한 취급의 복잡성이 반드시 충분히 반영되지는 않았습니다.
분절된 인프라와 높은 모달 간 운송 비용
인프라의 단편화로 인해 외딴 지역의 시설이 여러 운송 수단에 의존해야 하는 경우, 실행 위험이 높아졌습니다. 접근 경로에는 항만, 도로, 보관 야드, 하천 경로 및 지역 배송 능력이 결합되는 경우가 많았으며, 그 신뢰성은 제각각이었습니다. 아프리카의 하류 유통망에서는 정부의 가격 보조금이 이익률을 압박하여 유통 인프라에 대한 민간 투자를 저해했습니다. 그 결과 발생한 격차는 프로젝트 개발에 물류 비용을 추가했으며, 네트워크가 더 많은 물량을 처리할 수 있는 능력을 제한했습니다. 항만, 선박, 중량물 운송 분야의 병목 현상 또한 아시아태평양, 유럽, 중동 및 아프리카의 재생에너지 프로젝트를 제약했습니다. 에너지 물류 시장에서 이러한 병목 현상은 초대형 부품의 운송을 지연시켜, 본래라면 확대되고 있었을 프로젝트 파이프라인의 가용 용량을 감소시켰습니다.
부문별 분석
2025년, 운송 부문은 에너지 물류 시장 점유율의 67.19%를 차지했습니다. 이러한 위상은 LNG 무역 및 분산형 재생에너지 프로젝트에 필요한 지속적인 운송 수요를 반영한 것입니다. 수송 부문은 항만, 야드, 생산 현장에서 원격지의 에너지 자산으로의 화물의 물리적 흐름을 다루었습니다. 창고 및 보관 부문은 배터리 프로젝트 및 LNG 수취 터미널과 병행하여 발전했습니다. 취급량이 증가함에 따라 임시 보관 장소 대신 영구적인 집적 시설이 점점 더 보편화되었습니다. 뉴캐슬 항구는 2025년 하반기, 메이필드 터미널내 그리드 규모의 배터리 시스템 임시 보관에 대해 주 정부의 승인을 받았습니다. 또한 이 항구는 더 대형 프로젝트 화물선을 수용하기 위해 부두 확장에 2,500만 달러를 투자했습니다. 이러한 자산들은 현장 배송에 앞서 보관, 집적 및 관리된 이송을 지원했습니다.
에너지 물류 시장에서 부가가치 서비스는 2026-2031년까지 10.37%라는 가장 높은 예측 연평균 성장률(CAGR)을 기록했습니다. 이 서비스군에는 통관 대행, NORM 폐기물 관리, 보건·안전·보안·환경·품질 규정 준수, 그리고 출하 가시화가 포함되었습니다. 에너지 사업자들은 운송 실행 외에도 규제 요건을 관리하기 위해 이러한 서비스를 활용했습니다. 통합형 계약에서는 운송, 임시 보관, 통관, 현장 납품이 단일 공급자에 의해 일원화되어 관리되었습니다. 이러한 구조는 프로젝트의 전체 범위를 조정할 수 있는 물류 기업에게 유리하게 작용했습니다. ASCO는 2025년 6월, 북해에서 9자리 규모의 서비스 계약을 수주하며, 확립된 에너지 업계의 거래 관계에서 장기 계약 모델이 채택되고 있음을 보여주었습니다. 에너지 물류 업계는 이러한 번들형 계약을 통해 혜택을 보고 있는데, 이는 개별 프로젝트 운송보다 더 높은 지속성을 제공했기 때문입니다. 재생에너지 분야의 계약에서는 여전히 이 수준의 지속적인 서비스 수익을 대규모로 재현하지 못하고 있었습니다.
지역별 분석
2025년, 아시아태평양은 매출의 42.54%를 차지했으며, 2026-2031년까지는 9.61%라는 가장 높은 예측 연평균 성장률(CAGR)을 기록했습니다. LNG 수입 프로젝트, 재생에너지 개발, 국경을 초월한 에너지 협력을 통해 해당 지역 전체의 화물 운송 활동이 증가했습니다. 임펙스는 2026년 7월, 인도네시아에서 210억 달러 규모의 아바디 LNG 프로젝트를 착수했습니다. 2026년 7월에 발표된 호주의 ‘국가 재생에너지 우선 리스트’에는 4GWh를 초과하는 배터리 저장 시설을 포함한 11건의 프로젝트가 추가되었습니다. 예측 기간 중 아시아태평양은 전 세계 인프라 투자의 52.4% 이상을 차지할 것으로 추정되며, 유틸리티 규모의 저장 투자는 300% 증가할 것으로 전망됩니다. 중국, 인도, 일본, 한국은 터미널 운영 및 재생에너지 프로젝트를 통해 수요를 지원했습니다.
북미에서는 LNG 수출 능력, 파이프라인, 항만 및 전용 운반선의 수송 능력이 확대되면서 에너지 물류에 큰 변화가 일어났습니다. 2026년 상반기 미국의 LNG 수출량은 하루 평균 174억 입방피트로, 전년 동기 대비 23% 증가했습니다. 셰니에르사는 2025년 6월 추가 트레인에 대한 최종 투자 결정을 내렸으며, 2028년까지 연간 6,000만 톤 이상의 생산 능력 달성을 목표로 하고 있습니다. 남미 역시 브라질의 해양 개발, 아르헨티나의 바카 무에르타 개발, 가이아나의 생산 거점을 통해 성장 지역으로 발전했습니다. ASCO사와 N.V. Dordt Gateway사는 2026년 6월, 550미터 길이의 부두를 갖춘 수리남의 해양 지원 거점 사업에 관한 기본 합의서에 서명했습니다. 이 자산은 가이아나-수리남 분지의 해양 물류 수요를 목표로 하고 있었습니다.
2026년, 유럽에서는 탄화수소, 수소, 해상 풍력, 그리고 탄소 포집과 관련하여 각각 상이한 물류 수요가 발생하고 있었습니다. ‘유럽 수소 백본(European Hydrogen Backbone)’에는 33개의 에너지 인프라 사업자가 참여하고 있으며, 2030년까지 가동을 시작할 예정인 총 길이 31,500킬로미터의 수소 파이프라인을 포함한 40개의 파이프라인 프로젝트가 선정되었습니다. 암스테르담과 뒤스부르크를 경유한 독일로의 수소 수입은 기술적으로 실현 가능하며, 내륙 수로, 철도, 트럭 및 향후 건설될 파이프라인이 물류 계획에 포함되었습니다. 중동 및 아프리카에서는 호르무즈 해협의 위기로 인해 전 세계 LNG 공급량의 20%(전 세계 가스 공급 총량의 3%에 해당)가 제약을 받았기 때문에 다른 위험 요인이 존재했습니다. 이 지역의 에너지 물류 시장에서는 경로의 다각화와 신뢰할 수 있는 해상·육상 운송 능력 및 저장 능력이 특히 중시되었습니다.
기타 혜택:
- 엑셀 형식의 시장 예측(ME) 시트
- 3개월간의 애널리스트 지원
자주 묻는 질문
목차
제1장 서론
- 조사 전제조건과 시장 정의
- 조사 범위
제2장 조사 방법
제3장 개요
제4장 시장 구도
- 시장 개요
- 시장 성장 촉진요인
- 시장 성장 억제요인
- 밸류·공급망 분석
- 규제 상황
- 기술 전망
- Porter's Five Forces 분석
- 지정학적 이벤트가 시장에 미치는 영향
제5장 시장 규모와 성장 예측
- 서비스별
- 최종사용자별
- 지역별
- 북미
- 미국
- 캐나다
- 멕시코
- 남미
- 브라질
- 아르헨티나
- 페루
- 칠레
- 기타 남미 국가
- 유럽
- 독일
- 영국
- 프랑스
- 이탈리아
- 스페인
- 러시아
- 북유럽 국가(덴마크, 핀란드, 아이슬랜드, 노르웨이, 스웨덴)
- 기타 유럽 국가
- 아시아태평양
- 중국
- 인도
- 일본
- 한국
- 호주
- 동남아시아(ASEAN)
- 기타 아시아태평양 국가
- 중동 및 아프리카
- 사우디아라비아
- 아랍에미리트
- 카타르
- 남아프리카공화국
- 나이지리아
- 이집트
- 기타 중동 및 아프리카 국가
- 북미
제6장 경쟁 구도
- 시장 집중도
- 주요 전략적 동향
- 시장 점유율 분석
- 기업 개요
- DHL Group
- Kuehne+Nagel
- A.P. Moller-Maersk A/S
- DSV A/S
- C.H. Robinson Worldwide, Inc.
- Expeditors International of Washington, Inc.
- CMA CGM Group(Including CEVA Logistics)
- GEODIS
- Rhenus Group
- Hellmann Worldwide Logistics
- NYK Line(Including Yusen Logistics Co., Ltd.)
- ASCO Group
- Peterson Energy Logistics
- ADNOC Logistics and Services plc
- Gulf Agency Company(GAC)
- Mammoet Group
- DP World
- deugro Group
- Fracht FWO, Inc.
- The Bertling Group
제7장 시장 기회와 향후 전망
KSA 26.10.23According to Mordor Intelligence, the energy logistics market size was valued at USD 193.02 billion in 2025, and is estimated to grow from USD 210.21 billion in 2026 to reach USD 306.73 billion by 2031, registering a CAGR of 7.85% between 2026 and 2031.
Cross-border trade in LNG, petroleum products, critical minerals, and renewable equipment continued to reshape freight planning across producing and consuming regions. This report is Segmented by Service (Transportation, Warehousing and Storage, Value-Added Services), by End-User (Oil and Gas, Power Generation and Utilities, Renewable Energy, Mining and Metals, EPC Contractors, Government and Public Infrastructure, Others), and by Geography (North America, South America, Europe, Asia-Pacific, Middle East and Africa). The Market Forecasts are Provided in Terms of Value (USD).
Global Energy Logistics Market Trends and Insights
Growth in Cross-Border Energy Trade and Energy-Security Investment
Cross-border energy trade created sustained freight requirements at export facilities and receiving infrastructure. Global LNG trade grew 6.7% in 2025, while LNG supply is forecast to expand by more than 7% by the end of 2026. North America accounted for more than 85% of incremental supply growth during 2026. North American LNG export capacity was on track to rise from 11.4 billion cubic feet per day at the start of 2024 to 28.7 billion cubic feet per day by 2029. LNG exports averaged 17.4 billion cubic feet per day in the first half of 2026, up 23% from the prior year. New export terminals required construction cargo, while import terminals required equipment procurement, transport, and storage capacity. The United States International Development Finance Corporation and I Squared Capital announced a USD 3 billion platform for LNG and petroleum products import, storage, and transport infrastructure across South and Southeast Asia.
Renewable Energy and Battery Storage Project Logistics Expansion
Renewable capacity additions increased demand for specialized transport, storage, and final-mile delivery across the energy logistics market. Renewable power capacity is projected to increase by nearly 4,600 GW between 2025 and 2030, with solar PV representing 80% of the expansion. Battery energy storage systems became a core project-cargo category because they needed hazardous-goods certification, thermal controls, and delivery timed to grid commissioning. DHL Group announced that it planned to expand New Energy logistics revenue from USD 650 million in 2025 to USD 3.3 billion by 2030. The energy logistics market, therefore, required providers to combine throughput capacity with cargo engineering. Battery systems created heavier-lift and more complex, dangerous-goods work than the solar modules they supported. Early renewable project budgets did not always fully reflect that handling complexity.
Fragmented Infrastructure and High Intermodal Transfer Costs
Fragmented infrastructure raised execution risk where remote facilities depended on several transport modes. Access routes often combined ports, roads, storage yards, river links, and local delivery capacity with uneven reliability. In African downstream networks, government price subsidies reduced margins and discouraged private investment in distribution infrastructure. The resulting gaps added logistics costs to project development and limited the ability of networks to handle greater volumes. Port, vessel, and heavy-lift bottlenecks also constrained renewable projects in Asia-Pacific, Europe, the Middle East, and Africa. In the energy logistics market, these bottlenecks delayed the movement of oversized components and reduced the usable capacity of otherwise growing project pipelines.
Other drivers and restraints analyzed in the detailed report include:
- Digital Tracking, Control Towers, and Logistics Automation
- Multimodal Infrastructure and Energy Project Development
- Complex Safety, Customs, and Environmental Compliance
For complete list of drivers and restraints, kindly check the Table Of Contents.
Segment Analysis
Transportation held 67.19% of the energy logistics market share in 2025. Its position reflected the continuous movement required by LNG trade and distributed renewable projects. Transportation covered the physical flow of cargo from ports, yards, and production sites to remote energy assets. Warehousing and storage developed alongside battery projects and LNG receiving terminals. Permanent staging facilities increasingly replaced temporary laydown areas as volumes increased. Port of Newcastle received state approval in late 2025 to stage grid-scale battery systems at its Mayfield Terminal. The port also invested USD 25 million in a berth extension for larger project-cargo vessels. These assets supported storage, consolidation, and controlled transfer before site delivery.
Value-added services recorded the highest forecast CAGR of 10.37% from 2026 to 2031 in the energy logistics market. This service group included customs brokerage, NORM waste management, health, safety, security, environment, and quality compliance, and shipment visibility. Energy operators used these services to manage regulatory requirements alongside transport execution. Integrated contracts placed transportation, staging, customs, and site delivery under one provider. This structure favored logistics companies that could coordinate the full project scope. ASCO secured a nine-figure North Sea services contract in June 2025, showing the long-duration model used in established energy relationships. The energy logistics industry benefited from such bundled contracts because they provided greater continuity than stand-alone project moves. Renewable contracts still had not replicated that level of recurring service revenue at scale.
Complete Report Scope:
- By Service
- Transportation
- Road
- Rail
- Air
- Sea and Inland Waterways
- Warehousing and Storage
- Value-added Services
- Transportation
- By End-User
- Oil and Gas
- Power Generation and Utilities
- Renewable Energy
- Mining and Metals
- EPC Contractors and Energy Equipment Manufacturers
- Government and Public Infrastructure
- Others
- By Geography
- North America
- United States
- Canada
- Mexico
- South America
- Brazil
- Argentina
- Peru
- Chile
- Rest of South America
- Europe
- Germany
- United Kingdom
- France
- Italy
- Spain
- Russia
- Nordics (Denmark, Finland, Iceland, Norway, and Sweden)
- Rest of Europe
- Asia-Pacific
- China
- India
- Japan
- South Korea
- Australia
- Southeast Asia (ASEAN)
- Rest of Asia-Pacific
- Middle East and Africa
- Saudi Arabia
- United Arab Emirates
- Qatar
- South Africa
- Nigeria
- Egypt
- Rest of Middle East and Africa
- North America
Geography Analysis
Asia-Pacific held 42.54% of revenue in 2025 and recorded the highest forecast CAGR of 9.61% from 2026 to 2031. LNG import projects, renewable developments, and cross-border energy links increased freight activity across the region. Inpex began work on the USD 21 billion Abadi LNG project in Indonesia in July 2026. Australia's July 2026 National Renewable Energy Priority List added 11 projects, including more than 4 GWh of battery storage. Asia-Pacific was estimated to account for more than 52.4% of global infrastructure investment through the forecast period, while utility-scale storage investment was projected to grow 300%. China, India, Japan, and South Korea supported demand through terminal operations and renewable project work.
North America underwent a major energy logistics transformation as LNG export capacity, pipelines, ports, and specialized carrier capacity expanded. United States LNG exports averaged 17.4 billion cubic feet per day during the first half of 2026, up 23% year-over-year. Cheniere took final investment decisions on additional trains in June 2025 and targeted a capacity of more than 60 million tonnes per annum by 2028. South America also developed as a growth area through Brazil's offshore expansion, Argentina's Vaca Muerta development, and Guyana's production base. ASCO and N.V. Dordt Gateway signed heads of terms in June 2026 for a Suriname marine-support-base venture with a 550-meter quay. The asset targeted offshore logistics demand in the Guyana-Suriname Basin.
Europe had separate logistics needs for hydrocarbons, hydrogen, offshore wind, and carbon capture during 2026. The European Hydrogen Backbone included 33 energy infrastructure operators and identified 40 pipeline projects with 31,500 kilometers of hydrogen pipelines planned for commissioning before 2030. Hydrogen imports into Germany through Amsterdam and Duisburg were technically feasible, with inland waterways, rail, trucks, and future pipelines included in the logistics design. Middle East and Africa carried a different set of risks because the Hormuz crisis constrained 20% of global LNG supply, equal to 3% of total global gas supply. The energy logistics market in these regions placed a premium on route diversification and reliable marine, road, and storage capacity.
- DHL Group
- Kuehne+Nagel
- A.P. Moller - Maersk A/S
- DSV A/S
- C.H. Robinson Worldwide, Inc.
- Expeditors International of Washington, Inc.
- CMA CGM Group (Including CEVA Logistics)
- GEODIS
- Rhenus Group
- Hellmann Worldwide Logistics
- NYK Line (Including Yusen Logistics Co., Ltd.)
- ASCO Group
- Peterson Energy Logistics
- ADNOC Logistics and Services plc
- Gulf Agency Company (GAC)
- Mammoet Group
- DP World
- deugro Group
- Fracht FWO, Inc.
- The Bertling Group
Additional Benefits:
- The market estimate (ME) sheet in Excel format
- 3 months of analyst support
TABLE OF CONTENTS
1 Introduction
- 1.1 Study Assumptions and Market Definition
- 1.2 Scope of the Study
2 Research Methodology
3 Executive Summary
4 Market Landscape
- 4.1 Market Overview
- 4.2 Market Drivers
- 4.2.1 Growth in Cross-Border Energy Trade and Energy-Security Investment
- 4.2.2 Renewable-Energy and Battery-Storage Project Logistics Expansion
- 4.2.3 Digital Tracking, Control Towers, and Logistics Automation
- 4.2.4 Multimodal Infrastructure and Energy-Project Development
- 4.2.5 Remote-Site and Offshore Supply-Chain Criticality
- 4.2.6 Specialized Logistics for Oversized, Hazardous, and Time-Critical Cargo
- 4.3 Market Restraints
- 4.3.1 Fragmented Infrastructure and High Intermodal Transfer Costs
- 4.3.2 Complex Safety, Customs, and Environmental Compliance
- 4.3.3 Port, Vessel, and Heavy-Lift Bottlenecks for Renewable Projects
- 4.3.4 Low Visibility of Scope-3 Emissions and Inconsistent Data Standards
- 4.4 Value / Supply-Chain Analysis
- 4.5 Regulatory Landscape
- 4.6 Technological Outlook
- 4.7 Porter's Five Forces Analysis
- 4.7.1 Bargaining Power of Suppliers
- 4.7.2 Bargaining Power of Buyers
- 4.7.3 Threat of New Entrants
- 4.7.4 Threat of Substitutes
- 4.7.5 Industry Rivalry
- 4.8 Impact of Geopolitical Events on the Market
5 Market Size and Growth Forecasts (Value in USD)
- 5.1 By Service
- 5.1.1 Transportation
- 5.1.1.1 Road
- 5.1.1.2 Rail
- 5.1.1.3 Air
- 5.1.1.4 Sea and Inland Waterways
- 5.1.2 Warehousing and Storage
- 5.1.3 Value-added Services
- 5.1.1 Transportation
- 5.2 By End-User
- 5.2.1 Oil and Gas
- 5.2.2 Power Generation and Utilities
- 5.2.3 Renewable Energy
- 5.2.4 Mining and Metals
- 5.2.5 EPC Contractors and Energy Equipment Manufacturers
- 5.2.6 Government and Public Infrastructure
- 5.2.7 Others
- 5.3 By Geography
- 5.3.1 North America
- 5.3.1.1 United States
- 5.3.1.2 Canada
- 5.3.1.3 Mexico
- 5.3.2 South America
- 5.3.2.1 Brazil
- 5.3.2.2 Argentina
- 5.3.2.3 Peru
- 5.3.2.4 Chile
- 5.3.2.5 Rest of South America
- 5.3.3 Europe
- 5.3.3.1 Germany
- 5.3.3.2 United Kingdom
- 5.3.3.3 France
- 5.3.3.4 Italy
- 5.3.3.5 Spain
- 5.3.3.6 Russia
- 5.3.3.7 Nordics (Denmark, Finland, Iceland, Norway, and Sweden)
- 5.3.3.8 Rest of Europe
- 5.3.4 Asia-Pacific
- 5.3.4.1 China
- 5.3.4.2 India
- 5.3.4.3 Japan
- 5.3.4.4 South Korea
- 5.3.4.5 Australia
- 5.3.4.6 Southeast Asia (ASEAN)
- 5.3.4.7 Rest of Asia-Pacific
- 5.3.5 Middle East and Africa
- 5.3.5.1 Saudi Arabia
- 5.3.5.2 United Arab Emirates
- 5.3.5.3 Qatar
- 5.3.5.4 South Africa
- 5.3.5.5 Nigeria
- 5.3.5.6 Egypt
- 5.3.5.7 Rest of Middle East and Africa
- 5.3.1 North America
6 Competitive Landscape
- 6.1 Market Concentration
- 6.2 Key Strategic Moves
- 6.3 Market Share Analysis
- 6.4 Company Profiles (includes Global Level Overview, Market Level Overview, Core Segments, Financials as available, Strategic Information, Geographic Coverage, Products and Services, Recent Developments)
- 6.4.1 DHL Group
- 6.4.2 Kuehne+Nagel
- 6.4.3 A.P. Moller - Maersk A/S
- 6.4.4 DSV A/S
- 6.4.5 C.H. Robinson Worldwide, Inc.
- 6.4.6 Expeditors International of Washington, Inc.
- 6.4.7 CMA CGM Group (Including CEVA Logistics)
- 6.4.8 GEODIS
- 6.4.9 Rhenus Group
- 6.4.10 Hellmann Worldwide Logistics
- 6.4.11 NYK Line (Including Yusen Logistics Co., Ltd.)
- 6.4.12 ASCO Group
- 6.4.13 Peterson Energy Logistics
- 6.4.14 ADNOC Logistics and Services plc
- 6.4.15 Gulf Agency Company (GAC)
- 6.4.16 Mammoet Group
- 6.4.17 DP World
- 6.4.18 deugro Group
- 6.4.19 Fracht FWO, Inc.
- 6.4.20 The Bertling Group
7 Market Opportunities and Future Outlook
- 7.1 White-Space and Unmet-Need Assessment


