

|
시장보고서
상품코드
2154367
화학발광 이미징 : 시장 점유율 분석, 업계 동향과 통계, 성장 예측(2026-2031년)Chemiluminescence Imaging - Market Share Analysis, Industry Trends & Statistics, Growth Forecasts (2026 - 2031) |
||||||
 Mordor Intelligence
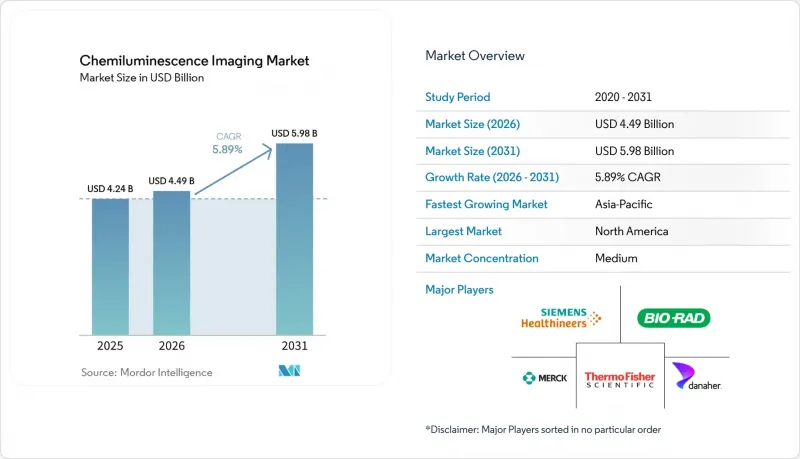
에 따르면 화학발광 이미징 시장 규모는 2025년 42억 4,000만 달러, 2026년 44억 9,000만 달러에서 2031년까지 59억 8,000만 달러로 확대할 것으로 예측되고 있으며, 2026-2031년까지 연평균 성장률(CAGR)은 5.89%에 달할 전망입니다.
전 세계 화학 발광 이미징 시장의 동향 및 인사이트
카메라를 활용한 정량 웨스턴 블로팅의 확대
X선 필름에서 과학용 디지털 카메라를 이용한 검출로의 전환은 여전히 화학 발광 이미징 시장의 주요 촉진요인으로 작용하고 있습니다. 신흥 경제국의 소규모 학술연구소나 시설에서는 이러한 전환이 아직 완료되지 않았습니다. 과학용 CMOS 센서는 75%를 초과하는 피크 양자 효율과 65,536단계의 그레이 레벨을 제공하여 일관된 정량적 단백질 분석을 지원합니다. 또한 디지털 촬영을 통해 타임스탬프, 감사 추적 기록 및 실험실 정보 관리 시스템(LIMS) 데이터도 보존됩니다.
이러한 기능들은 데이터 무결성 유지가 요구되는 제약 업계의 품질관리를 지원합니다. 규정 준수 요건이 엄격해짐에 따라 규제 대상 환경에서 고성능 장비에 대한 수요가 증가하고 있습니다. 디지털 워크플로우를 통해 노출 조건의 일관된 비교, 전자 기록의 보존 및 수작업에 의한 문서 작성의 감축이 가능해집니다. 실험실이 기존의 프로세스를 고감도 검출 및 추적 가능한 기록을 제공하는 검증된 디지털 워크플로우로 대체함으로써 시장은 그 혜택을 누리고 있습니다.
단백질 연구에서 고감도 ECL 워크플로우의 지속적인 활용
ECL 기반 웨스턴 블로팅은 연구 워크플로우에서 저발현 단백질의 검출에 여전히 널리 활용되고 있습니다. 이 기법은 최적화된 기질 조건 하에서 HRP 촉매에 의한 루미놀 산화를 통해 고감도 검출을 실현합니다. 바이오의약품 프로그램에서는 치료용 항체 및 관련 단백질의 반복적인 특성 평가가 필요하며, 개발 및 품질관리 활동에서 검증된 검출 기법의 사용이 요구됩니다. 화학발광 이미징 시장은 지속적인 시험 수요와 밀접하게 연결되어 있습니다. 연구실에서는 확립된 검출 방법을 변경할 때 막대한 재검증 요건에 직면하게 되므로, ECL 워크플로우의 역할은 여전히 유지되고 있습니다. 또한 기질의 지속적인 사용은 장비 도입 후 소모품 매출을 지원하며, 대체 검출 플랫폼으로의 전환을 억제하는 요인이 되고 있습니다.
다중 형광법 및 자동 모세관 웨스턴 블롯 플랫폼을 통한 대체
근적외선 형광 시스템은 화학 발광에서 일반적으로 관찰되는 2-3자릿수의 동적 범위에 비해 4-5자릿수의 동적 범위를 제공합니다. 이는 스트립이나 재프로빙 없이도 막 위의 2-4개 단백질 표적을 검출할 수 있으며, 실험실에서 다중 분석에 중점을 둔 실험을 위한 대안을 제공합니다. 자동 모세관 웨스턴 블롯 시스템은 막 전사 및 블로팅 공정을 생략하고 90분 이내에 분석을 완료하므로, 고처리량 의약품 스크리닝을 지원합니다. 이러한 대체 기술로 인해 화학 발광 이미징 시장의 고가대 기존 시스템에 대한 수요가 억제되고 있습니다. 특히 4만 달러를 초과하는 가격대의 시스템에 대한 압박이 가장 심한데, 이 가격대에서는 연구소가 더 폭넓은 기능을 요구하기 위해 설비 투자 예산을 확보하고 있기 때문입니다. 중견 학술기관이나 정부 산하 연구소의 경우 예산이 제한적인 경우가 많아, ECL(전기화학 발광) 기반의 화학 발광법이 더 이용하기 쉬운 선택지가 되고 있습니다.
부문 분석
2025년, 화학 발광 이미징 시스템은 매출의 68.40%를 차지할 것으로 예상되며, 이는 연구소에 도입된 장비의 자산 가치를 반영합니다. 서비스 계약, 검증된 표준 운영 절차(SOP), 그리고 운영자 교육을 통해 이러한 시스템의 상업적 수명이 연장됩니다. 가동중인 플랫폼의 경우, 운영 기간 중 호환 가능한 기판과 시약이 필요하므로 소모품 및 시약 시장은 2026-2031년까지 연평균 성장률(CAGR) 7.90%로 성장할 것으로 예측됩니다. 이를 통해 초기 장비 구매를 넘어 지속적인 수익이 창출됩니다.
도입된 장비는 장비 공급업체와 연구소 간의 장기적인 관계를 강화합니다. 시약 선정은 대개 검증된 프로토콜이나 시스템의 성능 요구 사항과 관련이 있는 반면, 연결형 플랫폼은 액세서리 및 소프트웨어에 대한 수요를 높입니다. 전자 감사 추적, 사용자 접근 제어 및 전자 서명은 규제된 조달 요건을 지원합니다. 시스템 도입 후, 수익 구성은 소모품, 소프트웨어 라이선스 및 규정 준수에 중점을 둔 업그레이드로 전환될 가능성이 있습니다.
지역별 분석
2025년, 북미는 바이오의약품에 대한 투자, 학술연구 및 임상 실험실에서의 응용을 배경으로 화학 발광 이미징 시장의 39.44% 점유율을 차지했습니다. 미국은 지역 수요의 대부분을 차지하고 있으며, FDA의 21 CFR Part 11 요건으로 인해 전자 기록 및 감사 추적을 갖춘 시스템에 대한 수요가 증가했습니다. 2026년 5월, 지멘스 헬스인어즈는 자사의 면역 분석법 ‘Atellica IM Testosterone II’가 총 테스토스테론에 대해 CDC 호르몬 표준화 프로그램의 인증을 획득했다고 발표했습니다. 캐나다는 학술연구 및 정부 자금 지원 조사를 통해 기여했으며, 멕시코는 제약 제조에 대한 투자 확대에 따라 시장을 확장했습니다.
유럽은 화학 발광 이미징 시장에서 지역별 두 번째로 큰 기여를 했으며, 독일, 영국, 프랑스의 확립된 제약 및 생의학 연구 시스템이 주도적인 역할을 했습니다. EU의 체외진단 의료기기 규정(In Vitro Diagnostic Regulation)은 병원내 새로운 면역측정 플랫폼 도입 일정에 영향을 미쳤습니다. 2025년 8월, Revvity사의 Euroimmun 사업부는 CE 마크를 획득하고 FDA에 등록된 플랫폼 ‘IDS i20’을 출시했습니다. 이 플랫폼은 6개 진단 전문 분야에 걸친 20가지 분석 항목을 시간당 140건의 검사 속도로 처리할 수 있습니다. 남미에서는 브라질이 수요를 주도했으며, 중동 및 아프리카에서는 GCC(걸프협력회의) 회원국 병원 네트워크에 수요가 집중되었습니다. 개발도상 지역의 70%를 넘는 수입 의존도로 인해 공급의 신뢰성과 환율 조정 후 가격 책정이 조달시 중요한 고려 사항이 되었습니다.
아시아태평양은 2026-2031년까지 연평균 성장률(CAGR) 11.88%로 성장할 것으로 예상되며, 이는 화학 발광 이미징 시장에서 가장 높은 성장률입니다. 정부 주도의 단백질체학 관련 지출, 바이오의약품 제조 확대, 그리고 임상 진단에 대한 투자가 수요를 지원하고 있습니다. 중국에서는 정밀 의료 및 생명공학 프로그램을 통해 연구 인프라가 강화되고 있는 한편, Tanon Science &Technology사는 중급형 영상 시스템 시장에서 경쟁력을 발휘하고 있습니다. 인도에서는 생명공학부 및 과학기술부의 자금 지원 프로그램을 통해 검사 장비 조달이 확대되고 있으며, 일본, 한국, 호주, 싱가포르, 말레이시아는 연구, 진단, 바이오의약품 제조에 대한 투자를 통해 시장에 기여하고 있습니다.
기타 혜택:
- 엑셀 형식의 시장 예측(ME) 시트
- 3개월간의 애널리스트 지원
자주 묻는 질문
목차
제1장 서론
- 조사 전제조건과 시장 정의
- 조사 범위
제2장 조사 방법
제3장 개요
제4장 시장 구도
- 시장 개요
- 시장 성장 촉진요인
- 시장 성장 억제요인
- 밸류·공급망 분석
- 규제 상황
- 기술 전망
- Porter's Five Forces 분석
제5장 시장 규모와 성장 예측
- 제품 유형별
- 용도별
- 최종사용자별
- 지역별
- 북미
- 미국
- 캐나다
- 멕시코
- 유럽
- 독일
- 영국
- 프랑스
- 이탈리아
- 스페인
- 기타 유럽 국가
- 아시아태평양
- 중국
- 인도
- 일본
- 호주
- 한국
- 기타 아시아태평양 국가
- 중동 및 아프리카
- GCC
- 남아프리카공화국
- 기타 중동 및 아프리카 국가
- 남미
- 브라질
- 아르헨티나
- 기타 남미 국가
- 북미
제6장 경쟁 구도
- 시장 집중도
- 시장 점유율 분석
- 기업 개요
- Analytik Jena GmbH+Co. KG
- ATTO Corporation
- Azure Biosystems, Inc.
- Berthold Technologies GmbH & Co. KG
- Bio-Rad Laboratories, Inc.
- Bio-Techne Corporation
- Cleaver Scientific Ltd
- Danaher Corporation
- DiaSorin S.p.A.
- LI-COR, Inc.
- Merck KGaA
- Pop-Bio Ltd
- Revvity, Inc.
- Siemens Healthineers AG
- Syngene International Limited
- Tanon Science & Technology Co., Ltd.
- Tecan Group Ltd.
- Thermo Fisher Scientific Inc.
- UVITEC Limited
- Vilber GmbH
제7장 시장 기회와 향후 전망
KSA 26.10.23According to Mordor Intelligence, the chemiluminescence imaging market size is projected to expand from USD 4.24 billion in 2025 and USD 4.49 billion in 2026 to USD 5.98 billion by 2031, registering a CAGR of 5.89% between 2026 to 2031.
Global Chemiluminescence Imaging Market Trends and Insights
Expansion of Quantitative Camera-Based Western Blotting
The shift from X-ray film to scientific-grade digital camera detection remains a key driver of the chemiluminescence imaging market. Smaller academic laboratories and facilities in emerging economies have not completed this transition. Scientific CMOS sensors provide more than 75% peak quantum efficiency and 65,536 gray levels, supporting consistent quantitative protein analysis. Digital capture also retains timestamps, audit trails, and laboratory information management system data.
These capabilities support pharmaceutical quality control, where laboratories must maintain data integrity. Higher compliance requirements drive demand for premium instruments in regulated settings. Digital workflows enable consistent exposure comparison, electronic record retention, and reduced manual documentation. The market benefits as laboratories replace legacy processes with validated digital workflows that provide sensitive detection and traceable records.
Continued Use of High-Sensitivity ECL Workflows in Protein Research
ECL-based western blotting remains widely used to detect low-abundance proteins in research workflows. The method supports sensitive detection through HRP-catalyzed luminol oxidation under optimized substrate conditions. Biologics programs require repeated characterization of therapeutic antibodies and related proteins, supporting the use of validated detection methods in development and quality-control activities. The chemiluminescence imaging market remains linked to recurring testing demand. Laboratories face substantial revalidation requirements when changing established detection methods, which preserves the role of ECL workflows. Recurring substrate use also supports consumables revenue after instrument installation and limits the transition to alternative detection platforms.
Substitution by Multiplex Fluorescence and Automated Capillary Western Platforms
Near-infrared fluorescence systems offer a 4-5 order-of-magnitude dynamic range, compared with the 2-3 order range commonly associated with chemiluminescence. They detect 2-4 protein targets on a membrane without stripping and reprobing, providing laboratories with an alternative for multiplexing-focused experiments. Automated capillary western systems eliminate membrane transfer and blotting steps and complete assays in under 90 minutes, supporting high-throughput pharmaceutical screening. These alternatives constrain demand for conventional systems at the premium end of the chemiluminescence imaging market. Pressure is strongest for systems priced above USD 40,000, where laboratories have capital budgets for broader functionality. Mid-tier academic and government laboratories often have more limited budgets, making ECL-based chemiluminescence a more accessible option.
Other drivers and restraints analyzed in the detailed report include:
- Demand for Multipurpose Gel, Blot, and Luminescence Imaging Platforms
- Cloud-Connected and Automated Image Analysis Adoption
- Reproducibility and Dynamic-Range Limitations in Chemiluminescent Quantification
For complete list of drivers and restraints, kindly check the Table Of Contents.
Segment Analysis
Chemiluminescence imaging systems held 68.40% of revenue in 2025, reflecting the capital value of instruments installed in laboratories. Service contracts, validated standard operating procedures, and operator training extend the commercial life of these systems. Consumables and reagents are forecast to grow at a CAGR of 7.90% from 2026 to 2031, as active platforms require compatible substrates and reagents throughout their operating life. This creates recurring revenue beyond the initial equipment purchase.
The installed base strengthens long-term relationships between instrument providers and laboratories. Reagent selection is often linked to validated protocols and system performance requirements, while connected platforms increase demand for accessories and software. Electronic audit trails, user access controls, and electronic signatures support regulated procurement requirements. The revenue mix can shift toward consumables, software licenses, and compliance-focused upgrades after system installation.
Complete Report Scope:
- By Product Type
- Chemiluminescence Imaging Systems
- Consumables and Reagents
- Accessories and Softwares
- By Application
- Western Blotting
- Gel Documentation
- Dot Blot and Slot Blot Analysis
- Chemiluminescence Immunoassay Imaging
- DNA and RNA Hybridization
- Reporter Gene and Luciferase Assays
- Others
- By End User
- Pharmaceutical and Biotechnology Companies
- Academic and Research Institutes
- Hospitals and Diagnostic Laboratories
- Contract Research and Development Organizations
- Forensic Laboratories
- Food, Agriculture and Environmental Testing Laboratories
- Others
- By Geography
- North America
- United States
- Canada
- Mexico
- Europe
- Germany
- United Kingdom
- France
- Italy
- Spain
- Rest of Europe
- Asia-Pacific
- China
- India
- Japan
- Australia
- South Korea
- Rest of Asia-Pacific
- Middle East and Africa
- GCC
- South Africa
- Rest of Middle East and Africa
- South America
- Brazil
- Argentina
- Rest of South America
- North America
Geography Analysis
North America held 39.44% of the chemiluminescence imaging market share in 2025, supported by biopharmaceutical investments, academic research, and clinical laboratory applications. The United States accounted for a significant share of regional demand, while FDA 21 CFR Part 11 requirements increased demand for systems with electronic records and audit trails. In May 2026, Siemens Healthineers stated that its Atellica IM Testosterone II immunoassay achieved CDC Hormone Standardization Program certification for total testosterone. Canada contributed through academic and government-funded research, while Mexico expanded with increasing pharmaceutical manufacturing investments.
Europe was the second-largest regional contributor to the chemiluminescence imaging market, led by established pharmaceutical and biomedical research systems in Germany, the United Kingdom, and France. The EU In Vitro Diagnostic Regulation affected deployment timelines for new immunoassay platforms in hospitals. In August 2025, Revvity's Euroimmun division launched the IDS i20, a CE-marked and FDA-listed platform that runs 20 analytes across six diagnostic specialties at 140 tests per hour. Brazil led demand in South America, while demand in the Middle East and Africa was concentrated in GCC hospital networks. Import dependence above 70% in developing regions made supply reliability and currency-adjusted pricing important procurement considerations.
Asia-Pacific is forecast to grow at a CAGR of 11.88% from 2026 to 2031, the highest rate in the chemiluminescence imaging market. Government-directed proteomics spending, biopharmaceutical manufacturing growth, and clinical diagnostics investments support demand. China's precision medicine and biotechnology programs strengthen research infrastructure, while Tanon Science & Technology competes in mid-tier imaging systems. India is expanding laboratory equipment procurement through Department of Biotechnology and Department of Science & Technology funding programs, while Japan, South Korea, Australia, Singapore, and Malaysia contribute through research, diagnostics, and biopharmaceutical manufacturing investments.
- Analytik Jena
- ATTO
- Azure Biosystems
- Berthold Technologies
- Bio-Rad Laboratories
- Bio-Techne
- Cleaver Scientific
- Danaher
- DiaSorin
- LI-COR, Inc.
- Merck
- Pop-Bio Ltd
- Revvity, Inc.
- Siemens Healthineers
- Syngene International
- Tanon Science & Technology Co., Ltd.
- Tecan Group
- Thermo Fisher Scientific
- UVITEC Limited
- Vilber GmbH
Additional Benefits:
- The market estimate (ME) sheet in Excel format
- 3 months of analyst support
TABLE OF CONTENTS
1 INTRODUCTION
- 1.1 Study Assumptions and Market Definition
- 1.2 Scope of the Study
2 RESEARCH METHODOLOGY
3 EXECUTIVE SUMMARY
4 MARKET LANDSCAPE
- 4.1 Market Overview
- 4.2 Market Drivers
- 4.2.1 Expansion of Quantitative Camera-Based Western Blotting
- 4.2.2 Continued Use of High-Sensitivity ECL Workflows in Protein Research
- 4.2.3 Demand for Multipurpose Gel, Blot and Luminescence Imaging Platforms
- 4.2.4 Cloud-Connected and Automated Image Analysis Adoption
- 4.2.5 Absolute Photon-Counted Quantification and NIST-Traceable Workflows
- 4.3 Market Restraints
- 4.3.1 Reproducibility and Dynamic-Range Limitations in Chemiluminescent Quantification
- 4.3.2 Substitution by Multiplex Fluorescence and Automated Capillary Western Platforms
- 4.3.3 High Validation Burden for Clinical and Regulated Workflows
- 4.4 Value/Supply-Chain Analysis
- 4.5 Regulatory Landscape
- 4.6 Technological Outlook
- 4.7 Porter's Five Forces Analysis
- 4.7.1 Threat of New Entrants
- 4.7.2 Bargaining Power of Suppliers
- 4.7.3 Bargaining Power of Buyers
- 4.7.4 Threat of Substitutes
- 4.7.5 Competitive Rivalry
5 MARKET SIZE AND GROWTH FORECASTS (VALUE, USD)
- 5.1 By Product Type
- 5.1.1 Chemiluminescence Imaging Systems
- 5.1.2 Consumables and Reagents
- 5.1.3 Accessories and Softwares
- 5.2 By Application
- 5.2.1 Western Blotting
- 5.2.2 Gel Documentation
- 5.2.3 Dot Blot and Slot Blot Analysis
- 5.2.4 Chemiluminescence Immunoassay Imaging
- 5.2.5 DNA and RNA Hybridization
- 5.2.6 Reporter Gene and Luciferase Assays
- 5.2.7 Others
- 5.3 By End User
- 5.3.1 Pharmaceutical and Biotechnology Companies
- 5.3.2 Academic and Research Institutes
- 5.3.3 Hospitals and Diagnostic Laboratories
- 5.3.4 Contract Research and Development Organizations
- 5.3.5 Forensic Laboratories
- 5.3.6 Food, Agriculture and Environmental Testing Laboratories
- 5.3.7 Others
- 5.4 By Geography
- 5.4.1 North America
- 5.4.1.1 United States
- 5.4.1.2 Canada
- 5.4.1.3 Mexico
- 5.4.2 Europe
- 5.4.2.1 Germany
- 5.4.2.2 United Kingdom
- 5.4.2.3 France
- 5.4.2.4 Italy
- 5.4.2.5 Spain
- 5.4.2.6 Rest of Europe
- 5.4.3 Asia-Pacific
- 5.4.3.1 China
- 5.4.3.2 India
- 5.4.3.3 Japan
- 5.4.3.4 Australia
- 5.4.3.5 South Korea
- 5.4.3.6 Rest of Asia-Pacific
- 5.4.4 Middle East and Africa
- 5.4.4.1 GCC
- 5.4.4.2 South Africa
- 5.4.4.3 Rest of Middle East and Africa
- 5.4.5 South America
- 5.4.5.1 Brazil
- 5.4.5.2 Argentina
- 5.4.5.3 Rest of South America
- 5.4.1 North America
6 COMPETITIVE LANDSCAPE
- 6.1 Market Concentration
- 6.2 Market Share Analysis
- 6.3 Company Profiles (includes Global Level Overview, Market Level Overview, Core Segments, Financials as available, Strategic Information, Market Rank/Share, Products and Services, Recent Developments)
- 6.3.1 Analytik Jena GmbH+Co. KG
- 6.3.2 ATTO Corporation
- 6.3.3 Azure Biosystems, Inc.
- 6.3.4 Berthold Technologies GmbH & Co. KG
- 6.3.5 Bio-Rad Laboratories, Inc.
- 6.3.6 Bio-Techne Corporation
- 6.3.7 Cleaver Scientific Ltd
- 6.3.8 Danaher Corporation
- 6.3.9 DiaSorin S.p.A.
- 6.3.10 LI-COR, Inc.
- 6.3.11 Merck KGaA
- 6.3.12 Pop-Bio Ltd
- 6.3.13 Revvity, Inc.
- 6.3.14 Siemens Healthineers AG
- 6.3.15 Syngene International Limited
- 6.3.16 Tanon Science & Technology Co., Ltd.
- 6.3.17 Tecan Group Ltd.
- 6.3.18 Thermo Fisher Scientific Inc.
- 6.3.19 UVITEC Limited
- 6.3.20 Vilber GmbH
7 MARKET OPPORTUNITIES AND FUTURE OUTLOOK
- 7.1 White-Space and Unmet-Need Assessment


