

|
시장보고서
상품코드
2154877
부동산 마케팅 서비스 : 시장 점유율 분석, 업계 동향과 통계, 성장 예측(2026-2031년)Real Estate Marketing Services - Market Share Analysis, Industry Trends & Statistics, Growth Forecasts (2026 - 2031) |
||||||
 Mordor Intelligence
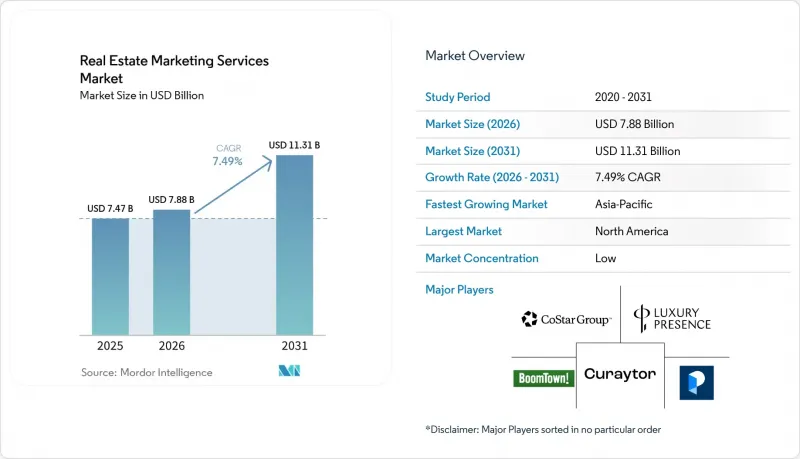
에 따르면 부동산 마케팅 서비스 시장 규모는 2025년 74억 7,000만 달러, 2026년 78억 8,000만 달러에서 2031년까지 113억 1,000만 달러로 확대될 것으로 예측되고 있으며, 2026-2031년까지 연평균 성장률(CAGR)은 7.49%에 달할 전망입니다.
글로벌 부동산 마케팅 서비스 시장의 동향 및 인사이트
디지털 우선 주택 검색 및 온라인 부동산 중개사 찾기
부동산 마케팅 서비스 시장은 주택 구매자나 매도자가 부동산 중개인과 접촉하기 전에 거의 예외 없이 온라인 조사를 진행하는 경향으로부터 혜택을 받고 있습니다. 전미부동산협회(National Association of REALTORS)의 보고서에 따르면 2025년에는 온라인 채널이 개인 소개를 제치고 소비자가 중개인을 찾는 주요 수단이 되었습니다. 이러한 변화로 인해 지속적인 디지털 가시성은 상황이 어려워졌을 때 일시 중단할 수 있는 홍보 활동이 아니라, 부동산 전문가에게 필수적인 운영 비용이 되었습니다. 경기 침체기에 가시성을 낮추면, 고객 활동이 활발해질 때 중개인의 존재감이 희미해질 가능성이 있습니다. 이는 구매 희망자들이 여전히 온라인상에서 프로필, 매물 정보, 지역에 대한 전문 지식을 비교하고 있기 때문입니다. 뱅크 오브 아메리카에 따르면 주택 구매를 고려하는 사람들은 주택 구매 조사에 AI 툴을 점점 더 많이 활용하고 있으며, 특히 Z세대와 밀레니얼 세대를 포함한 젊은 구매자층에서 그 이용이 두드러진다고 합니다. 현재 매물 탐색 과정은 기존의 검색, 부동산 포털 사이트, AI가 생성한 답변 등 다방면에 걸쳐 있으며, 이로 인해 부동산 마케팅 서비스 시장에 요구되는 계획, 컨텐츠, 최적화 업무의 범위가 확대되고 있습니다.
소셜미디어와 CRM을 활용한 고품질 잠재 고객 확보
소셜미디어와 CRM 시스템은 초기 고객 도달과 체계적인 후속 조치를 결합하므로 부동산 마케팅 서비스 시장에서 리드 생성의 중심적인 역할을 맡게 되었습니다. 전미부동산협회(NAR)의 조사에 따르면 부동산 중개업자들은 리드 생성 기술로 소셜미디어를 1위로 꼽았으며, 그 다음으로 CRM 플랫폼을 꼽았습니다. 소셜 플랫폼은 리드당 비용을 절감하면서도 대량의 문의를 창출할 수 있지만, 이러한 리드에 대해서는 포털 사이트나 소개를 통한 연락처보다 더 장기적이고 치밀하게 계획된 후속 조치가 필요한 경우가 많습니다. 이러한 요건으로 인해 잠재 구매자가 거래 준비가 완료될 때까지 관심을 유지할 수 있도록 CRM 설정, 대상 고객 세분화, 메시지 시퀀싱 및 고객 여정에 대한 수요가 발생하고 있습니다. CallRail의 보고서에 따르면 조사 대상인 미국 부동산 기업의 상당수가 리드 스코어링 및 어트리뷰션 측정에 AI를 활용할 계획인 것으로 밝혀졌습니다. 부동산 마케팅 서비스 시장에서 클라이언트의 리드 품질 및 후속 조치 프로세스 개선을 지원하는 제공업체는 개별 캠페인의 전개 및 관리에 그치지 않는 요구를 충족시킬 수 있습니다.
거래량 변동과 매물 재고 부족
마케팅 지출은 매물 공급량 및 거래 동향과 직접적으로 연동되므로 서비스 수요는 주택 시장 사이클과 적극적으로 판매되고 있는 매물의 수에 좌우되기 쉬운 경향이 있습니다. 미국의 중고 주택 판매는 전년 대비 소폭 개선되었으나, 재고와 공급은 여전히 부족한 상태가 지속되고 있습니다. 전미부동산협회(NAR)는 최근 판매 수준을 "역사적으로 낮은" 수준이라고 표현했으며, 최신 수치도 팬데믹 이전 수준보다 낮은 상태를 유지하고 있습니다. 뱅크 오브 아메리카(Bank of America)의 조사에 따르면 주택 가격은 여전히 높은 수준을 유지하고 있는 반면, 많은 구매 희망자들이 가격이나 금리의 개선을 기다리고 있는 것으로 나타났습니다. 매물 등록 건수의 감소는 진행 중인 캠페인의 감소, 중개인의 예산 제한, 그리고 퍼포먼스 마케팅 팀이 캠페인 활동을 테스트, 개선, 최적화할 수 있는 기간의 단축으로 이어질 수 있습니다. 이러한 압박은 거래 활동이 활발한 시기에 광고나 리드를 더 빈번하게 구매하는 포털 사이트에 의존하는 중개인들에게 특히 크게 작용하며, 부동산 마케팅 서비스 시장 전체의 지출을 억제하는 요인이 될 수 있습니다.
부문 분석
2025년, 부동산 마케팅 서비스 시장 규모의 35.12%를 성과 기반 마케팅 및 리드 확보 서비스가 차지했습니다. 이러한 주도적인 위상은 측정 가능한 단기 파이프라인 성과를 추구하는 부동산 중개업자 및 개발사에게 클릭당 과금형 광고, 유료 소셜 광고, 포털 광고가 얼마나 중요한지를 반영한 것입니다. 브랜딩 및 크리에이티브 서비스는 변화하는 매물 정보와 캠페인을 통해 전문가들이 인지도가 높은 정체성을 유지해야 하므로 안정적인 수익 기반을 제공했습니다. 또한 디지털 자산 및 매물 정보 관리 서비스도 사진 촬영, 동영상 제작, 매물 정보 업데이트, 컨텐츠 배포를 통해 지속적인 수요를 창출했습니다. 이벤트 및 체험형 마케팅 서비스는 특히 고급 주택 프로그램이나 개발사의 사전 판매 활동에서 규모는 작지만 견고한 지출 비중을 차지했습니다.
마케팅 전략·조사·분석 서비스는 2031년까지 연평균 성장률(CAGR) 8.55%로 확대될 것으로 예측되며, 부동산 마케팅 서비스 시장에서 가장 빠르게 성장하는 서비스 유형이 될 전망입니다. 이 부문은 문의 건수 최적화에서 리드의 질 및 계약 성사 결과에 초점을 맞춘 캠페인 설계로의 전환을 반영하고 있습니다. 각 기업은 첫 접촉부터 계약 체결 단계에 이르기까지의 활동을 추적하는 멀티 터치 어트리뷰션 모델을 구축하고 있습니다. 세일즈포스는 2026년 6월, 행동 신호를 통해 리드를 식별하는 ‘Hunter’와 정의된 목표를 기반으로 캠페인을 구축 및 최적화하는 ‘Marketing Goals Agent’ 등 자율형 마케팅 에이전트를 도입했습니다. 풀서비스형 대행사는 이러한 툴을 부동산별 전략 수립, 채널 선정, 성과 평가 및 캠페인 결과 분석에 활용할 수 있습니다.
지역별 분석
2025년 기준, 북미는 38.34%의 점유율을 차지했습니다. 이 지역은 미국 및 캐나다의 발달된 디지털 광고 인프라와 성숙한 포털 및 CRM 생태계의 혜택을 받고 있습니다. 에이전트와 매물 게재 수의 비율이 높기 때문에 유료 미디어, 매물 정보 배포, CRM 관리, 컨텐츠 제작 각 분야에서 구매자와 판매자의 관심을 끌기 위한 경쟁이 지속되고 있습니다. 특히 미국은 거래 상황의 변화가 중개업자나 에이전트의 마케팅 예산에 즉각적인 영향을 미칠 가능성이 있으므로 매우 중요합니다.
아시아태평양은 2031년까지 연평균 성장률(CAGR) 8.38%로 확대될 것으로 예측됩니다. 인도의 ‘모바일 퍼스트’ 구매자층과 동남아시아 도시 지역의 급속한 도시화가 성과형 캠페인 및 개발사 대상 분양 개시 서비스에 대한 수요를 지원하고 있습니다. 개발사들은 주택 프로젝트 홍보에 있으며, 쇼룸 방문객 유치에서 검색, 소셜미디어, 프로그래매틱 광고 등 측정 가능한 디지털 채널로 전환하고 있습니다. 부동산 마케팅 서비스 시장은 캠페인 팀이 각국 구매자의 선호도 차이에 따라 메시징, 리드 대응, 채널 배분을 조정할 수 있는 기회를 제공하고 있습니다.
유럽에서는 독일, 영국, 프랑스의 디지털 성숙도 수준이 각기 다르지만, 유료 광고, 유기적 트래픽, 전환 활동 측정 측면에서는 영국이 더 앞서 있습니다. 중동 시장은 제도화가 더 진전되어 있으며, 광고 활동에 대한 감독이 강화됨에 따라 전문 서비스에 대한 수요가 발생하고 있습니다. UAE는 여전히 이 지역에서 가장 디지털화가 진전된 부동산 마케팅 환경이며, 국제 구매자 대상 캠페인에서는 검색, 소셜미디어, WhatsApp을 통한 후속 조치가 활용되고 있습니다. 남미는 도입 초기 단계에 있지만, 브라질은 도시화와 디지털 광고 인프라 확충으로 인해 가장 큰 잠재 시장을 형성하고 있습니다. 남아프리카공화국, 이집트, 나이지리아가 주도하는 아프리카 시장은 기존의 야외 매체에서 디지털을 우선시하는 부동산 홍보로 전환되고 있습니다.
기타 혜택:
- 엑셀 형식의 시장 예측(ME) 시트
- 3개월간의 애널리스트 지원
자주 묻는 질문
목차
제1장 서론
- 조사 전제조건과 시장 정의
- 조사 범위
제2장 조사 방법
제3장 개요
제4장 시장 구도
- 시장 개요
- 시장 성장 촉진요인
- 시장 성장 억제요인
- 업계 밸류체인 분석
- 거시경제 요인이 시장에 미치는 영향
- 규제 상황
- 기술 전망
- Porter's Five Forces 분석
제5장 시장 규모와 성장 예측
- 서비스 유형별
- 최종사용자별
- 지역별
- 북미
- 미국
- 캐나다
- 멕시코
- 남미
- 브라질
- 아르헨티나
- 칠레
- 콜롬비아
- 페루
- 기타 남미 국가
- 유럽
- 영국
- 독일
- 프랑스
- 이탈리아
- 스페인
- 러시아
- 네덜란드
- 폴란드
- 기타 유럽 국가
- 아시아태평양
- 인도
- 일본
- 호주
- 한국
- 인도네시아
- 필리핀
- 태국
- 기타 아시아태평양 국가
- 중동
- 튀르키예
- 이스라엘
- 사우디아라비아
- 아랍에미리트
- 기타 중동 국가
- 아프리카
- 남아프리카공화국
- 나이지리아
- 케냐
- 이집트
- 기타 아프리카 국가
- 북미
제6장 경쟁 구도
- 시장 집중도
- 전략적 동향
- 시장 점유율 분석
- 기업 개요
- Luxury Presence, Inc.
- BoomTown ROI LLC
- Placester, Inc.
- Curaytor, Inc.
- Real Geeks, LLC
- Agent Image, Inc.
- Chime Technologies, Inc.
- Sierra Interactive, LLC
- MoxiWorks, LLC
- SharpLaunch, Inc.
- Zillow Group, Inc.
- CoStar Group, Inc.
- Move, Inc.
- REA Group Ltd
- Rightmove plc
제7장 시장 기회와 향후 전망
KSA 26.10.28According to Mordor Intelligence, the real estate marketing services market size is projected to expand from USD 7.47 billion in 2025 and USD 7.88 billion in 2026 to USD 11.31 billion by 2031, registering a CAGR of 7.49% between 2026 and 2031.
Global Real Estate Marketing Services Market Trends and Insights
Digital-First Home Search and Online Agent Discovery
The Real estate marketing services market benefits from the nearly universal use of online research by homebuyers and sellers before they enter into a conversation with an agent. The National Association of REALTORS reported that online channels became the primary way consumers found an agent in 2025, ahead of personal referrals. This change makes persistent digital visibility a necessary operating expense for property professionals, rather than a promotional activity that can be paused when conditions become difficult. Reducing visibility during a slow period can leave agents less visible when customer activity improves, because buyers will still compare profiles, listings, and local expertise online. Bank of America reported that prospective buyers increasingly used AI tools for homebuying research, with adoption especially notable among younger buyer groups, including Gen Z respondents and Millennials. The broader discovery process now includes conventional search, property portals, and AI-generated responses, which increases the range of planning, content, and optimization work required from the Real estate marketing services market.
Social Media and CRM-Led Quality Lead Generation
Social media and CRM systems have become central to lead generation in the Real estate marketing services market, as they combine initial customer reach with structured follow-up. The National Association of REALTORS found that REALTORS identified social media as their top lead-generating technology, followed by CRM platforms. Social platforms can generate high inquiry volumes at a lower cost per lead, but these leads often require longer and more carefully organized follow-up than portal or referral contacts. That requirement creates demand for CRM configuration, audience segmentation, message sequencing, and customer journeys that keep potential buyers engaged before they are ready to transact. CallRail reported that surveyed U.S. real estate businesses planned to use AI for lead scoring and attribution measurement. Providers in the Real estate marketing services market that help clients improve lead quality and follow-up processes can serve needs that extend beyond the placement and management of individual campaigns.
Transaction-Volume Volatility and Thin Listing Inventories
Marketing spending is directly linked to listing supply and transaction activity, making service demand sensitive to housing cycles and the number of properties actively marketed. Existing-home sales in the United States improved slightly from the prior year, while inventory and supply remained constrained. The National Association of REALTORS described the recent sales level as historically low, and the latest reading remained below pre-pandemic norms. Bank of America found that many prospective buyers were waiting for prices and rates to improve, while home prices remained elevated. Lower listing availability can reduce active campaigns, limit agent budgets, and shorten the period available for performance marketing teams to test, refine, and optimize campaign activity. This pressure is particularly strong for portal-dependent agents that buy advertising or leads more frequently when transaction activity is higher, which can constrain spending across the Real estate marketing services market.
Other drivers and restraints analyzed in the detailed report include:
- Performance Marketing Adoption by Developers and Brokerages
- Rich-Media Listing Expectations From Sellers and Buyers
- Rising Customer-Acquisition Costs Across Portals and Paid Media
For complete list of drivers and restraints, kindly check the Table Of Contents.
Segment Analysis
Performance Marketing and Lead Acquisition Services accounted for 35.12% of the Real estate marketing services market size in 2025. Its leading position reflected the importance of pay-per-click, paid social, and portal advertising for agents and developers seeking measurable near-term pipeline results. Branding and Creative Services supplied a steady revenue base because professionals need to maintain recognizable identities across changing listings and campaigns. Digital Asset and Listing Management Services also generated recurring demand through photography, video, listing updates, and content distribution. Events and Experiential Marketing Services represented a smaller but durable part of spending, particularly for luxury residential programs and developer pre-sales activity.
Marketing Strategy, Research and Analytics Services is projected to expand at an 8.55% CAGR through 2031, making it the fastest service type in the Real estate marketing services market. The segment reflects a move from optimizing inquiry volumes toward designing campaigns around lead quality and transaction outcomes. Firms are building multi-touch attribution models that follow activity from the first impression to the closing stage. Salesforce introduced autonomous marketing agents in June 2026, including Hunter for identifying leads from behavioral signals and a Marketing Goals Agent for building and optimizing campaigns around defined objectives. Full-service agencies can apply these tools to property-specific strategy, channel selection, performance review, and the interpretation of campaign results.
Complete Report Scope:
- By Service Type
- Performance Marketing and Lead Acquisition Services
- Branding and Creative Services
- Digital Asset and Listing Management Services
- Events and Experiential Marketing Services
- Marketing Strategy, Research and Analytics Services
- By End-User
- Brokerages and Agencies
- Residential Developers
- Commercial Real Estate Firms
- Property Management Companies
- REITs and Institutional Investors
- By Geography
- North America
- United States
- Canada
- Mexico
- South America
- Brazil
- Argentina
- Chile
- Colombia
- Peru
- Rest of South America
- Europe
- United Kingdom
- Germany
- France
- Italy
- Spain
- Russia
- Netherlands
- Poland
- Rest of Europe
- Asia-Pacific
- India
- Japan
- Australia
- South Korea
- Indonesia
- Philippines
- Thailand
- Rest of Asia-Pacific
- Middle East
- Turkey
- Israel
- Saudi Arabia
- United Arab Emirates
- Rest of Middle East
- Africa
- South Africa
- Nigeria
- Kenya
- Egypt
- Rest of Africa
- North America
Geography Analysis
North America accounted for 38.34% share in 2025. The region benefits from a developed digital advertising infrastructure and mature portal and CRM ecosystems in the United States and Canada. High agent-to-listing ratios sustain competition for buyer and seller attention across paid media, listing distribution, CRM management, and content production. The United States is particularly important because changes in transactions can quickly affect brokerage and agent marketing budgets.
Asia-Pacific is projected to expand at an 8.38% CAGR through 2031. Mobile-first buyer groups in India and rapid urbanization in Southeast Asian cities support demand for performance campaigns and developer launch services. Developers are shifting from showroom walk-ins to measurable digital channels, including search, social media, and programmatic advertising, for promoting residential projects. The Real estate marketing services market offers opportunities for campaign teams to adapt messaging, lead handling, and channel allocation to differing national buyer preferences.
Europe has different digital maturity profiles across Germany, the United Kingdom, and France, while the United Kingdom is more advanced in measuring paid, organic, and conversion activity. Middle Eastern markets are becoming more formalized, creating demand for professional services as advertising activity receives greater oversight. The UAE remains the region's most digitally developed property marketing environment, with international buyer campaigns using search, social media, and WhatsApp follow-up. South America is at an earlier stage of adoption, with Brazil offering the largest addressable opportunity because of urbanization and digital advertising infrastructure. African markets led by South Africa, Egypt, and Nigeria are moving from traditional outdoor media toward digital-first property promotion.
- Luxury Presence, Inc.
- BoomTown ROI LLC
- Placester, Inc.
- Curaytor, Inc.
- Real Geeks, LLC
- Agent Image, Inc.
- Chime Technologies, Inc.
- Sierra Interactive, LLC
- MoxiWorks, LLC
- SharpLaunch, Inc.
- Zillow Group, Inc.
- CoStar Group, Inc.
- Move, Inc.
- REA Group Ltd
- Rightmove plc
Additional Benefits:
- The market estimate (ME) sheet in Excel format
- 3 months of analyst support
TABLE OF CONTENTS
1 INTRODUCTION
- 1.1 Study Assumptions and Market Definition
- 1.2 Scope of the Study
2 RESEARCH METHODOLOGY
3 EXECUTIVE SUMMARY
4 MARKET LANDSCAPE
- 4.1 Market Overview
- 4.2 Market Drivers
- 4.2.1 Digital-First Home Search and Online Agent Discovery
- 4.2.2 Rich-Media Listing Expectations from Sellers and Buyers
- 4.2.3 Social Media and CRM-Led Quality Lead Generation
- 4.2.4 Performance Marketing Adoption by Developers and Brokerages
- 4.2.5 AI Search Optimization and Answer-Engine Discovery
- 4.2.6 Pre-Listing Seller Acquisition and Phased Listing Promotion
- 4.3 Market Restraints
- 4.3.1 Transaction-Volume Volatility and Thin Listing Inventories
- 4.3.2 Rising Customer-Acquisition Costs Across Portals and Paid Media
- 4.3.3 AI Visibility Concentrating Demand Around a Small Share of Agents
- 4.3.4 Disclosure and Authenticity Risks in AI-Enhanced Listing Media
- 4.4 Industry Value Chain Analysis
- 4.5 Impact of Macroeconomic Factors on the Market
- 4.6 Regulatory Landscape
- 4.7 Technological Outlook
- 4.8 Porter's Five Forces Analysis
- 4.8.1 Threat of New Entrants
- 4.8.2 Bargaining Power of Buyers
- 4.8.3 Bargaining Power of Suppliers
- 4.8.4 Threat of Substitutes
- 4.8.5 Intensity of Rivalry
5 MARKET SIZE AND GROWTH FORECASTS (VALUE)
- 5.1 By Service Type
- 5.1.1 Performance Marketing and Lead Acquisition Services
- 5.1.2 Branding and Creative Services
- 5.1.3 Digital Asset and Listing Management Services
- 5.1.4 Events and Experiential Marketing Services
- 5.1.5 Marketing Strategy, Research and Analytics Services
- 5.2 By End-User
- 5.2.1 Brokerages and Agencies
- 5.2.2 Residential Developers
- 5.2.3 Commercial Real Estate Firms
- 5.2.4 Property Management Companies
- 5.2.5 REITs and Institutional Investors
- 5.3 By Geography
- 5.3.1 North America
- 5.3.1.1 United States
- 5.3.1.2 Canada
- 5.3.1.3 Mexico
- 5.3.2 South America
- 5.3.2.1 Brazil
- 5.3.2.2 Argentina
- 5.3.2.3 Chile
- 5.3.2.4 Colombia
- 5.3.2.5 Peru
- 5.3.2.6 Rest of South America
- 5.3.3 Europe
- 5.3.3.1 United Kingdom
- 5.3.3.2 Germany
- 5.3.3.3 France
- 5.3.3.4 Italy
- 5.3.3.5 Spain
- 5.3.3.6 Russia
- 5.3.3.7 Netherlands
- 5.3.3.8 Poland
- 5.3.3.9 Rest of Europe
- 5.3.4 Asia-Pacific
- 5.3.4.1 India
- 5.3.4.2 Japan
- 5.3.4.3 Australia
- 5.3.4.4 South Korea
- 5.3.4.5 Indonesia
- 5.3.4.6 Philippines
- 5.3.4.7 Thailand
- 5.3.4.8 Rest of Asia-Pacific
- 5.3.5 Middle East
- 5.3.5.1 Turkey
- 5.3.5.2 Israel
- 5.3.5.3 Saudi Arabia
- 5.3.5.4 United Arab Emirates
- 5.3.5.5 Rest of Middle East
- 5.3.6 Africa
- 5.3.6.1 South Africa
- 5.3.6.2 Nigeria
- 5.3.6.3 Kenya
- 5.3.6.4 Egypt
- 5.3.6.5 Rest of Africa
- 5.3.1 North America
6 COMPETITIVE LANDSCAPE
- 6.1 Market Concentration
- 6.2 Strategic Moves
- 6.3 Market Share Analysis
- 6.4 Company Profiles (includes Global Level Overview, Market Level Overview, Core Segments, Financials as available, Strategic Information, Market Rank/Share, Products and Services, Recent Developments)
- 6.4.1 Luxury Presence, Inc.
- 6.4.2 BoomTown ROI LLC
- 6.4.3 Placester, Inc.
- 6.4.4 Curaytor, Inc.
- 6.4.5 Real Geeks, LLC
- 6.4.6 Agent Image, Inc.
- 6.4.7 Chime Technologies, Inc.
- 6.4.8 Sierra Interactive, LLC
- 6.4.9 MoxiWorks, LLC
- 6.4.10 SharpLaunch, Inc.
- 6.4.11 Zillow Group, Inc.
- 6.4.12 CoStar Group, Inc.
- 6.4.13 Move, Inc.
- 6.4.14 REA Group Ltd
- 6.4.15 Rightmove plc
7 MARKET OPPORTUNITIES AND FUTURE OUTLOOK
- 7.1 White-Space and Unmet-need Assessment


