


|
시장보고서
상품코드
1593159
네트워크 사업자 설비투자 전망(2024년 4분기) : 통신사 정체 속 생성형 AI 데이터센터 열풍… 2024년 통신 설비투자 6,000억 달러 돌파, 2028년 웹스케일이 시장 주도 전망Network Operator Capex Forecast - 4Q24 Edition: Telco Flatlines but GenAI-driven Data Center Hype Drives Comms Capex above $600B in 2024, Webscale will Lead Market by 2028 |
||||||
본 보고서는 통신사업자, 웹스케일러, CNNO(캐리어 중립 네트워크 사업자)의 3부문의 사업자 그룹을 포함한 네트워크 사업자 시장의 최신 예측을 제공합니다. 본 보고서에서는 175개 이상의 사업자를 분기별로 커버하고 2024년 3분기 말까지 시장실태를 반영하고 있습니다. 예측에는 총 부문의 수익, 자본 투자, 직원 수의 합계 및 각 부문에 대한 추가 지표가 포함됩니다.
2024년 3개 사업자 그룹의 수익 규모는 4조 4,800억 달러(2023년: 4조 2,700억 달러)이며, 설비 투자액은 6,120억 달러(2023년: 5,480억 달러), 직원수 는 886만명(2023년: 881만명)으로 예측되고 있습니다.
비주얼
보고서 하이라이트:
벤더 어드레서블 시장 : 기술 벤더는 GPU 서버 칩에서 광섬유 스플라이스 인클로저, 무선 안테나, 네트워크 구축, 클라우드 소프트웨어에 이르기까지 이 예측에서 추적하는 3개 사업자 부문 각각에 다양한 제품과 서비스를 판매 이 제품은 GPU 서버 칩, 광섬유 연결 인클로저, 무선 안테나, 네트워크 구축, 클라우드 소프트웨어 등 모든 유형의 제품을 포함합니다.
2011년 3부문에 따른 설비투자 총액은 3,360억 달러로, 그 90%가 통신사업자였습니다. 2028년에는 3부분의 설비투자 총액이 6,380억 달러에 이르며, 그 중 통신사업자가 차지하는 비율은 44%에 머물 것으로 예측됩니다. CNNO의 설비 투자액은 2011년에는 불과 60억 달러였지만, 2028년에는 약 540억 달러에 달할 것으로 예측되고 있습니다. 2011년 웹스케일의 설비투자액은 290억 달러로 통신사업자 시장의 8%에 해당했습니다. 2023년에는 1,930억 달러(전체의 35%)에 이르렀으며, 현재는 AI/생성 AI의 수요가 새로운 상승 사이클에 의해 웹 스케일이 활황이며, 2028년에는 처음으로 통신 사업자를 웃돌아 전체의 48%에 해당하는 3,030억 달러에 달할 것으로 예상됩니다.
언급된 기업
|
|
목차
주요 섹션은 다음과 같습니다.
- 1. 보고서 하이라이트
- 2. 요약
- 3. 네트워크 사업자의 합계
- 4. 통신 사업자
- 5. 통신사업자-지역별 분할
- 6. 웹 스케일
- 7. CNNO
- 8. 주요 통신 사업자의 지출 전망
- 9. 당사에 대해
합계 탭의 숫자 목록은 다음과 같습니다.
- 부문별 설비투자 예측 : 2024년 4분기와 2023년 12월 예측의 차이(%)
- 부문별 설비투자 예측 : 2024년 4분기와 2023년 12월 예측의 차이(금액)
- 모든 사업자의 수익 성장률 : 신구 예측
- 통신 사업자의 수익 성장률 : 신구 예측 비교
- 자본 집약도 : 통신 사업자 : 신구 예측
- 자본 집약도 : 웹 스케일러 : 신구 예측
- 자본 집약도 : CNNO : 신구 예측
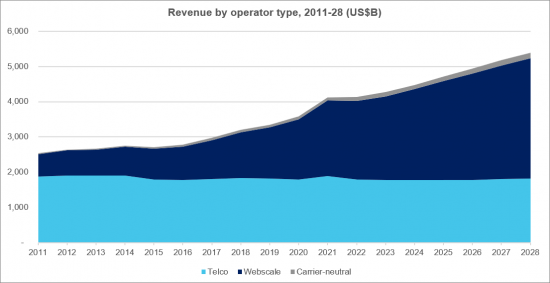
- 사업자 유형별 수익
- 사업자 유형별 설비 투자액
- 사업자 유형별 설비 투자액
- 사업자 유형별 자본 집약도
- 사업자 유형별 직원수
- 사업자 유형별 종업원당 수익
- 네트워크 사업자의 수익(유형별), 세계의 GDP에 대한 비율(%)
- 네트워크 사업자 직원수, 세계 인구의 비율
- 통신사업자의 수익과 가입자당 설비투자액
- 지출액 상위 50개사의 사업자, 2024년 2분기 설비투자액
- 장기 자본 집약도에 기초한 상위 50사업자(2019년 3분기-2024년 2분기 평균)
This forecast presents our latest projections for the network operator market, spanning telecommunications operators (telcos), webscalers, and carrier-neutral network operators (CNNOs). The forecast is based on our quarterly coverage of over 175 operators, and reflects market realities through the end of 3Q24. Our forecast includes revenues, capex and employee totals for all segments, and additional metrics for each individual segment. In 2024, we expect the three operator groups to account for $4.48 trillion (T) in revenues (2023: $4.27T), $612 billion (B) in capex (2023: $548B), and 8.86 million (M) employees (2023: 8.81M). This report provides 2011-23 actuals and projections through 2028, and includes projections from the most recent full forecast (12/23) for reference.
VISUALS

Below are the key highlights of the report:
Vendor addressable market: Tech vendors sell various products and services to each of the three operator segments tracked in this forecast - everything from GPU server chips to fiber optic splice enclosures to radio antennas to network construction to cloud software. Their addressable market is directly related to capex, which captures most external technology purchases including a large portion of software & services expenses. In 2011, the starting point of our coverage, total three segment capex was $336 billion, 90% of which was telco. By 2028, three segment capex will reach $638 billion, and telco will account for only 44% of the total. In the intervening years, an important segment of third-party neutral operators of network capacity and space has evolved; CNNO capex was just $6B in 2011 but will hit about $54B by 2028. But the real story of the market is webscale: capex spend by webscalers has surged multiple times as these tech companies innovate, scale and capture more of the world's digital value. In 2011, webscale capex was $29B, or 8% of the comms operator market. In 2023, it reached $193B (35% of total), and AI/GenAI demand is currently fueling it through another up cycle, which will push webscale to about $303B by 2028, or 48% of total (and more than telco for the first time).
Telco
This report includes region- and country-level projections for the telecommunications network operator (TNO, or telco) market. These projections are based upon MTN Consulting's quarterly coverage of 140 telcos across the globe, spanning 1Q11 through 2Q24. For 2024, we expect global telco revenues of $1,772 billion (flat versus 2023), capex of $297B (down 5% YoY), and employees of 4.457 million (down 1.2% YoY). Labor costs per employee in 2024 will be about $60.8K, up from $58.7K in 2023.
Webscale
This report includes projections for the growth and development of the webscale network operator (WNO, or webscale) market. The projections are based on our quarterly coverage of 21 webscalers, spanning 1Q11-2Q24, and they break out China from the rest of the globe. For 2024, we expect global webscale revenues of $2,584 billion, up 9% YoY, $311B in R&D spending (+6% YoY), $267 billion in capex (+39% YoY), and 4.284 million employees (+2.4% YoY). Our forecast for webscale capex has significantly increased since the last update in late 2023. However, the unusual spike in capex underway in 2024 will be followed by two years of decline.
Carrier-neutral
This report also includes projections for the growth and development of the carrier-neutral network operator (CNNO) market. The CNNO market is the smallest of three operator segments tracked by MTN Consulting, but CNNOs play a crucial, complementary role in the communications sector and own and operate a large portion of the world's cell towers, data centers, and fiber networks. Our CNNO projections are based upon quarterly tracking of 47 CNNOs across the globe. Our CNNO tracking is focused on publicly traded companies but we also attempt to capture the significant private equity-led activity in this sector. In 2024, we expect CNNO revenues to total about $125B (+4% YoY), capex of $48B (+16% YoY), and about 120K employees (flat YoY). CNNOs' asset base includes over 1,500 data centers, 3.3 million cell towers, and 1.1 million fiber route miles.
Companies mentioned:
|
|
Table of Contents
Key sections include:
- 1. Report Highlights
- 2. Summary
- 3. Network Operator Totals
- 4. Telco
- 5. Telco - Regional Splits
- 6. Webscale
- 7. Carrier-neutral (CNNO)
- 8. Spending outlook for top operators
- 9. About
This report has a large number of figures on each of the main result tabs: totals, telco, telco - regional splits, webscale, and carrier-neutral (CNNO). For a full list of figures please contact us.
Here is a list of figures on the "Totals" tab:
- Capex forecast by segment: 4Q24 v. Dec 2023 forecasts, % difference
- Capex forecast by segment: 4Q24 v. Dec 2023 forecasts, $B difference
- Revenue growth rates, all operators: New vs. old forecast
- Revenue growth rates, Telcos: New vs. old forecast
- Capital intensity, Telcos: New vs. old forecast
- Capital intensity, Webscalers: New vs. old forecast
- Capital intensity, Carrier-neutral operators: New vs. old forecast
- Revenue by operator type, 2011-28 (US$B)
- Capex by operator type, 2011-28 (US$B)
- Capex by operator type, 2011-28: % of total
- Capital intensity by operator type, 2011-28
- Employees by operator type (M)
- Revenues/employee by operator type (US$K)
- Network operator revenues by type, % global GDP
- Network operator employees (M), and % global population
- Telco revenues and capex per sub, 2011-22
- Top 50 spending operators, annualized 2Q24 capex ($B)
- Top 50 operators based on long-term capital intensity (3Q19-2Q24 avg)
