
|
시장보고서
상품코드
1682709
혈장 분획 시장 : 기업 유형별, 사업 규모별, 제조되는 혈장 유래 치료 제품 유형별, 혈장 유래 제품 치료 영역별, 주요 지역별 - 업계 동향 및 세계 예측(-2035년)Plasma Fractionation Market by Type of Company, Scale of Operation, Type of Plasma-derived Therapeutic Products Manufactured, Therapeutic Areas of Plasma-derived Products and Key Geographical Regions : Industry Trends and Global Forecasts, Till 2035 |
||||||
세계 혈장 분획 시장 규모는 2035년까지 예측 기간 동안 9.2%의 연평균 복합 성장률(CAGR)로 확대되어 현재 48억 달러에서 2035년까지 127억 달러로 성장할 것으로 예상됩니다.
혈장 분획 시장은 주로 종양 질환, 혈액 질환, 폐 질환, 면역 질환 등 다양한 질환의 치료에서 혈장 유래 치료제에 대한 수요가 증가함에 따라 시장을 주도하고 있습니다. 혈장 분획은 면역글로블린, 알부민, 항응고인자, 프로테아제 억제제 등 주요 혈장 성분을 확실하게 분리하고 정제하는 중요한 과정입니다. 정제된 혈장 성분은 치료제의 제제화에 사용될 수 있습니다. 혈장 유래 치료제 중 면역글로불린 수요가 가장 높을 것으로 예상되는 것은 흥미롭습니다. 혈장 공급량의 제한과 적절한 규제 프레임워크의 부족은 시장 성장을 저해할 수 있는 요인으로 작용할 수 있습니다.
여러 어려움에도 불구하고, 대상 질환의 적응증 확대(특히 희귀질환 및 만성질환), 진단율 향상, 신흥 시장에서의 의료 수준 향상으로 인해 혈장분획요법의 인기가 빠르게 증가하고 있습니다. 혈장 분획 요법에 대한 수요 증가와 분획 제조 기술의 발전에 힘입어 혈장 분획 시장은 향후 주목할 만한 속도로 성장할 것으로 예상됩니다.
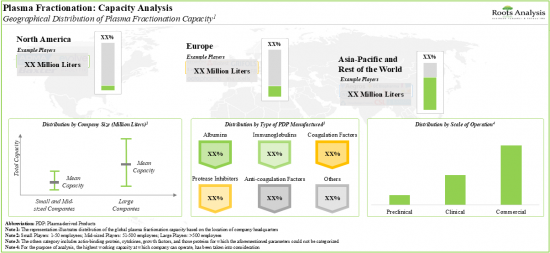
현재 혈장 유래 치료제 개발에 필요한 혈장 분획 전문 지식을 보유하고 있다고 주장하는 업체는 35개 이상이며, 그 중 50%에 가까운 업체가 선진 지역에 시설을 보유하고 있습니다. 대부분의 혈장분획업체들은 오랜 역사를 가진 업체들이며, 약 75%는 제제화 서비스를 제공할 수 있는 능력을 갖추고 있습니다. 최근 몇 년동안 이 분야에서는 제휴가 꾸준히 증가하고 있으며, 대부분 유럽에 기반을 둔 기업별 M&A가 주를 이루고 있습니다. 혈장 유래 치료제에 대한 수요가 증가함에 따라 혈장 분획 제조업체들은 다양한 지역에서 기존 역량을 확대하기 위해 투자하고 있습니다. 전 세계 혈장 분획 생산 능력의 90% 이상이 상업용 알부민과 면역글로불린 생산에 특화되어 있습니다.
효과적인 혈장 유래 치료제 개발에 대한 관심이 높아지면서 혈장 분획 시장은 향후 10년간 연평균 10% 내외의 성장이 예상됩니다.
장기적으로 면역질환에 대한 혈장 유래 치료제가 혈장 분획 시장의 주요 성장 촉진요인으로 부상할 가능성이 높으며, 아시아태평양이 가장 빠르게 성장할 것으로 예상됩니다.
세계의 혈장 분획(Plasma Fraction) 시장에 대해 조사했으며, 시장 개요와 함께 기업 유형별/사업 규모별/제조되는 혈장 유래 치료 제품 유형별/혈장 유래 제품의 치료 영역별/주요 지역별 동향, 시장 진출기업 프로파일 등의 정보를 전해드립니다.
목차
제1장 서문
제2장 주요 요약
제3장 서론
제4장 혈장 분획법 : 시장 구도
제5장 기업 경쟁력 분석
제6장 기업 개요
제7장 파트너십 및 협업
제8장 최근 확장
제9장 용량 분석
제10장 시장 규모 평가와 기회 분석
제11장 결론
제12장 주요 인사이트
제13장 부록 I : 표 형식 데이터
제14장 부록 II : 기업 및 단체 리스트
LSH 25.03.27PLASMA FRACTIONATION MARKET: OVERVIEW
As per Roots Analysis, the global plasma fractionation market is estimated to grow from USD 4.8 billion in the current year to USD 12.7 billion by 2035, at a CAGR of 9.2% during the forecast period, till 2035.
The market sizing and opportunity analysis has been segmented across the following parameters:
Type of Company
- In-house Manufacturers
- Contract Service Providers
Scale of Operation
- Preclinical
- Clinical
- Commercial
Type of Plasma-derived Therapeutic Products Manufactured
- Albumins
- Coagulation Factors
- Immunoglobulins
- Protease Inhibitors
- Other Plasma-derived Products
Therapeutic Areas of Plasma-derived Products
- Hematological Disorders
- Hepatic Disorders
- Immunological Disorders
- Neurological Disorders
- Other Disorders
Key Geographical Regions
- North America
- Europe
- Asia-Pacific
- Rest of the World
PLASMA FRACTIONATION MARKET: GROWTH AND TRENDS
The plasma fractionation market is primarily driven by the growing demand for plasma-derived therapies for treating several disease indications, such as oncological disorders, hematological disorders, pulmonary disorders and immunological disorders. Plasma fractionation is a critical step to ensure the separation and purification of key blood plasma components, such as immunoglobulins, albumins, anticoagulant factors and protease inhibitors. The refined blood plasma components can then be used for the formulation of therapeutics. It is interesting to note that among all the plasma-derived therapies, demand for immunoglobulins is anticipated to be the highest. The anticipated growth of the market can be hindered by challenges, such as limited blood plasma supply and a lack of proper regulatory framework.
Despite several challenges, owing to a broader spectrum of target disease indications (specifically rare and chronic diseases), improved diagnosis rates, and higher standards of healthcare in emerging markets, the popularity of plasma-derived therapies is rapidly increasing. Driven by the growing demand for blood plasma therapies and the ongoing advancements in fractionation manufacturing technologies, the plasma fractionation market is expected to grow at a noteworthy pace in the foreseen future.
PLASMA FRACTIONATION MARKET: KEY INSIGHTS
The report delves into the current state of the plasma fractionation market and identifies potential growth opportunities within the industry. Some key findings from the report include:
1. Currently, more than 35 companies claim to have the expertise for blood plasma fractionation, required for the development of plasma-derived therapies; of which, nearly 50% of the players have facilities in developed regions.
2. Majority of the plasma fractionators are well-established players; ~75% of the players have the capabilities for offering formulation services.
3. In recent years, the domain witnessed a steady growth in partnership activity; the majority of the initiatives were mergers and acquisitions carried out by players based in Europe.
4. Owing to the growing demand for plasma-derived therapies, plasma fractionators are investing in expanding their existing capabilities across various regions; of these, ~30% of the initiatives were undertaken in North America.
5. Over 90% of the global installed plasma fractionation capacity is dedicated to the manufacturing of albumins and immunoglobulins for commercial applications.

6. With the growing focus on the development of efficacious plasma-derived therapies, the plasma fractionation market is anticipated to witness an annualized growth of ~10%, over the next decade.

7. In the long term, the plasma-derived therapies for immunological disorders are likely to emerge as the key growth drivers of the plasma fractionation market; Asia-Pacific is anticipated to be the fastest growing region.
PLASMA FRACTIONATION MARKET: KEY SEGMENTS
In-House manufacturers Occupy the Largest Share of the Plasma Fractionation Market
Based on the type of company, the market is segmented into in-house manufacturers and contract service providers. At present, in-house manufacturers capture the highest share of the plasma fractionation market. It is worth highlighting that the plasma fractionation market for contract service providers is likely to grow at a relatively higher CAGR.
By Scale of Operation, Commercial Scale is Likely to Dominate the Plasma Fractionation Market During the Forecast Period
Based on the scale of operation, the market is segmented into preclinical, clinical and commercial scale. Currently, the commercial scale holds the highest share of the plasma fractionation market. This trend is unlikely to change in the near future.
Immunoglobulins Segment Occupies the Largest Share of the Plasma Fractionation Market
Based on the type of plasma-derived therapeutic products manufactured, the market is segmented into albumin, coagulation factors, immunoglobulins, protease inhibitors and other plasma-derived products. At present, immunoglobulins hold the maximum share of the plasma fractionation market. This trend is likely to remain the same in the forthcoming years.
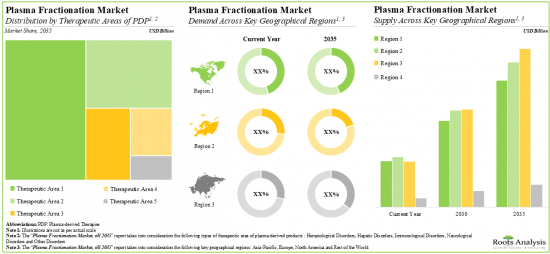
Oncological Disorders Account for the Largest Share of the Plasma Fractionation Market
Based on the therapeutic areas of plasma-derived products, the market is segmented into hematological disorders, hepatic disorders, immunological disorders, neurological disorders and other disorders. While immunological disorders account for a relatively higher market share, it is worth highlighting that neurological disorders are expected to witness substantial growth in the coming years.
Europe Accounts for the Largest Share of the Market
Based on key geographical regions, the market is segmented into North America, Europe, Asia-Pacific and Rest of the world. The majority share is expected to be captured by players based in Europe. It is worth highlighting that, over the years, the market in Asia-Pacific is expected to grow at a higher CAGR.
Example Players in the Plasma Fractionation Market
- Baxter
- Grifols
- Kedrion
- Octapharma
- CSL
- Takeda Pharmaceutical
PLASMA FRACTIONATION MARKET: RESEARCH COVERAGE
- Market Sizing and Opportunity Analysis: The report features an in-depth analysis of the plasma fractionation market, focusing on key market segments, including [A] type of company, [B] scale of operation, [C] type of plasma-derived therapeutic products manufactured, [D] therapeutic areas of plasma-derived products and [E] key geographical regions.
- Market Landscape: A comprehensive evaluation of plasma fractionation companies, considering various parameters, such as [A] year of establishment, [B] company size (in terms of number of employees), [C] location of headquarters, [D] type of company, [E] location of plasma fractionation facilities, [F] location of plasma collection facility, [F] availability of patented / proprietary technology, [G] additional fractionation capabilities, [H] scale of operation, [I] type of plasma-derived therapeutic products manufactured, [J] therapeutic areas of plasma-derived products and [K] end users.
- Company Competitiveness Analysis: A comprehensive competitive analysis of plasma fractionation companies based in North America, Europe, Asia-Pacific and rest of the world, examining factors, such as [A] company strength and [B] portfolio strength.
- Company Profiles: In-depth profiles of key plasma fractionation service providers, focusing on [A] company overviews, [B] financial information (if available), [C] plasma fractionation portfolio, [D] recent developments and [E] an informed future outlook.
- Partnerships and Collaborations: An analysis of partnerships established in this sector, since 2018, based on several parameters, such as [A] year of partnership, [B] type of partnership, [C] purpose of agreement, [D] type of plasma-derived therapeutic products manufactured, [E] type of partner, [F] most active players and [G] regional distribution of the companies involved in these agreements.
- Recent Expansions: An examination of the different expansion efforts made by plasma fractionation companies in this field to enhance their capabilities, since 2018. This analysis considers various factors, including the [A] year of expansion, [B] type of expansion, [C] type of facility, [D] location of expanded facility, [E] type of plasma-derived therapeutic products manufactured and [F] most active players.
- Capacity Analysis: Estimation of global fractionation capacity, derived from data provided by various stakeholders in the public domain. This analysis emphasizes the distribution of the available capacity on the basis of [A] company size (small, mid-sized and large), [B] type of plasma-derived therapeutic products manufactured (albumins, anti-coagulation factors, coagulation factors, immunoglobulins, protease inhibitors and other plasma-derived products), [C] scale of operation (preclinical, clinical and commercial) and [D] key geographical region (North America, Europe, Asia-Pacific and rest of the world).
KEY QUESTIONS ANSWERED IN THIS REPORT
- How many companies are currently engaged in this market?
- Which are the leading companies in this market?
- What is the annual plasma fractionation capacity?
- What kind of partnership models are commonly adopted by industry stakeholders?
- What factors are likely to influence the evolution of this market?
- What is the current and future market size?
- What is the CAGR of this market?
- How is the current and future market opportunity likely to be distributed across key market segments?
REASONS TO BUY THIS REPORT
- The report provides a comprehensive market analysis, offering detailed revenue projections of the overall market and its specific sub-segments. This information is valuable to both established market leaders and emerging entrants.
- Stakeholders can leverage the report to gain a deeper understanding of the competitive dynamics within the market. By analyzing the competitive landscape, businesses can make informed decisions to optimize their market positioning and develop effective go-to-market strategies.
- The report offers stakeholders a comprehensive overview of the market, including key drivers, barriers, opportunities, and challenges. This information empowers stakeholders to stay abreast of market trends and make data-driven decisions to capitalize on growth prospects.
ADDITIONAL BENEFITS
- Complimentary PPT Insights Packs
- Complimentary Excel Data Packs for all Analytical Modules in the Report
- 10% Free Content Customization
- Detailed Report Walkthrough Session with Research Team
- Free Updated report if the report is 6-12 months old or older
TABLE OF CONTENTS
1. PREFACE
- 1.1. Plasma Fractionation Market Overview
- 1.2. Key Market Insights
- 1.3. Scope of the Report
- 1.4. Research Methodology
- 1.5. Frequently Asked Questions
- 1.6. Chapter Outlines
2. EXECUTIVE SUMMARY
3. INTRODUCTION
- 3.1. Chapter Overview
- 3.2. Introduction to Blood Plasma
- 3.2.1. Plasma Collection
- 3.2.2. Plasma Screening
- 3.2.3. Plasma Fractionation
- 3.3. Applications of Plasma Fractionation
- 3.4. Challenges Associated with Plasma Fractionation
- 3.5. Need for Third-party Service Providers
- 3.5.1. Overview of Third-party Service Providers
- 3.6. Future Perspectives
4. PLASMA FRACTIONATION: MARKET LANDSCAPE
- 4.1. Chapter Overview
- 4.2. Plasma Fractionation: Overall Market Landscape
- 4.2.1. Analysis by Year of Establishment
- 4.2.2. Analysis by Company Size
- 4.2.3. Analysis by Location of Headquarters (Region)
- 4.2.4. Analysis by Location of Headquarters (Country)
- 4.2.5. Analysis by Year of Establishment and Location of Headquarters (Region)
- 4.2.6. Analysis by Company Size and Location of Headquarters (Region)
- 4.2.7. Analysis by Type of Company
- 4.2.8. Analysis by Location of Plasma Fractionation Facilities (Region)
- 4.2.9. Analysis by Location of Plasma Collection Facility
- 4.2.10. Analysis by Availability of Patented / Proprietary Technology
- 4.2.11. Analysis by Additional Fractionation Capabilities
- 4.2.12. Analysis by Scale of Operation
- 4.2.13. Analysis by Type of Plasma-derived Therapeutic Products Manufactured
- 4.2.14. Analysis by Therapeutic Areas of Plasma-derived Products
- 4.2.15. Analysis by End Users
- 4.2.16. Information on Plasma Fractionation Capacity and Accreditation / Certification
- 4.2.17. Information on Upcoming Plasma Fractionation Facilities
- 4.2.18. Information on Companies Previously Involved in Plasma Fractionation
5. COMPANY COMPETITIVENESS ANALYSIS
- 5.1. Chapter Overview
- 5.2. Assumptions and Key Parameters
- 5.3. Methodology
- 5.4. Company Competitiveness Analysis: In-house Manufacturers
- 5.4.1. Players based in North America and Europe
- 5.4.2. Players based in Asia-Pacific and Rest of the World
- 5.5. Company Competitiveness Analysis: In-house Manufacturers and Contract Service Providers
- 5.5.1. Players based in North America and Europe
- 5.5.2. Players based in Asia-Pacific and Rest of the World
6. COMPANY PROFILES
- 6.1. Chapter Overview
- 6.2. Companies Headquartered in North America
- 6.2.1. Baxter
- 6.2.1.1. Company Overview
- 6.2.1.2. Financial Information
- 6.2.1.3. Plasma Fractionation Portfolio
- 6.2.1.4. Recent Developments and Future Outlook
- 6.2.1. Baxter
- 6.3. Companies Headquartered in Europe
- 6.3.1. Grifols
- 6.3.1.1. Company Overview
- 6.3.1.2. Financial Information
- 6.3.1.3. Plasma Fractionation Portfolio
- 6.3.1.4. Recent Developments and Future Outlook
- 6.3.2. Kedrion
- 6.3.2.1. Company Overview
- 6.3.2.2. Financial Information
- 6.3.2.3. Plasma Fractionation Portfolio
- 6.3.2.4. Recent Developments and Future Outlook
- 6.3.3. Octapharma
- 6.3.3.1. Company Overview
- 6.3.3.2. Financial Information
- 6.3.3.3. Plasma Fractionation Portfolio
- 6.3.3.4. Recent Developments and Future Outlook
- 6.3.1. Grifols
- 6.4. Companies Headquartered in Asia-Pacific
- 6.4.1. CSL
- 6.4.1.2. Company Overview
- 6.4.1.3. Financial Information
- 6.4.1.4. Plasma Fractionation Portfolio
- 6.4.1.5. Recent Developments and Future Outlook
- 6.4.2. Takeda Pharmaceutical
- 6.4.2.1. Company Overview
- 6.4.2.2. Financial Information
- 6.4.2.3. Plasma Fractionation Portfolio
- 6.4.2.4. Recent Developments and Future Outlook
- 6.4.1. CSL
7. PARTNERSHIPS AND COLLABORATIONS
- 7.1. Chapter Overview
- 7.2. Partnership Models
- 7.3. Plasma Fractionation: Partnerships and Collaborations
- 7.3.1. Analysis by Year of Partnership
- 7.3.2. Analysis by Type of Partnership
- 7.3.3. Analysis by Year and Type of Partnership
- 7.3.4. Analysis by Purpose of Agreement
- 7.3.5. Analysis by Type of Plasma-derived Therapeutic Products Manufactured
- 7.3.6. Analysis by Type of Partner
- 7.3.7. Analysis by Year of Partnership and Type of Partner
- 7.3.8. Analysis by Type of Partnership and Type of Partner
- 7.3.9. Most Active Players: Analysis by Number of Partnerships
- 7.4. Analysis by Geography
- 7.4.1. Local and International Agreements
- 7.4.2. Intracontinental and Intercontinental Agreements
8. RECENT EXPANSIONS
- 8.1. Chapter Overview
- 8.2. Expansion Models
- 8.3. Plasma Fractionation: Recent Expansions
- 8.3.1. Analysis by Year of Expansion
- 8.3.2. Analysis by Type of Expansion
- 8.3.3. Analysis by Year and Type of Expansion
- 8.3.4. Analysis by Type of Facility
- 8.3.5. Analysis by Location of Expanded Facility
- 8.3.6. Analysis by Year and Location of Expanded Facility
- 8.3.7. Analysis by Plasma-derived Therapeutic Products Manufactured
- 8.3.8. Most Active Players: Analysis by Number of Expansions
9. CAPACITY ANALYSIS
- 9.1. Chapter Overview
- 9.2. Key Assumptions and Methodology
- 9.2.1. Annual Plasma Fractionation Capacity
- 9.2.1.1. Analysis by Company Size
- 9.2.1.2. Analysis by Type of Plasma-derived Therapeutic Products Manufactured
- 9.2.1.3. Analysis by Scale of Operation
- 9.2.2. Analysis by Location of Plasma Fractionation Facility
- 9.2.3. Analysis by Location of Headquarters
- 9.2.1. Annual Plasma Fractionation Capacity
- 9.3. Concluding Remarks
10. MARKET SIZING AND OPPURTUNITY ANALYSIS
- 10.1. Chapter Overview
- 10.2. Key Assumptions and Forecast Methodology
- 10.3. Global Plasma Fractionation Market (Historical, Base and Forecasted Scenario), 2017-2035
- 10.3.1. Plasma Fractionation Market: Distribution by Type of Company, 2017, 2023 and 2035
- 10.3.1.1. Plasma Fractionation Market for In-house Manufacturers, till 2035
- 10.3.1.2. Plasma Fractionation Market for Contract Service Providers, till 2035
- 10.3.2. Plasma Fractionation Market: Distribution by Scale of Operation, 2017, 2023 and 2035
- 10.3.2.1. Plasma Fractionation Market for Preclinical, till 2035
- 10.3.2.2. Plasma Fractionation Market for Clinical, till 2035
- 10.3.2.3. Plasma Fractionation Market for Commercial, till 2035
- 10.3.3. Plasma Fractionation Market: Distribution by Type of Plasma-derived Therapeutic Products Manufactured, 2017, 2023 and 2035
- 10.3.3.1. Plasma Fractionation Market for Albumins, till 2035
- 10.3.3.2. Plasma Fractionation Market for Coagulation Factors, till 2035
- 10.3.3.3. Plasma Fractionation Market for Immunoglobulins, till 2035
- 10.3.3.4. Plasma Fractionation Market for Protease Inhibitors, till 2035
- 10.3.3.5. Plasma Fractionation Market for Other Plasma-derived Products, till 2035
- 10.3.4. Plasma Fractionation Market: Distribution by Therapeutic Areas of Plasma-derived Products, 2017, 2023 and 2035
- 10.3.4.1. Plasma Fractionation Market for Hematological Disorders, till 2035
- 10.3.4.2. Plasma Fractionation Market for Hepatic Disorders, till 2035
- 10.3.4.3. Plasma Fractionation Market for Immunological Disorders, till 2035
- 10.3.4.4. Plasma Fractionation Market for Neurological Disorders, till 2035
- 10.3.4.5. Plasma Fractionation Market for Other Disorders, till 2035
- 10.3.5. Plasma Fractionation Market: Distribution by Demand across Key Geographical Regions, 2017, 2023 and 2035
- 10.3.5.1. Plasma Fractionation Market in North America, till 2035
- 10.3.5.2. Plasma Fractionation Market in Europe, till 2035
- 10.3.5.3. Plasma Fractionation Market in Asia-Pacific, till 2035
- 10.3.5.4. Plasma Fractionation Market in Rest of the World, till 2035
- 10.3.6. Plasma Fractionation Market: Distribution by Supply across Key Geographical Regions, 2017, 2023 and 2035
- 10.3.6.1. Plasma Fractionation Market in North America, till 2035
- 10.3.6.2. Plasma Fractionation Market in Europe, till 2035
- 10.3.6.3. Plasma Fractionation Market in Asia-Pacific, till 2035
- 10.3.6.4. Plasma Fractionation Market in Rest of the World, till 2035
- 10.3.1. Plasma Fractionation Market: Distribution by Type of Company, 2017, 2023 and 2035

