


|
시장보고서
상품코드
1920861
세포 치료 제조 시장(제7판) : 동향과 예측(-2035년) - 세포 치료 유형별, 세포 유래별, 사업 규모별, 제조자 유형별, 지역별Cell Therapy Manufacturing Market (7th Edition): Trends and Forecast Till 2035 - Distribution by Type of Cell Therapy, Source of Cells, Scale of Operation, Type of Manufacturer, and Geography |
||||||
세포 치료 제조 시장 : 개요
Roots Analysis의 조사에 따르면 세포 치료 제조 시장 규모는 2035년까지 예측기간에 걸쳐 CAGR 7.7%의 성장을 보일 것으로 예상되고, 현재 71억 7,200만 달러에서 2035년까지 140억 1,700만 달러에 이를 것으로 추정되고 있습니다.
세포 치료 제조 시장 - 성장과 동향
수년간 수많은 기술 혁신과 발견이 의학 분야를 변화시켜 왔습니다. 주목할 만한 발전 중 하나는 상당한 치료 가능성을 보여주고 있으며 기존 약리학적 치료와 관련된 많은 독성 문제에서 대체로 자유로운 세포 기반 치료법의 등장입니다. 연구자들은 광범위한 질병 적응증을 대상으로 1,000개 이상의 세포 및 유전자 치료 후보 물질을 탐구하고 있습니다. 이 중 약 45개의 세포 기반 치료법이 이미 전 세계 다양한 규제 기관의 승인을 받았습니다. 또한 여러 기관들이 제조 과제를 해결하고 이러한 혁신적 치료법의 지속적인 성공을 보장하기 위한 계획을 시행 중입니다.
세포 및 유전자 치료제 제조는 면역 세포(T세포 및 줄기세포 포함)의 분리, 변형, 증식 등 여러 핵심 단계를 포함하며, 세심하게 통제된 무오염 환경에서 이루어지는 복잡한 과정입니다. 각 단계마다 최종 제품의 안전성과 효능을 보장하기 위해 특수 밀폐 시스템 사용과 규제 기준의 엄격한 준수가 요구됩니다. 기업들은 세포 취급 및 처리 장비 개선, 보조 재료 및 세포 계수 기술 향상, 현재의 물류 과제 해결에 주력하고 있습니다. 결과적으로, 세포 치료제 개발사들은 이러한 첨단 치료 후보 물질 생산 과정에서 발생하는 인적 오류 관련 위험을 완화하기 위해 유연하고 자동화된 기술에 투자하는 것이 점점 더 중요해지고 있습니다. 이러한 개선은 기업들이 제품의 품질과 일관성을 유지하면서 비용을 관리 가능한 수준으로 유지하는 데 도움이 될 것으로 기대됩니다.
성장 촉진요인 : 시장 확대의 전략적 기반
세포 치료 분야는 임상 시험 증가와 규제 승인 확대를 특징으로 하는 급속한 성장을 경험하고 있습니다. 초기 연구 단계에서 후기 임상 시험 단계로 진전하는 치료법이 증가함에 따라 환자들은 이러한 치료법에 접근할 기회가 더 많아지고 있습니다. 미국 유전자 및 세포 치료 학회(ASGCT) 보고서에 따르면, 현재 유전자, 세포, RNA 치료 파이프라인을 합쳐 4,418개의 활성 프로그램이 진행 중이며, 이 중 2,155개는 유전자 치료, 966개는 비유전자 변형 세포 치료입니다. 또한 79개의 새로운 유전자 치료 임상 시험(57%가 종양학에 집중)과 27개의 RNA 치료 임상 시험이 진행 중입니다. 및 RNA 치료 파이프라인에 총 4,418개의 활성 프로그램이 존재하며, 이 중 2,155개는 유전자 치료, 966개는 비유전자 변형 세포 치료입니다. 또한 해당 분기 동안 79건의 신규 유전자 치료 시험(57%가 종양학 분야)과 27건의 신규 세포 치료 시험(74%가 비종양학 분야)이 시작되었습니다. 이러한 진전은 세포 치료를 위한 현지 제조 시설 설립으로 더욱 가속화될 것입니다.
시장의 과제 : 진전을 막는 심각한 장벽
강력한 수요에도 불구하고, 세포 치료제 제조 부문은 세포 기반 치료 제품을 실험실 규모에서 임상 규모로 확대하는 데 여러 가지 어려움을 겪고 있습니다. 이러한 장애물에는 숙련된 인력 부족, 규제 준수 문제, 그리고 충분하지 않은 첨단 시설 및 인프라가 포함됩니다. 세포 치료제 제조 공정은 제품 무결성과 규정 준수를 보장하기 위해 무균 상태의 고급 클린룸과 엄격한 격리 수준 모니터링을 필요로 합니다. 이러한 복잡한 절차로 인해 세포 치료제 제조의 규모 확대는 상당히 어려울 수 있습니다.
세포 치료 제조 시장 : 주요 인사이트
이 보고서는 세포 치료 제조 시장의 현재 상태를 상세하게 분석하고 업계 내 잠재적 성장 기회를 확인합니다. 보고서의 주요 지식은 다음과 같습니다.
- 현재 약 200개의 업계 관계자가 세포 치료 제조에 종사하고 있으며, 그 중 약 45%의 기업이 미국에 본사를 두고 있습니다.
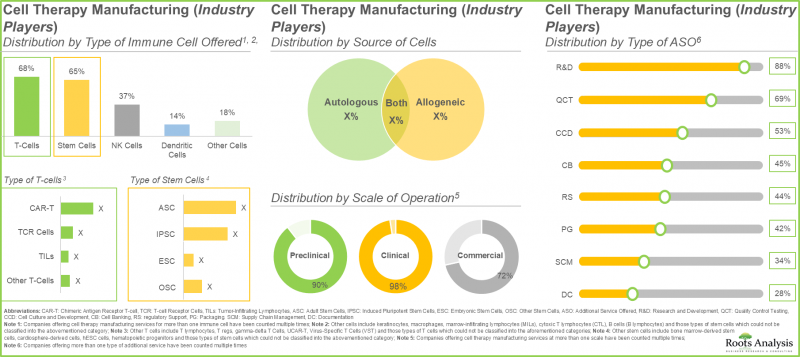
- 업계 관계자의 40% 이상이 세포와 줄기 세포를 모두 제공합니다. 이는 T세포가 거부반응의 위험이 낮은 반면 줄기세포는 손상된 세포나 조직을 재생 및 수리하는 독자적인 능력이 있기 때문입니다.
- 현재 80개가 넘는 비업계 진출기업이 세포 치료 제조에 종사하고 있으며, 그 중 약 55%가 미국에 본사를 두고 있습니다.
- 비업계의 세포 치료 제조기업의 약 30%는 2001년 이전에 설립되었으며, 그 중 60% 이상의 기업이 자기유래세포와 타가유래세포 모두를 활용하고 있습니다.
- 현재까지 면역 세포 치료제를 평가하는 여러 임상 시험이 등록되었으며, 이들 연구의 대부분(65%)은 아시아-태평양 지역의 다양한 시험 현장에서 수행되었습니다.
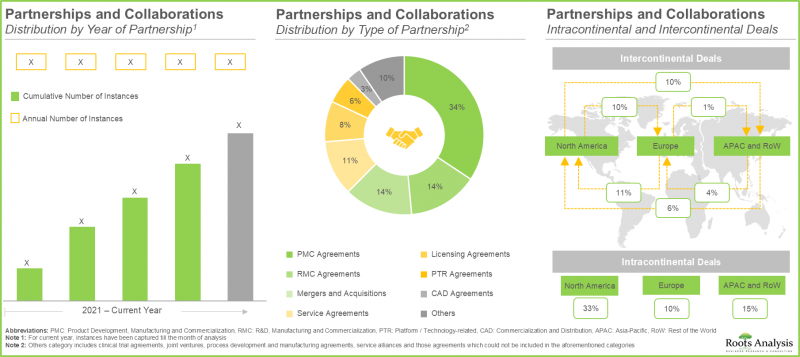
- 최근 다양한 이해관계자 간 체결된 다각적 파트너십은 이 시장에 대한 관심 증가를 반영합니다. 실제로 2022년 이후 체결된 거래가 전체의 55% 이상을 차지합니다.
- 업계 관계자의 70%가 새로운 시설의 설립에 의해 기존의 생산 능력과 기술력을 확대하고 있으며, 40% 이상의 시설이 T세포의 제조에 특화하고 있습니다.
- 이 분야에서 주요 주요 제약 기업의 노력의 55% 이상은 제휴 및 공동 연구를 통해 추진되고 있습니다. 그 중 상당한 비율은 Bristol-Myers Squibb에 의해 수행되었습니다.
- 현재 가동중인 세포 치료제조능력(클린룸수 기준)의 약 95%는 업계 관계자가 보유하고 있으며, 최대 규모의 설비는 북미에 설치되어 있습니다.
- 세포 기반 치료법에 대한 수요 증가는 제품 승인 증가, 치료법 진보, 의료 인프라 확대, 환자 의식 증가로 인한 것입니다.
- 세포 치료 제조분야는 높은 자본비용과 첨단기술로 CAGR8.25%로 성장이 예상되고 있습니다. 제조 활동의 약 60%는 CMO(수탁 제조 기관)에 대한 외부 위탁이 예상됩니다.
- 암 유병률 증가, 맞춤형 세포 치료에 대한 환자 선호도 변화, 세포 치료 제조 기술 발전으로 인해 시장은 향후 꾸준한 성장이 예상됩니다.
- 북미 지역은 기술 혁신이 빠르게 진행되고 있어 올해 세포 치료 제조 시장에서 상당한 점유율을 차지할 것으로 전망됩니다.
- 미국 주요 기업들이 개발한 승인된 세포 치료제의 성공에 힘입어 상업적 세포 치료제 제조 시장은 연평균 복합 성장률(CAGR) 12.93%로 성장할 것으로 전망됩니다.
- 임상적 급속한 성공과 세포 치료에 대한 수요가 증가하고, 또한 혈액암과 같은 질병 치료에 대한 광범위한 가능성을 고려하면, 이 업계는 미래 성장을 위해 좋은 위치에 있다고 말할 수 있습니다.
세포 치료 제조 시장
시장 규모 및 기회 분석은 다음 매개 변수별로 세분화됩니다.
세포 치료 유형별
- CAR-T세포 치료
- 줄기세포 치료
- TCR 치료
- TIL 치료
- 수지상 세포 치료
- 기타
세포 유래별
- 자가 세포
- 동종 세포
- 미지정 세포
사업 규모별
- 임상 규모
- 상업 규모
제조업체 유형별
- 자사 제조 제조업체
- 수탁 제조 기관
지역별
- 북미
- 미국
- 캐나다
- 유럽
- 프랑스
- 독일
- 이탈리아
- 스페인
- 영국
- 기타
아시아태평양 및 기타 지역
- 아르헨티나
- 호주
- 브라질
- 중국
- 인도
- 이스라엘
- 일본
- 싱가포르
- 남아프리카
- 한국
- 대만
세포 치료 제조 시장 : 주요 부문
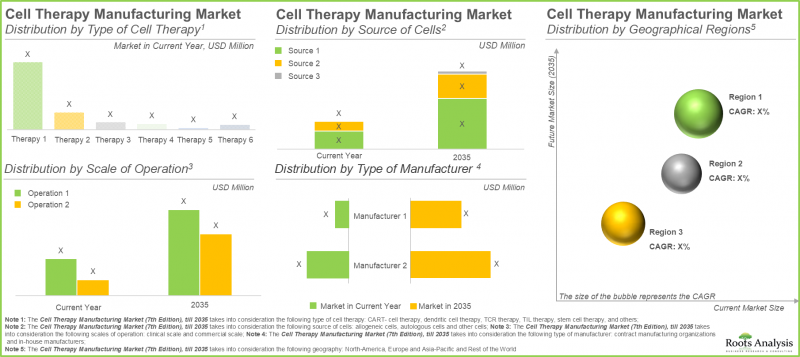
CAR-T세포 치료은 세포 치료 제조 시장에서 가장 큰 점유율을 차지합니다.
올해 CAR-T세포 치료제 부문은 더 적은 수의 주입이 필요한 짧은 치료 요법 덕분에 가장 큰 시장 점유율(약 65%)을 차지하고 있습니다. 또한, 자연살해세포 치료제 및 유전자 변형 세포 치료제를 포함하는 기타 세포 치료제 부문은 예측 기간 동안 16.15%의 더 높은 연평균 복합 성장률(CAGR)을 보일 것으로 예상됩니다. NK 세포의 우수한 안전성 프로파일은 이식편대숙주병(GVHD)과 같은 상태의 위험을 줄입니다. 또한 즉시 사용 가능한 치료제로 기능할 수 있는 잠재력이 이러한 성장을 촉진합니다.
자가 세포가 세포 치료 제조 시장에서 가장 큰 점유율을 차지
2035년까지 자가 세포 부문은 세포 치료제 제조 시장의 50% 이상을 차지하며 더 큰 비중을 유지할 것으로 전망됩니다. 또한 이 부문은 예측 기간 내내 상당한 성장률을 보일 것으로 예상됩니다. 이는 주로 자가 세포 치료제 제조가 환자의 자체 세포에 초점을 맞추어 이식편대숙주병과 같은 심각한 합병증을 유발할 수 있는 면역 거부 반응 위험을 최소화하기 때문입니다.
북미가 최대 점유율을 확보하고 시장을 독점
당사의 시장 전망에 따르면, 북미는 2025년까지 약 45%를 차지하며 세포 치료제 제조 시장의 최대 점유율을 유지할 것으로 예상됩니다. 또한 북미는 2035년까지 9.70%의 비교적 빠른 성장률을 보일 것으로 전망됩니다. 이 시장의 약 60%가 임상 세포 치료제 제조에서 비롯된다는 점을 강조할 필요가 있습니다. 임상 세포 치료제 제조 부문에서 미국은 혁신 친화적인 규제 체계와 고도로 숙련된 인력에 힘입어 제조업체들의 중심 허브로 부상했습니다. 이러한 지역적 집중은 초기 개발 단계부터 상업적 공급에 이르기까지 세포 치료제 생산의 효율적인 확장을 가능하게 합니다.
세포 치료 제조 시장의 대표적인 진출기업
- Advanced Therapies
- AGC Biologics
- Astellas Pharma
- Catalent
- Charles River Laboratories
- City of Hope
- Clinical Cell and Vaccine Production Facility(CVPF)
- Evotec
- Fraunhofer Institute for Cell Therapy and Immunology
- ImmunityBio
- Lonza
- Merck Millipore
- Miltenyi Biotec
- Minaris Advanced Therapies
- Newcastle Advanced Therapies
- NHS Blood and Transplant
- OBiO Tech
- Pharmaron
- Rayne Cell Therapy Suite
- Resilience
- Sartorius
- Scottish National Blood Transfusion Service(SNBTS) Celular Therapy Facility
- SK pharmteco(Subsidiary of SK Inc.)
- Takara Bio
- Thermo Fisher Scientific
세포 치료 제조 시장 : 조사 범위
- 시장 규모와 기회 분석 : 본 보고서에서는 세포 치료 제조 시장에 대해 (A) 세포 치료 유형, (B) 세포 유래, (C) 조업 규모, (D) 제조자 유형, (E) 지리적 지역 등 주요 시장 부문에 초점을 맞춘 상세한 분석을 제공합니다.
- 업계 진출기업 - 시장 상황 1 : 세포 치료 제조 분야에 종사하는 기업별 현재 시장 상황에 대한 상세한 개요를, (A) 설립년, (B) 기업 규모, (C) 본사 재료지, (D) 제조 시설의 재료지, (E) 제공되는 면역 세포 유형, (F) 세포 유래, (G) 사업 규모, (H) 제공되는 추가 서비스 유형 등의 정보를 포함.
- 비업계 진입기업 - 시장정세 2 : 세포치료 제조분야에서의 비업계 진입기업의 현재 시장정세에 대한 상세한 개요와 다음 관련 파라미터에 관한 정보 : (A) 설립년(B) 기업규모(C) 본사 재료지(D) 제조시설재료지(E) 제공 면역세포 유형(F) 세포유래(G) 사업 규모(H) 제공 추가서비스 유형
- 규제 상황 : 북미(미국 중심), 유럽, 아시아(일본·중국 중심) 등 각 지역에서의 세포 치료 제조 관련 규제 개요. 세계 각국의 주요 규제기관으로부터 제조시설에 부여되는 다양한 인증·인가의 분석을 포함합니다.
- 사례 연구 1 : 세포 치료 제조 공정의 추진 전략을 제공하기 위해 세계 각국의 기관이 발표한 다양한 로드맵의 개요.
- 사례 연구 2 : 폐쇄 시스템 및 단일 사용 시스템을 활용한 현행 제조 공정 최적화에서 기술 자동화의 구체적인 역할에 대해 자세히 설명합니다. 또한 자동화 장치 개발 단계를 보여주는 로드맵을 두 가지 사례 연구를 바탕으로 소개합니다.
- 기업 프로파일 : 북미, 유럽, 아시아태평양에서 세포 치료 제조에 종사하는 주요 업계 관계자 및 비 업계 관계자의 상세한 프로파일을 (A) 설립년, (B) 본사 재료지, (C) 제품 포트폴리오, (D) 최근 동향, (E) 미래 전망에 따라 제공합니다.
- 임상시험 분석 : 완료, 진행중, 계획중인 임상시험을 시험등록년, 등록환자수, 시험상황, 시험단계, 환자의 성별, 연구디자인, 할당방식, 개입모델, 맹검화 유형, 스폰서/협력자 유형, 임상시험 실시수에 기초한 주요 진입기업, 시험의 지리적 분포 등 여러 관련 파라미터에 기초하여 분석합니다.
- 제휴?협력관계 : 세포치료 제조업체간에 체결된 제휴?협력관계에 대해, 제휴년, 제휴형태, 제공면역세포 유형, 사업 규모, 제휴건수에 근거한 주요 참가기업 등, 복수의 관련 파라미터에 근거한 상세한 분석을 실시합니다. 본 장에서는 해당 시장에서의 제휴 활동의 지역별 분포에 대해서도 다룹니다.
- 최근 확장 동향 : 해당 분야에서 보고된 확장 계획의 상세한 분석에 더하여 (A) 확장 실시년, (B) 확장 진행 상황, (C) 확장 유형, (D) 시설 위치, (E) 투자액, (F) 제공되는 면역 세포 유형, (G) 제공되는 서비스 유형, (H) 가장 활발한 진출기업 등 여러 관련 매개변수에 기초한 분석을 실시합니다.
- 대기업 제약 기업의 노력 : 대기업 제약 기업이 실시한 세포 치료 제조에 초점을 맞춘 다양한 노력에 대해 (A) 노력 실시 연도, (B) 노력 유형, (C) 노력 건수, (D) 제휴 유형, (E) 제휴 건수, (F) 시설 확장 유형, (G) 시설 확장 수, (H) 시설 확장 지역, (I) 합병·인수 수, (J) 자금 조달·투자 수, (K) 제공되는 면역 세포 유형, (L) 사업 규모.
- 생산 능력 분석 : 세포 치료 생산의 총 장비 용량에 대한 추정치입니다. 공개 정보에 근거하여 이해관계자로부터 보고된 정보를 바탕으로 산출되어 클린룸 면적 및 클린룸 수에 있어서 이용 가능한 용량의 분포를 밝힙니다.
- 수요 분석 : 세포 치료의 연간 상업 수요 및 임상 수요에 대한 정보를 기반으로 한 추정치. 다음 관련 매개변수를 횡단적으로 분석 : (A) 세포 치료 유형, (B) 주요 지리적 지역.
- 원가 분석 : 세포 치료의 가격에 영향을 줄 수있는 다양한 요인의 상세한 분석. 제조업체가 자사 제품의 가격을 결정하기 위해 채택하는 다양한 모델/접근 방식을 특징으로합니다.
- 자사 제조 또는 외부 위탁 여부의 의사 결정의 틀 : 세포 치료 개발자가 자사 제품을 자사 제조할지, CMO(수탁 제조 기관)의 서비스를 이용할지를 결정할 때 고려해야 할 다양한 요소를 밝히는 정성 분석.
- 총소유비용 : 세포 치료 제조 조직을 대상으로 기업 규모에 따른 20년간 총소유비용의 상세한 분석.
- SWOT 분석 : 강점, 약점, 기회, 위협에 대해 논의하고 각 SWOT 매개변수가 시장 역학에 미치는 상대적인 영향을 밝힙니다.
목차
제1장 서문
제2장 조사 방법
제3장 시장 역학
- 장의 개요
- 예측 조사 방법
- 시장 평가 프레임워크
- 예측 도구와 기법
- 중요한 고려 사항
- 제한 사항
제4장 거시경제지표
제5장 주요 요약
제6장 소개
- 장의 개요
- 세포치료 입문
- 세포 치료 제조의 개요
- 세포 치료 제조 모델
- 세포 치료 제조 공정의 확장성
- 세포 치료 제조업체 유형
- 세포 치료제의 제조에 있어서 주요 과제
- 세포 치료의 제조에 영향을 미치는 주요 요인
- 세포 치료 제조의 자동화
- 세포 치료 제조 공급망
- 장래의 전망
제7장 세포 치료 제조업체(업계 참가 기업) : 시장 상황
- 장의 개요
- 업계 진출기업 : 시장 상황
제8장 세포치료 제조업체(비업계 참가기업) : 시장 상황
- 장의 개요
- 비업계 진출기업 : 시장 상황
제9장 규제 상황
- 장의 개요
- 현재 시나리오
- 세포 치료제 제조에 관한 규제 당국
- 세포 치료의 초기 단계 제조에 관한 가이드 라인 요약
- 세포 치료의 초기 단계에서 기존 과제
- 지역별 규제 가이드라인의 변동
제10장 사례 연구 : 세포 치료 제조와 관련된 과제를 극복하기 위한 로드맵
- 장의 개요
- 미국 로드맵
- 다른 지역의 로드맵
제11장 사례 연구 : 세포 치료 제조의 자동화 기술
- 장의 개요
- 세포 치료 제조 공정의 자동화
- 성장의 원동력과 장애
- 사례 연구
제12장 기업 프로파일 업계 진출기업
- 장의 개요
- 북미의 서비스 제공업체
- AGC Biologics
- Catalent
- Charles River Laboratories
- ImmunityBio
- Merck Millipore
- Minaris Advanced Therapies
- Resilience
- SK pharmteco(Subsidiary of SK Inc.)
- Thermo Fisher Scientific
- 유럽의 서비스 제공업체
- Evotec
- Lonza
- Miltenyi Biotec
- Sartorius
- 아시아태평양의 서비스 제공업체
- Astellas Pharma
- OBiO Tech
- Pharmaron
- Takara Bio
제13장 기업 프로파일 : 업계외 기업
- 장의 개요
- City of Hope
- Clinical Cell and Vaccine Production Facility(CVPF)
- Fraunhofer Institute for Cell Therapy and Immunology
- Newcastle Advanced Therapies
- NHS Blood and Transplant
- Rayne Cell Therapy Suite(King's College London)
- Scottish National Blood Transfusion Service(SNBTS) Celular Therapy Facility
제14장 세포 치료 제조의 비영리단체
- 장의 개요
- 세포 치료 제조 : 비영리단체
- 세포 치료 제조 : 국제학회
제15장 임상시험 분석
- 장의 개요
- 범위와 조사 방법
- 세포치료 : 임상시험 분석
제16장 파트너십 및 협업
제17장 최근 확장
- 장의 개요
- 확장 유형
- 세포 치료 제조 : 최근 확대
제18장 대기업 제약회사의 대처
- 장의 개요
- 세포 치료제 제조 : 주요 제약 기업 목록
- 세포 치료제 제조 : 대기업 제약 기업별 대처 일람
제19장 용량 분석
제20장 수요 분석
제21장 원가 분석
- 장의 개요
- 세포치료의 고가격화에 기여하는 요인
- 세포 치료의 가격 모델
- 세포치료비용 최적화
- 세포 치료 수탁 제조 조직의 역할
- 세포 치료의 상환에 관한 고려 사항
제22장 제조 또는 구입의 의사결정 틀
- 장의 개요
- 전제 및 주요 파라미터
- 세포 치료제의 제조 : 제조 또는 구입 여부 의사 결정
제23장 세포 치료 제조 조직의 총소유비용
제24장 SWOT 분석
제25장 조사 분석
제26장 세계의 세포 치료 제조 시장
제27장 세포 치료 제조 시장(세포 치료 유형별)
제28장 세포 치료 제조 시장(세포 유래별)
제29장 세포 치료 제조 시장(사업 규모별)
제30장 세포 치료 제조 시장(제조업체 유형별)
제31장 세포 치료 제조 시장(지역별)
제32장 세포 치료 제조 시장의 기회 분석 : 북미
제33장 세포 치료 제조 시장의 기회 분석 : 유럽
제34장 세포 치료 제조 시장의 기회 분석 : 아시아태평양 및 기타 지역
제35장 결론
제36장 주요 인사이트
제37장 부록 I : 테이블 데이터
제38장 부록 II : 기업 및 조직 목록
HBR 26.02.10Cell Therapy Manufacturing Market: Overview
As per Roots Analysis, the cell therapy manufacturing market is estimated to grow from USD 7,172 million in the current year to USD 14,017 million by 2035, at a CAGR of 7.7% during the forecast period, till 2035.
Cell Therapy Manufacturing Market: Growth and Trends
Over the years, numerous technological innovations and discoveries have transformed the field of medicine. One notable advancement is the emergence of cell-based therapies, which have shown substantial therapeutic promise and are largely free from many of the toxicity issues linked to traditional pharmacological treatments. Researchers are exploring over 1,000 cell and gene therapy candidates targeting a wide range of disease indications. Of these, approximately 45 cell-based therapies have already received approval from various global regulatory agencies. In addition, several organizations are implementing initiatives to tackle manufacturing challenges and ensure the ongoing success of these innovative therapies.
The manufacturing of cell and gene therapies is a complex process that occurs in a meticulously controlled, contamination-free environment and involves multiple critical stages, such as isolating, modifying, and expanding immune cells, including T-cells and stem cells. Each of these stages demand the use of specialized closed systems and rigorous compliance with regulatory standards to guarantee the safety and effectiveness of the final products. Companies are focused on enhancing cell handling and processing equipment, improving ancillary materials and cell counting techniques, and addressing current logistical challenges. Consequently, it is becoming increasingly essential for cell therapy developers to invest in flexible and automated technologies to mitigate the risks associated with human error during the production of these advanced therapeutic candidates. These improvements are expected to help companies maintain quality and consistency of products while keeping costs manageable.
Growth Drivers: Strategic Enablers of Market Expansion
The field of cell therapy is experiencing rapid growth, characterized by an increase in clinical trial and a rise in regulatory approvals. With a greater number of therapies advancing from initial research to late-stage clinical trials, patients have more opportunities to access these treatments. A report from the American Society of Gene & Cell Therapy (ASGCT) indicates that there are currently 4,418 active programs in the combined gene, cell, and RNA therapy pipeline, comprising 2,155 gene therapies and 966 non-genetically modified cell therapies, along with 79 new gene therapy trials (57% focused on oncology) and 27 new cell therapy trials (74% in non-oncology) that were initiated during that quarter. This progress will be bolstered by the establishment of local manufacturing facilities for cell therapies.
Market Challenges: Critical Barriers Impeding Progress
Despite strong demand, the cell therapy manufacturing sector faces multiple challenges in moving cell-based therapy products from the lab to clinical scale. These obstacles include a shortage of skilled workers, regulatory compliance issues, and insufficient advanced facilities and infrastructure. The manufacturing processes for cell therapy necessitate sterile, high-grade clean rooms and strict monitoring of containment levels to ensure product integrity and compliance. Due to these intricate procedures, scaling up cell therapy manufacturing can be considerably difficult.
Cell Therapy Manufacturing Market: Key Insights
The report delves into the current state of the cell therapy manufacturing market and identifies potential growth opportunities within industry. Some key findings from the report include:
- Currently, close to 200 industry players are engaged in cell therapy manufacturing; of these, ~45% of players are headquartered in the US.

- More than 40% of industry players offer both T-cells and stem cells, as T-cells have a lower risk of rejection while stem cells possess a unique ability to regenerate or repair damaged cells and tissues.
- More than 80 non-industry players are currently engaged in the manufacturing of cell therapies; around 55% of these players are based in the US.
- ~30% of the non-industry cell therapy manufacturers were established before 2001; among these, more than 60% of players utilize both autologous and allogeneic source of cells.
- Several clinical trials evaluating immune cell therapies have been registered till date; majority (65%) of these studies have been conducted across various trial sites in Asia-Pacific.
- The rising interest in this market is reflected from the diverse partnerships established among various stakeholders in the recent past; in fact, >55% of the deals have been inked post 2022.

- 70% of the industry players have expanded their existing capacities and capabilities through establishment of new facilities; more than 40% facilities are dedicated to manufacturing of T cells.
- Over 55% of major big pharma initiatives in this domain have been pursued through partnerships and collaborations; of these, a sizeable proportion of the initiatives were undertaken by Bristol-Myers Squibb.
- ~95% of the current installed cell therapy manufacturing capacity (in terms of number of cleanrooms) is presently available with industry players; maximum capacity is installed in facilities based in North America.
- The rising demand for cell-based therapies stems from increasing product approvals, advancing therapies, expanding healthcare infrastructure, and growing patient awareness.
- The cell therapy manufacturing domain is poised to grow at a CAGR of 8.25%, owing to high capital costs and advanced technologies; ~60% of manufacturing activities are expected to be outsourced to CMOs.

- Owing to the rising prevalence of cancer, and shift in patient preferences towards tailored cell therapies and advancements in cell therapy manufacturing technologies, the market is poised for a steady growth in the future.
- North America is expected to capture a significant share of the cell therapy manufacturing market in the current year owing to rapid innovation of technologies within the region.
- Driven by the success of approved cell therapies developed by prominent players in the US, the commercial cell therapy manufacturing market is expected to grow at CAGR of 12.93%.
- Given the rapid clinical success and rising demand for cell therapies, coupled with their extensive potential in treating disorders like blood cancer, the industry is well-positioned for future growth.
Cell Therapy Manufacturing Market
The market sizing and opportunity analysis has been segmented across the following parameters:
By Type of Cell Therapy
- CAR-T Cell Therapy
- Stem Cell Therapy
- TCR Therapy
- TIL Therapy
- Dendritic Cell Therapy
- Others
By Source of Cells
- Autologous Cells
- Allogeneic Cells
- Unspecified Cells
By Scale of Operation
- Clinical Scale
- Commercial Scale
By Type of Manufacturer
- In-house Manufacturers
- Contract Manufacturing Organizations
By Geographical Regions
- North America
- US
- Canada
- Europe
- France
- Germany
- Italy
- Spain
- UK
- Rest of Europe
Asia-Pacific and Rest of the World
- Argentina
- Australia
- Brazil
- China
- India
- Israel
- Japan
- Singapore
- South Africa
- South Korea
- Taiwan
Cell Therapy Manufacturing Market: Key Segments
CAR-T Cell Therapies Accounts for the Largest Share in the Cell Therapy Manufacturing Market
In the present year, the CAR-T cell therapies segment holds the largest market share (approximately 65%), attributed to the shorter treatment regimen that requires fewer infusions. Further, the segment of other cell therapies, which includes natural killer cell therapies and gene-modified cell therapies, is anticipated to experience a higher compound annual growth rate (CAGR) of 16.15% throughout the forecast period. The favorable safety profile of NK cells reduces the risk of conditions such as graft-versus-host disease. Additionally, their potential to function as off-the-shelf therapies propels this growth.
Autologous Cells Hold the Highest Share in the Cell Therapy Manufacturing Market
In 2035, the autologous segment is projected to hold a larger share of the cell therapy manufacturing market, accounting for over 50%. Additionally, this segment is expected to experience a notable growth rate throughout the forecast period. This can be attributed mainly to the focus of autologous cell therapy manufacturing on the patient's own cells, which minimizes the risk of immune rejection that can result in severe complications such as graft-versus-host disease.
North America Dominates the Market by Securing Highest Share
Based on our market forecast, North America is expected to hold the largest share of the cell therapy manufacturing market, accounting for approximately 45% by 2025. Further, we anticipate that North America will experience a comparatively faster growth rate of 9.70% until 2035. It is important to highlight that around 60% of this market derives from clinical cell therapy manufacturing. In the clinical cell therapy manufacturing sector, the U.S. has become a central hub for manufacturers, bolstered by their innovation-friendly regulatory framework and highly qualified workforce. This regional concentration enables efficient scaling of cell therapy production, from initial development stages to commercial supply.
Primary Research Overview
The opinions and insights presented in the market report were also influenced by discussions held with senior stakeholders in the industry. The market report includes detailed transcripts of interviews conducted with the following individuals:
- Marketing Manager, Cell Therapy, Mid-sized Company, Australia
- Director, UK
- Marketing Director, Small Company, Belgium
- Management Board Vice-President, Large Company, Poland
- Senior Director of Sales Advanced Therapies; Vice President of Marketing, Small Company, US
- Business Administration Department Manager, Mid-sized Company, Japan
- Chief Business Officer, Small Company, Netherlands
- Director of Finance and Facility Operations, US
- Senior Director, Very Large Company, Japan
- Chief Executive Officer, Mid-sized Company, UK
- Former Chief Technical Officer, Large Company, US
- Former Chief Executive Officer, Small Company, Netherlands
- Former General Manager, Small Company, France
- Chief Executive Officer, Large Company, China
- Executive Vice President Research and Development, Small Company, Israel
- Former Business Development Manager, Mid-sized Company, UK
- Professor and American Red Cross Chair in Transfusion Medicine, US
- Former Co-Founder and Chief Executive Officer, Small Company, Singapore
- Former Manager, Business Development and Operations-cGMP Manufacturing Unit, Mid-sized Company, Canada
- Manager of Business Development, Small Company, US
- Former Department Leader, Cell Therapy Innovation and Development, Mid-sized Company, France
- Former Chief Executive Officer, Mid-sized Company, Australia
- Chief Executive Officer, Small Company, Netherlands
Example Players in Cell Therapy Manufacturing Market
- Advanced Therapies
- AGC Biologics
- Astellas Pharma
- Catalent
- Charles River Laboratories
- City of Hope
- Clinical Cell and Vaccine Production Facility (CVPF)
- Evotec
- Fraunhofer Institute for Cell Therapy and Immunology
- ImmunityBio
- Lonza
- Merck Millipore
- Miltenyi Biotec
- Minaris Advanced Therapies
- Newcastle Advanced Therapies
- NHS Blood and Transplant
- OBiO Tech
- Pharmaron
- Rayne Cell Therapy Suite
- Resilience
- Sartorius
- Scottish National Blood Transfusion Service (SNBTS) Cellular Therapy Facility
- SK pharmteco (Subsidiary of SK Inc.)
- Takara Bio
- Thermo Fisher Scientific
Cell Therapy Manufacturing Market: Research Coverage
- Market Sizing and Opportunity Analysis: The report features an in-depth analysis of the cell therapy manufacturing market, focusing on key market segments, including [A] type of cell therapy, [B] source of cells, [C] scale of operation, [D] type of manufacturer, and [E] geographical regions.
- Industry Players - Market Landscape 1: A detailed overview of the current market landscape of companies engaged of industry players in cell therapy manufacturing domain, featuring information on, along with information on several relevant parameters, such as [A] year of establishment, [B] company size, [C] location of headquarters, [D] location of manufacturing facility, [E] type of immune cell offered, [F] source of cells, [G] scale of operation, and [H] type of additional service offered.
- Non-industry Players - Market Landscape 2: A detailed overview of the current market landscape of non-industry players in cell therapy manufacturing domain along with information on several relevant parameters, such as [A] year of establishment, [B] company size, [C] location of headquarters, [D] location of manufacturing facility, [E] type of immune cell offered, [F] source of cells, [G] scale of operation, and [H] type of additional service offered.
- Regulatory Landscape: An overview of cell therapy manufacturing related regulations across various geographies, including North America (focusing on the US), Europe and Asia (focusing on Japan and China), featuring an analysis of the diverse certifications / accreditations awarded to the manufacturing facilities by important regulatory bodies across the globe.
- Case Study 1: An overview of the various roadmaps published by different agencies across the globe in order to provide strategies to advance cell therapy manufacturing process.
- Case Study 2: A detailed role of technology automation in cell therapy manufacturing in order to optimize the current manufacturing practices with the use of closed and single use systems. Further, it features a roadmap that provides information on the steps to develop automation devices, supported by two case studies
- Company Profiles: In-depth profiles of prominent industry and non-industry players in North America, Europe and Asia-Pacific that are involved in cell therapy manufacturing based on [A] year of establishment, [B] location of headquarters, [C] product portfolio, [D] recent developments and [E] an informed future outlook.
- Clinical Trial Analysis: An analysis of completed, ongoing and planned clinical trial, based on several relevant parameters, such as trial registration year, enrolled patient population, trial status, trial phase, patient gender, study design, type of allocation, intervention model, type of masking, type of sponsor / collaborator most active players (in terms of number of clinical trial conducted) and geographical distribution of trials.
- Partnerships and Collaborations: An in-depth analysis of the partnerships and collaborations that have been inked by cell therapy manufacturers, based on several relevant parameters, such as year of partnership, type of partnership, type of immune cell offered, scale of operation and most active players (in terms of number of partnerships). The chapter also highlights the regional distribution of partnership activity in this market.
- Recent Expansions: A detailed analysis of expansions reported in the domain, along with analysis on several relevant parameters, such as [A] year of expansion, [B] status of expansion, [C] type of expansion, [D] location of facility, [E] amount invested, [F] type of immune cell offered, [G] type of service offered and [H] most active players.
- Big Pharma Initiatives: An in-depth analysis of the various cell therapy manufacturing focused initiatives undertaken by big pharma players, based on several relevant parameters, such as [A] year of initiative, [B] type of initiative, [C] number of initiatives, [D] type of partnership, [E] number of partnerships, [F] type of facility expansion, [G] number of facility expansions, [H] region of facility expansion, [I] number of mergers and acquisitions, [J] number of funding and investment, [K] type of immune cell offered, and [L]scale of operation.
- Capacity Analysis: An estimate an estimate of the overall installed capacity for the manufacturing of cell-based therapies, based on information reported by various industry stakeholders in the public domain, highlighting the distribution of the available capacity in terms of cleanroom area and number of cleanrooms.
- Demand Analysis: An informed estimate of the annual commercial and clinical demand for cell therapies, across several relevant parameters, such as [A] type of cell therapy, and [B] key geographical regions.
- Cost Price Analysis: A detailed analysis of various factors that are likely to influence the price of cell-based therapies, featuring different models / approaches adopted by manufacturers in order to determine the price of their proprietary offerings.
- Make Versus Buy Decision Making Framework: A qualitative analysis that highlights the various factors that need to be taken into consideration by cell therapy developers, while deciding whether to manufacture their respective products in-house or engage the services of a CMO.
- Total Cost of Ownership: A detailed total cost of ownership analysis based on company size, for cell therapy manufacturing organizations, over a period of 20 years.
- SWOT Analysis: a discussion on strength, weaknesses, opportunities and threats, highlighting the relative effect of each SWOT parameter on the overall market dynamics.
Key Questions Answered in this Report
- Which are the leading companies in cell therapy manufacturing market?
- Which region dominates the cell therapy contract manufacturing market?
- What are the key trends observed in the cell therapy manufacturing market?
- What factors are likely to influence the evolution of this market?
- What are the primary challenges faced by cell therapy contract manufacturers?
- What is the current and future market size?
- What is the CAGR of this market?
- How is the current and future market opportunity likely to be distributed across key market segments?
Reasons to Buy this Report
- The report provides a comprehensive market analysis, offering detailed revenue projections of the overall market and its specific sub-segments. This information is valuable to both established market leaders and emerging entrants.
- The report offers stakeholders a comprehensive overview of the market, including key drivers, barriers, opportunities, and challenges. This information empowers stakeholders to stay abreast of market trends and make data-driven decisions to capitalize on growth prospects.
- The report can aid businesses in identifying future opportunities in any sector. It also helps in understanding if those opportunities are worth pursuing.
- The report helps in identifying customer demand by understanding the needs, preferences, and behavior of the target audience in order to tailor products or services effectively.
- The report equips new entrants with requisite information regarding a particular market to help them build successful business strategies.
- The report allows for more effective communication with the audience and in building strong business relations.
Additional Benefits
- Complementary PPT Insights Pack
- Complimentary Excel Data Packs for all Analytical Modules in the Report
- 15% Free Content Customization
- Detailed Report Walkthrough Session with Research Team
- Free Updated report if the report is 6-12 months old or older
TABLE OF CONTENTS
1. PREFACE
- 1.1. Introduction
- 1.2. Market Share Insights
- 1.3. Key Market Insights
- 1.4. Report Coverage
- 1.5. Key Questions Answered
- 1.6. Chapter Outlines
2. RESEARCH METHODOLOGY
- 2.1. Chapter Overview
- 2.2. Research Assumptions
- 2.2.1. Market Landscape and Market Trends
- 2.2.2. Market Forecast and Opportunity Analysis
- 2.2.3. Comparative Analysis
- 2.3. Database Building
- 2.3.1. Data Collection
- 2.3.2. Data Validation
- 2.3.3. Data Analysis
- 2.4. Project Methodology
- 2.4.1. Secondary Research
- 2.4.1.1. Annual Reports
- 2.4.1.2. Academic Research Papers
- 2.4.1.3. Company Websites
- 2.4.1.4. Investor Presentations
- 2.4.1.5. Regulatory Filings
- 2.4.1.6. White Papers
- 2.4.1.7. Industry Publications
- 2.4.1.8. Conferences and Seminars
- 2.4.1.9. Government Portals
- 2.4.1.10. Media and Press Releases
- 2.4.1.11. Newsletters
- 2.4.1.12. Industry Databases
- 2.4.1.13. Roots Proprietary Databases
- 2.4.1.14. Paid Databases and Sources
- 2.4.1.15. Social Media Portals
- 2.4.1.16. Other Secondary Sources
- 2.4.2. Primary Research
- 2.4.2.1. Types of Primary Research
- 2.4.2.1.1. Qualitative Research
- 2.4.2.1.2. Quantitative Research
- 2.4.2.1.3. Hybrid Approach
- 2.4.2.2. Advantages of Primary Research
- 2.4.2.3. Techniques for Primary Research
- 2.4.2.3.1. Interviews
- 2.4.2.3.2. Surveys
- 2.4.2.3.3. Focus Groups
- 2.4.2.3.4. Observational Research
- 2.4.2.3.5. Social Media Interactions
- 2.4.2.4. Key Opinion Leaders Considered in Primary Research
- 2.4.2.4.1. Company Executives (CXOs)
- 2.4.2.4.2. Board of Directors
- 2.4.2.4.3. Company Presidents and Vice Presidents
- 2.4.2.4.4. Research and Development Heads
- 2.4.2.4.5. Technical Experts
- 2.4.2.4.6. Subject Matter Experts
- 2.4.2.4.7. Scientists
- 2.4.2.4.8. Doctors and Other Healthcare Providers
- 2.4.2.5. Ethics and Integrity
- 2.4.2.5.1. Research Ethics
- 2.4.2.5.2. Data Integrity
- 2.4.2.1. Types of Primary Research
- 2.4.3. Analytical Tools and Databases
- 2.4.1. Secondary Research
- 2.5. Robust Quality Control
3. MARKET DYNAMICS
- 3.1. Chapter Overview
- 3.2. Forecast Methodology
- 3.2.1. Top-down Approach
- 3.2.2. Bottom-up Approach
- 3.2.3. Hybrid Approach
- 3.3. Market Assessment Framework
- 3.3.1. Total Addressable Market (TAM)
- 3.3.2. Serviceable Addressable Market (SAM)
- 3.3.3. Serviceable Obtainable Market (SOM)
- 3.3.4. Currently Acquired Market (CAM)
- 3.4. Forecasting Tools and Techniques
- 3.4.1. Qualitative Forecasting
- 3.4.2. Correlation
- 3.4.3. Regression
- 3.4.4. Extrapolation
- 3.4.5. Convergence
- 3.4.6. Sensitivity Analysis
- 3.4.7. Scenario Planning
- 3.4.8. Data Visualization
- 3.4.9. Time Series Analysis
- 3.4.10. Forecast Error Analysis
- 3.5. Key Considerations
- 3.5.1. Demographics
- 3.5.2. Government Regulations
- 3.5.3. Reimbursement Scenarios
- 3.5.4. Market Access
- 3.5.5. Supply Chain
- 3.5.6. Industry Consolidation
- 3.5.7. Pandemic / Unforeseen Disruptions Impact
- 3.6. Limitations
4. MACRO-ECONOMIC INDICATORS
- 4.1. Chapter Overview
- 4.2. Market Dynamics
- 4.2.1. Time Period
- 4.2.1.1. Historical Trends
- 4.2.1.2. Current and Forecasted Estimates
- 4.2.2. Currency Coverage
- 4.2.2.1. Major Currencies Affecting the Market
- 4.2.2.2. Factors Affecting Currency Fluctuations
- 4.2.2.3. Impact of Currency Fluctuations on the Industry
- 4.2.3. Foreign Currency Exchange Rate
- 4.2.3.1. Impact of Foreign Exchange Rate Volatility on the Market
- 4.2.3.2. Strategies for Mitigating Foreign Exchange Risk
- 4.2.4. Recession
- 4.2.4.1. Assessment of Current Economic Conditions and Potential Impact on the Market
- 4.2.4.2. Historical Analysis of Past Recessions and Lessons Learnt
- 4.2.5. Inflation
- 4.2.5.1. Measurement and Analysis of Inflationary Pressures in the Economy
- 4.2.5.2. Potential Impact of Inflation on the Market Evolution
- 4.2.6. Interest Rates
- 4.2.6.1. Interest Rates and Their Impact on the Market
- 4.2.6.2. Strategies for Managing Interest Rate Risk
- 4.2.7. Commodity Flow Analysis
- 4.2.7.1. Type of Commodity
- 4.2.7.2. Origins and Destinations
- 4.2.7.3. Values and Weights
- 4.2.7.4. Modes of Transportation
- 4.2.8. Global Trade Dynamics
- 4.2.8.1. Import Scenario
- 4.2.8.2. Export Scenario
- 4.2.8.3. Trade Policies
- 4.2.8.4. Strategies for Mitigating the Risks Associated with Trade Barriers
- 4.2.8.5. Impact of Trade Barriers on the Market
- 4.2.9. War Impact Analysis
- 4.2.9.1. Russian-Ukraine War
- 4.2.9.2. Israel-Hamas War
- 4.2.10. COVID Impact / Related Factors
- 4.2.10.1. Global Economic Impact
- 4.2.10.2. Industry-specific Impact
- 4.2.10.3. Government Response and Stimulus Measures
- 4.2.10.4. Future Outlook and Adaptation Strategies
- 4.2.11. Other Indicators
- 4.2.11.1. Fiscal Policy
- 4.2.11.2. Consumer Spending
- 4.2.11.3. Gross Domestic Product
- 4.2.11.4. Employment
- 4.2.11.5. Taxes
- 4.2.11.6. Stock Market Performance
- 4.2.11.7. Cross Border Dynamics
- 4.2.1. Time Period
- 4.3. Conclusion
5. EXECUTIVE SUMMARY
- 5.1. Executive Summary: Market Landscape
- 5.2. Executive Summary: Market Trends
- 5.3. Executive Summary: Market Forecast and Opportunity Analysis
6. INTRODUCTION
- 6.1. Chapter Overview
- 6.2. Introduction to Cell-based Therapies
- 6.2.1. Comparison of Cell-based Therapies and Other Biotechnology Products
- 6.2.2. Classification of Advanced Therapy Medicinal Products (ATMPs)
- 6.2.3. Current Market Landscape of ATMPs
- 6.3. Overview of Cell Therapy Manufacturing
- 6.4. Cell Therapy Manufacturing Models
- 6.4.1. Centralized Manufacturing
- 6.4.2. Decentralized Manufacturing
- 6.5. Scalability of Cell Therapy Manufacturing Processes
- 6.5.1. Scale-up
- 6.5.2. Scale-out
- 6.6. Types of Cell Therapy Manufacturers
- 6.7. Key Challenges for Manufacturing Cell Therapies
- 6.8. Key Factors Influencing Cell Therapy Manufacturing
- 6.8.1. Cell Characterization
- 6.8.2. Cost of Goods
- 6.9. Automation of Cell Therapy Manufacturing
- 6.10. Cell Therapy Manufacturing Supply Chain
- 6.11. Future Perspectives
7. CELL THERAPY MANUFACTURERS (INDUSTRY PLAYERS): MARKET LANDSCAPE
- 7.1. Chapter Overview
- 7.2. Industry Players: Overall Market Landscape
- 7.2.1. Analysis by Year of Establishment
- 7.2.2. Analysis by Company Size
- 7.2.3. Analysis by Location of Headquarters (Region)
- 7.2.4. Analysis by Location of Headquarters (Country)
- 7.2.5. Analysis by Company Size and Location of Headquarters (Region)
- 7.2.6. Analysis by Location of Manufacturing Facility
- 7.2.7. Analysis by Type of Immune Cell Offered
- 7.2.8. Analysis by Source of Cells
- 7.2.9. Analysis by Scale of Operation
- 7.2.10. Analysis by Type of Additional Service Offered
8. CELL THERAPY MANUFACTURERS (NON-INDUSTRY PLAYERS): MARKET LANDSCAPE
- 8.1. Chapter Overview
- 8.2. Non-Industry Players: Overall Market Landscape
- 8.2.1. Analysis by Year of Establishment
- 8.2.2. Analysis by Location of Headquarters (Region)
- 8.2.3. Analysis by Location of Headquarters (Country)
- 8.2.4. Analysis by Location of Manufacturing Facility
- 8.2.5. Analysis by Type of Immune Cell Offered
- 8.2.6. Analysis by Source of Cell
- 8.2.7. Analysis by Scale of Operation
- 8.2.8. Analysis by Type of Additional Service Offered
9. REGULATORY LANDSCAPE
- 9.1. Chapter Overview
- 9.2. Current Scenario
- 9.2.1. Regulatory Guidelines in North America
- 9.2.2. Regulatory Guidelines in Europe
- 9.2.3. Regulatory Guidelines in Asia-Pacific
- 9.2.3.1. Regulatory Guidelines in Japan
- 9.2.3.2. Regulatory Guidelines in China
- 9.2.4. Conditional Approvals
- 9.3. Regulatory Authorities for Cell Therapy Manufacturing
- 9.3.1. Cell Therapy Manufacturing (Industry Players): Regulatory Authorities
- 9.4. Summary of Guidelines for Early-Stage Manufacturing of Cell Therapies
- 9.5. Existing Challenges to Early-Stage Manufacturing of Cell Therapies
- 9.6. Variability in Regulatory Guidelines across Different Geographies
10. CASE STUDY: ROADMAPS FOR OVERCOMING CHALLENGES RELATED TO CELL THERAPY MANUFACTURING
- 10.1. Chapter Overview
- 10.2. Roadmap for the US
- 10.2.1. Cell Processing
- 10.2.2. Cell Preservation, Distribution and Handling
- 10.2.3. Process Automation and Data Analytics
- 10.2.4. Process Monitoring and Quality Control
- 10.2.5. Standardization and Regulatory Support
- 10.2.6. Workforce Development
- 10.2.7. Supply Chain and Logistics
- 10.3. Roadmaps for Other Geographies
- 10.3.1. Europe
- 10.3.2. Asia-Pacific
11. CASE STUDY: AUTOMATION TECHNOLOGIES FOR CELL THERAPY MANUFACTURING
- 11.1. Chapter Overview
- 11.2. Automation of Cell Therapy Manufacturing Processes
- 11.2.1. Closed Systems
- 11.2.2. Single-use Systems
- 11.2.3. Modular Systems
- 11.3. Growth Drivers and Roadblocks
- 11.4. Case Studies
- 11.4.1. Roadmap to Develop an Automated Cell Manufacturing / Processing Device
- 11.4.2. Automating the Cell Therapy Manufacturing Process
- 11.4.3. Advancement to Automation of Cell Therapy Manufacturing Process
- 11.4.4. GMP-in-a-Box
- 11.4.5. List of Automated and Closed Cell Therapy Processing Systems
12. COMPANY PROFILES: INDUSTRY PLAYERS
- 12.1. Chapter Overview
- 12.2. Service Providers in North America
- 12.2.1. Advanced Therapies
- 12.2.1.1. Company Overview
- 12.2.1.2. Financial Information
- 12.2.1.3. Service Portfolio
- 12.2.1.4. Manufacturing Facilities and Capabilities
- 12.2.1.5. Recent Developments and Future Outlook
- 12.2.1. Advanced Therapies
- similar details are presented for other below mentioned players based on information in the public domain
- 12.2.2. AGC Biologics
- 12.2.3. Catalent
- 12.2.4. Charles River Laboratories
- 12.2.5. ImmunityBio
- 12.2.6. Merck Millipore
- 12.2.7. Minaris Advanced Therapies
- 12.2.8. Resilience
- 12.2.9. SK pharmteco (Subsidiary of SK Inc.)
- 12.2.10. Thermo Fisher Scientific
- 12.3. Service Providers in Europe
- 12.3.1. Evotec
- 12.3.2. Lonza
- 12.3.3. Miltenyi Biotec
- 12.3.4. Sartorius
- 12.4. Service Providers in Asia-Pacific
- 12.4.1. Astellas Pharma
- 12.4.2. OBiO Tech
- 12.4.3. Pharmaron
- 12.4.4. Takara Bio
13. COMPANY PROFILES: NON-INDUSTRY PLAYERS
- 13.1. Chapter Overview
- 13.2. City of Hope
- 13.2.1. Overview
- 13.2.2. Service Portfolio
- 13.2.3. Type of Additional Service Offered
- similar details are presented for other below mentioned players based on information in the public domain
- 13.3. Clinical Cell and Vaccine Production Facility (CVPF)
- 13.4. Fraunhofer Institute for Cell Therapy and Immunology
- 13.5. Newcastle Advanced Therapies
- 13.6. NHS Blood and Transplant
- 13.7. Rayne Cell Therapy Suite (King's College London)
- 13.8. Scottish National Blood Transfusion Service (SNBTS) Cellular Therapy Facility
14. NON-PROFIT ORGANIZATIONS IN CELL THERAPY MANUFACTURING
- 14.1. Chapter Overview
- 14.2. Cell Therapy Manufacturing: Non-Profit Organizations
- 14.2.1. CellCAN
- 14.2.2. Cell Therapy Manufacturing Cooperative Research Center
- 14.2.3. National Cell Manufacturing Consortium (NCMC)
- 14.2.4. California Institute of Regenerative Medicine (CIRM)
- 14.3. Cell Therapy Manufacturing: International Societies
15. CLINICAL TRIAL ANALYSIS
- 15.1. Chapter Overview
- 15.2. Scope and Methodology
- 15.3. Cell Therapies: Clinical Trial Analysis
- 15.3.1. Analysis by Trial Registration Year
- 15.3.2. Analysis by Trial Registration Year and Enrolled Patient Population
- 15.3.3. Analysis by Trial Status
- 15.3.4. Analysis by Trial Registration Year and Trial Status
- 15.3.5. Analysis by Trial Phase
- 15.3.6. Analysis of Enrolled Patient Population by Trial Phase
- 15.3.7. Analysis by Patient Gender
- 15.3.8. Analysis by Study Design
- 15.3.8.1. Analysis by Type of Allocation
- 15.3.8.2. Analysis by Intervention Model
- 15.3.8.3. Analysis by Type of Masking
- 15.3.9. Analysis by Type of Sponsor / Collaborator
- 15.3.10. Most Active Players: Analysis by Number of Registered Trials
- 15.3.11. Analysis by Geography
- 15.3.11.1. Analysis of Clinical Trials by Geography
- 15.3.11.2. Analysis of Clinical Trials by Trial Status and Geography
- 15.3.11.3. Analysis of Enrolled Patient Population by Trial Status and Geography
16. PARTNERSHIPS AND COLLABORATIONS
- 16.1. Chapter Overview
- 16.2. Partnership Models
- 16.3. Cell Therapy Manufacturing: List of Partnerships
- 16.3.1. Analysis by Year of Partnership
- 16.3.2. Analysis by Type of Partnership
- 16.3.3. Analysis by Year and Type of Partnership
- 16.4. Analysis by Type of Immune Cell Offered
- 16.5. Analysis by Scale of Operation
- 16.6. Most Active Players: Analysis by Number of Partnerships
- 16.7. Analysis by Geography
- 16.7.1. Local and International Agreements
- 16.7.2. Intracontinental and Intercontinental Agreements
17. RECENT EXPANSIONS
- 17.1. Chapter Overview
- 17.2. Type of Expansions
- 17.3. Cell Therapy Manufacturing: Recent Expansions
- 17.3.1. Analysis by Year of Expansion
- 17.3.2. Analysis by Type of Expansion
- 17.3.3. Analysis by Year and Type of Expansion
- 17.3.4. Analysis by Location of Expanded Facility (Region)
- 17.3.5. Analysis by Location of Expanded Facility (Country)
- 17.3.6. Analysis by Type of Expansion and Location of Headquarters (Country)
- 17.3.7. Analysis by Type of Immune Cell Offered
- 17.3.8. Analysis by Type of Expansion and Type of Immune Cell Offered
- 17.3.9. Analysis by Scale of Operation
- 17.3.10. Most Active Players: Analysis by Number of Expansions
- 17.3.11. Most Active Players: Analysis by Area of Expansion
18. BIG PHARMA INITIATIVES
- 18.1. Chapter Overview
- 18.2. Cell Therapy Manufacturing: List of Big Pharma Players
- 18.3. Cell Therapy Manufacturing: List of Initiatives by Big Pharma Players
- 18.3.1. Analysis by Year of Initiative
- 18.3.2. Analysis by Type of Initiative
- 18.3.3. Analysis by Year and Type of Initiative
- 18.3.4. Big Players: Analysis by Number of Initiatives
- 18.3.5. Analysis by Type of Partnership
- 18.3.6. Big Players: Analysis by Number of Partnerships
- 18.3.7. Analysis by Type of Facility Expansion
- 18.3.8. Big Players: Analysis by Number of Facility Expansions
- 18.3.9. Big Players: Analysis by Region of Facility Expansion
- 18.3.10. Big Players: Analysis by Number of Mergers and Acquisitions
- 18.3.11. Big Players: Analysis by Number of Funding and Investment
- 18.3.12. Analysis by Type of Immune Cell Offered
- 18.3.13. Analysis by Scale of Operation
- 18.3.14. Analysis of Big Pharma Players by Scale of Operation
- 18.3.15. Big Pharma Initiatives Summary
19. CAPACITY ANALYSIS
- 19.1. Chapter Overview
- 19.2. Industry Players: Key Assumptions and Methodology
- 19.2.1. Cell Therapy Manufacturing: Global Installed Capacity (Number of Cleanrooms)
- 19.2.1.1. Analysis by Company Size
- 19.2.1.2. Analysis by Scale of Operation
- 19.2.1.3. Analysis by Location of Manufacturing Facility
- 19.2.1.4. Analysis by Company Size and Location of Manufacturing Facility
- 19.2.1.5. Analysis by Scale of Operation and Location of Manufacturing Facility
- 19.2.2. Cell Therapy Manufacturing: Global Installed Capacity (Cleanroom Area)
- 19.2.2.1. Analysis by Company Size
- 19.2.2.2. Analysis by Scale of Operation
- 19.2.2.3. Analysis by Location of Manufacturing Facility
- 19.2.2.4. Analysis by Company Size and Location of Manufacturing Facility
- 19.2.2.5. Analysis by Scale of Operation and Location of Manufacturing Facility
- 19.2.1. Cell Therapy Manufacturing: Global Installed Capacity (Number of Cleanrooms)
- 19.3. Non- Industry Players: Key Assumptions and Methodology
- 19.3.1. Cell Therapy Manufacturing: Global Installed Capacity (Number of Cleanrooms)
- 19.3.1.1. Analysis by Scale of Operation
- 19.3.1.2. Analysis by Location of Manufacturing Facility
- 19.3.2. Cell Therapy Manufacturing: Global Installed Capacity (Cleanroom Area)
- 19.3.2.1. Analysis by Scale of Operation
- 19.3.2.2. Analysis by Location of Manufacturing Facility
- 19.3.1. Cell Therapy Manufacturing: Global Installed Capacity (Number of Cleanrooms)
- 19.4. Concluding Remarks
20. DEMAND ANALYSIS
- 20.1. Chapter Overview
- 20.2. Assumptions and Methodology
- 20.3. Global Demand for Cell Therapy Manufacturing
- 20.4. Global Clinical Demand for Cell Therapy Manufacturing
- 20.4.1. Clinical Demand: Analysis by Type of Cell Therapy
- 20.4.2. Clinical Demand: Analysis by Geography
- 20.5. Global Commercial Demand for Cell Therapy Manufacturing
- 20.5.1. Commercial Demand: Analysis by Type of Cell Therapy
- 20.5.2. Commercial Demand: Analysis by Geography
21. COST PRICE ANALYSIS
- 21.1. Chapter Overview
- 21.2. Factors Contributing to the High Price of Cell Therapies
- 21.3. Pricing Models for Cell Therapies
- 21.3.1. Based on Associated Costs for T-cell Therapies
- 21.3.2. Based on Associated Costs for Stem Cell Therapies
- 21.3.3. Based on Availability of Competing Products
- 21.3.4. Based on Target Patient Segment
- 21.3.5. Based on the Opinions of Industry Experts
- 21.4. Cell Therapy Cost Optimization
- 21.4.1. Role of Cost of Goods Sold
- 21.4.2. Role of Automation
- 21.5. Role of Cell Therapy Contract Manufacturing Organizations
- 21.6. Reimbursement-related Considerations for Cell Therapies
- 21.6.1. Case Study: The National Institute for Health and Care Excellence's (NICE) Appraisal of CAR-T Therapies
22. MAKE VERSUS BUY DECISION MAKING FRAMEWORK
- 22.1. Chapter Overview
- 22.2. Assumptions and Key Parameters
- 22.3. Cell Therapy Manufacturing: Make versus Buy Decision Making
- 22.3.1. Scenario 1
- 22.3.2. Scenario 2
- 22.3.3. Scenario 3
- 22.3.4. Scenario 4
23. TOTAL COST OF OWNERSHIP FOR CELL THERAPY MANUFACTURING ORGANIZATIONS
- 23.1. Chapter Overview
- 23.2. Key Parameters
- 23.3. Assumptions and Methodology
- 23.4. Sample Dataset for the Estimation of Total Cost of Ownership
- 23.5. Total Cost of Ownership for Mid-sized Cell Therapy Manufacturing Organizations, Y0-Y20
- 23.6. Total Cost of Ownership for Mid-sized Cell Therapy Manufacturing Organizations: Analysis by CAPEX and OPEX, Y0 and Y20
- 23.6.1. Total Cost of Ownership for Mid-sized Cell Therapy Manufacturing Organizations: Analysis by CAPEX, Y0
- 23.6.2. Total Cost of Ownership for Mid-sized Cell Therapy Manufacturing Organizations: Analysis by OPEX, Y1-Y20
24. SWOT ANALYSIS
- 24.1. Chapter Overview
- 24.2. Strengths
- 24.3. Weaknesses
- 24.4. Opportunities
- 24.5. Threats
- 24.6. Comparison of SWOT Factors
25. SURVEY ANALYSIS
- 25.1. Chapter Overview
- 25.2. Analysis by Designation of Respondents
- 25.3. Analysis by Type of Cell Therapy
- 25.4. Analysis by Scale of Operation
- 25.5. Analysis by Source of Cells
- 25.6. Analysis by Type of Cell Culture System Used
- 25.7. Analysis by Availability of Fill / Finish Services
26. GLOBAL CELL THERAPY MANUFACTURING MARKET
- 26.1. Chapter Overview
- 26.2. Assumptions and Methodology
- 26.3. Global Cell Therapy Manufacturing Market, Historical Trends (since 2023) and Forecasted Estimates (till 2035)
- 26.4. Roots Analysis Perspective on Market Growth
- 26.5. Scenario Analysis
- 26.5.1. Conservative Scenario
- 26.5.2. Optimistic Scenario
- 26.6. Key Market Segmentations
27. CELL THERAPY MANUFACTURING MARKET, BY TYPE OF CELL THERAPY
- 27.1. Chapter Overview
- 27.2. Key Assumptions and Methodology
- 27.3. Cell Therapy Manufacturing Market: Distribution by Type of Cell Therapy
- 27.3.1. Cell Therapy Manufacturing Market for CAR-T Cell Therapies, Historical Trends (since 2023) and Forecasted Estimates (till 2035)
- 27.3.2. Cell Therapy Manufacturing Market for Stem Cell Therapies, Historical Trends (since 2023) and Forecasted Estimates (till 2035)
- 27.3.3. Cell Therapy Manufacturing Market for TCR Cell Therapies, Historical Trends (since 2023) and Forecasted Estimates (till 2035)
- 27.3.4. Cell Therapy Manufacturing Market for TIL Cell Therapies, Historical Trends (since 2023) and Forecasted Estimates (till 2035)
- 27.3.5. Cell Therapy Manufacturing Market for Dendritic Cell Therapies, Historical Trends (since 2023) and Forecasted Estimates (till 2035)
- 27.3.6. Cell Therapy Manufacturing Market for Other Cell Therapies, Historical Trends (since 2023) and Forecasted Estimates (till 2035)
- 27.4. Data Triangulation and Validation
28. CELL THERAPY MANUFACTURING MARKET, BY SOURCE OF CELLS
- 28.1. Chapter Overview
- 28.2. Key Assumptions and Methodology
- 28.3. Cell Therapy Manufacturing Market: Distribution by Source of Cells
- 28.3.1. Cell Therapy Manufacturing Market for Autologous Cells, Historical Trends (since 2023) and Forecasted Estimates (till 2035)
- 28.3.2. Cell Therapy Manufacturing Market for Allogeneic Cells, Historical Trends (since 2023) and Forecasted Estimates (till 2035)
- 28.3.3. Cell Therapy Manufacturing Market for Other Cells, Historical Trends (since 2023) and Forecasted Estimates (till 2035)
- 28.4. Data Triangulation and Validation
29. CELL THERAPY MANUFACTURING MARKET, BY SCALE OF OPERATION
- 29.1. Chapter Overview
- 29.2. Key Assumptions and Methodology
- 29.3. Cell Therapy Manufacturing Market: Distribution by Scale of Operation
- 29.3.1. Cell Therapy Manufacturing Market for Clinical Scale, Historical Trends (since 2023) and Forecasted Estimates (till 2035)
- 29.3.2. Cell Therapy Manufacturing Market for Commercial Scale, Historical Trends (since 2023) and Forecasted Estimates (till 2035)
30. CELL THERAPY MANUFACTURING MARKET, BY TYPE OF MANUFACTURER
- 30.1. Chapter Overview
- 30.2. Key Assumptions and Methodology
- 30.3. Cell Therapy Manufacturing Market: Distribution by Type of Manufacturer
- 30.3.1. Cell Therapy Manufacturing Market for Contract Manufacturing Organizations, Historical Trends (since 2023) and Forecasted Estimates (till 2035)
- 30.3.2. Cell Therapy Manufacturing Market for In-House Manufacturers, Historical Trends (since 2023) and Forecasted Estimates (till 2035)
- 30.4. Data Triangulation and Validation
31. CELL THERAPY MANUFACTURING MARKET, BY GEOGRAPHY
- 31.1. Chapter Overview
- 31.2. Key Assumptions and Methodology
- 31.3. Cell Therapy Manufacturing Market: Distribution by Geography
- 31.3.1. Clinical Cell Therapy Manufacturing Market
- 31.3.1.1. Clinical Cell Therapy Manufacturing Market in North America, Historical Trends (since 2023) and Forecasted Estimates (till 2035)
- 31.3.1.1.1. Clinical Cell Therapy Manufacturing Market in the US, Historical Trends (since 2023) and Forecasted Estimates (till 2035)
- 31.3.1.1.2. Clinical Cell Therapy Manufacturing Market in Canada, Historical Trends (since 2023) and Forecasted Estimates (till 2035)
- 31.3.1.2. Clinical Cell Therapy Manufacturing Market in Europe, Historical Trends (since 2023) and Forecasted Estimates (till 2035)
- 31.3.1.2.1. Clinical Cell Therapy Manufacturing Market in Spain, Historical Trends (since 2023) and Forecasted Estimates (till 2035)
- 31.3.1.2.2. Clinical Cell Therapy Manufacturing Market in France, Historical Trends (since 2023) and Forecasted Estimates (till 2035)
- 31.3.1.2.3. Clinical Cell Therapy Manufacturing Market in Germany, Historical Trends (since 2023) and Forecasted Estimates (till 2035)
- 31.3.1.2.4. Clinical Cell Therapy Manufacturing Market in the UK, Historical Trends (since 2023) and Forecasted Estimates (till 2035)
- 31.3.1.2.5. Clinical Cell Therapy Manufacturing Market in Italy, Historical Trends (since 2023) and Forecasted Estimates (till 2035)
- 31.3.1.3. Clinical Cell Therapy Manufacturing Market in Asia-Pacific and Rest of the World, Historical Trends (since 2023) and Forecasted Estimates (till 2035)
- 31.3.1.3.1. Clinical Cell Therapy Manufacturing Market in China, Historical Trends (since 2023) and Forecasted Estimates (till 2035)
- 31.3.1.3.2. Clinical Cell Therapy Manufacturing Market in Singapore, Historical Trends (since 2023) and Forecasted Estimates (till 2035)
- 31.3.1.3.3. Clinical Cell Therapy Manufacturing Market in South Korea, Historical Trends (since 2023) and Forecasted Estimates (till 2035)
- 31.3.1.3.4. Clinical Cell Therapy Manufacturing Market in Israel, Historical Trends (since 2023) and Forecasted Estimates (till 2035)
- 31.3.1.3.5. Clinical Cell Therapy Manufacturing Market in Japan, Historical Trends (since 2023) and Forecasted Estimates (till 2035)
- 31.3.1.3.6. Clinical Cell Therapy Manufacturing Market in Taiwan, Historical Trends (since 2023) and Forecasted Estimates (till 2035)
- 31.3.1.3.7. Clinical Cell Therapy Manufacturing Market in Brazil, Historical Trends (since 2023) and Forecasted Estimates (till 2035)
- 31.3.1.3.8. Clinical Cell Therapy Manufacturing Market in Argentina, Historical Trends (since 2023) and Forecasted Estimates (till 2035)
- 31.3.1.3.9. Clinical Cell Therapy Manufacturing Market in South Africa, Historical Trends (since 2023) and Forecasted Estimates (till 2035)
- 31.3.1.1. Clinical Cell Therapy Manufacturing Market in North America, Historical Trends (since 2023) and Forecasted Estimates (till 2035)
- 31.3.2. Commercial Cell Therapy Manufacturing Market
- 31.3.2.1. Commercial Cell Therapy Manufacturing Market in North America, Historical Trends (since 2023) and Forecasted Estimates (till 2035)
- 31.3.2.1.1. Commercial Cell Therapy Manufacturing Market in the US, Historical Trends (since 2023) and Forecasted Estimates (till 2035)
- 31.3.2.1.2. Commercial Cell Therapy Manufacturing Market in Canada, Historical Trends (since 2023) and Forecasted Estimates (till 2035)
- 31.3.2.2. Commercial Cell Therapy Manufacturing Market in Europe, Historical Trends (since 2023) and Forecasted Estimates (till 2035)
- 31.3.2.2.1. Commercial Cell Therapy Manufacturing Market in Germany, Historical Trends (since 2023) and Forecasted Estimates (till 2035)
- 31.3.2.2.2. Commercial Cell Therapy Manufacturing Market in France, Historical Trends (since 2023) and Forecasted Estimates (till 2035)
- 31.3.2.2.3. Commercial Cell Therapy Manufacturing Market in the UK, Historical Trends (since 2023) and Forecasted Estimates (till 2035)
- 31.3.2.2.4. Commercial Cell Therapy Manufacturing Market in Italy, Historical Trends (since 2023) and Forecasted Estimates (till 2035)
- 31.3.2.2.5. Commercial Cell Therapy Manufacturing Market in Spain, Historical Trends (since 2023) and Forecasted Estimates (till 2035)
- 31.3.2.2.6. Commercial Cell Therapy Manufacturing Market in Rest of Europe, Historical Trends (since 2023) and Forecasted Estimates (till 2035)
- 31.3.2.3. Commercial Cell Therapy Manufacturing Market in Asia-Pacific and Rest of the World, Historical Trends (since 2023) and Forecasted Estimates (till 2035)
- 31.3.2.3.1. Commercial Cell Therapy Manufacturing Market in China, Historical Trends (since 2023) and Forecasted Estimates (till 2035)
- 31.3.2.3.2. Commercial Cell Therapy Manufacturing Market in Japan, Historical Trends (since 2023) and Forecasted Estimates (till 2035)
- 31.3.2.3.3. Commercial Cell Therapy Manufacturing Market in Australia, Historical Trends (since 2023) and Forecasted Estimates (2025-2035)
- 31.3.2.3.4. Commercial Cell Therapy Manufacturing Market in India, Historical Trends (since 2023) and Forecasted Estimates (till 2035)
- 31.3.2.3.5. Commercial Cell Therapy Manufacturing Market in South Korea, Historical Trends (since 2023) and Forecasted Estimates (till 2035)
- 31.3.2.3.6. Commercial Cell Therapy Manufacturing Market in Brazil, Historical Trends (since 2024) and Forecasted Estimates (till 2035)
- 31.3.2.1. Commercial Cell Therapy Manufacturing Market in North America, Historical Trends (since 2023) and Forecasted Estimates (till 2035)
- 31.3.1. Clinical Cell Therapy Manufacturing Market
- 31.4. Penetration Growth (P-G) Matrix
- 31.5. Market Dynamics Assessment
32. CELL THERAPY MANUFACTURING MARKET OPPORTUNITY ANALYSIS: NORTH AMERICA
- 32.1. Cell Therapy Manufacturing Market in North America: Distribution by Type of Cell therapy
- 32.1.1. Cell Therapy Manufacturing Market in North America for CAR-T Cell Therapies, Historical Trends (since 2022) and Forecasted Estimates (till 2035)
- 32.1.2. Cell Therapy Manufacturing Market in North America for Stem Cell Therapies, Historical Trends (since 2022) and Forecasted Estimates (till 2035)
- 32.1.3. Cell Therapy Manufacturing Market in North America for TCR Cell Therapies, Historical Trends (since 2022) and Forecasted Estimates (till 2035)
- 32.1.4. Cell Therapy Manufacturing Market in North America for TIL Cell Therapies, Historical Trends (since 2022) and Forecasted Estimates (till 2035)
- 32.1.5. Cell Therapy Manufacturing Market in North America for Dendritic Cell Therapies, Historical Trends (since 2022) and Forecasted Estimates (till 2035)
- 32.1.6. Cell Therapy Manufacturing Market in North America for Other Cell Therapies, Historical Trends (since 2022) and Forecasted Estimates (till 2035)
- 32.2. Cell Therapy Manufacturing Market in North America: Distribution by Source of Cells
- 32.2.1. Cell Therapy Manufacturing Market in North America for Autologous Cells, Historical Trends (since 2022) and Forecasted Estimates (till 2035)
- 32.2.2. Cell Therapy Manufacturing Market in North America for Allogeneic Cells, Historical Trends (since 2022) and Forecasted Estimates (till 2035)
- 32.2.3. Cell Therapy Manufacturing Market in North America for Other Cells, Historical Trends (since 2022) and Forecasted Estimates (till 2035)
- 32.3. Cell Therapy Manufacturing Market in North America: Distribution by Scale of Operation
- 32.3.1. Cell Therapy Manufacturing Market in North America for Clinical Scale, Historical Trends (since 2022) and Forecasted Estimates (till 2035)
- 32.3.2. Cell Therapy Manufacturing Market in North America for Commercial Scale, Historical Trends (since 2022) and Forecasted Estimates (till 2035)
- 32.4. Cell Therapy Manufacturing Market in North America: Distribution by Type of Manufacturer
- 32.4.1. Cell Therapy Manufacturing Market in North America for Contract Manufacturing Organizations, Historical Trends (since 2022) and Forecasted Estimates (till 2035)
- 32.4.2. Cell Therapy Manufacturing Market in North America for In-House Manufacturers, Historical Trends (since 2022) and Forecasted Estimates (till 2035)
33. CELL THERAPY MANUFACTURING MARKET OPPORTUNITY ANALYSIS: EUROPE
- 33.1. Cell Therapy Manufacturing Market in Europe: Distribution by Type of Cell therapy
- 33.1.1. Cell Therapy Manufacturing Market in Europe for CAR-T Cell Therapies, Historical Trends (since 2022) and Forecasted Estimates (till 2035)
- 33.1.2. Cell Therapy Manufacturing Market in Europe for Stem Cell Therapies, Historical Trends (since 2022) and Forecasted Estimates (till 2035)
- 33.1.3. Cell Therapy Manufacturing Market in Europe for TCR Cell Therapies, Historical Trends (since 2022) and Forecasted Estimates (till 2035)
- 33.1.4. Cell Therapy Manufacturing Market in Europe for TIL Cell Therapies, Historical Trends (since 2022) and Forecasted Estimates (till 2035)
- 33.1.5. Cell Therapy Manufacturing Market in Europe for Dendritic Cell Therapies, Historical Trends (since 2022) and Forecasted Estimates (till 2035)
- 33.1.6. Cell Therapy Manufacturing Market in Europe for Other Cell Therapies, Historical Trends (since 2022) and Forecasted Estimates (till 2035)
- 33.2. Cell Therapy Manufacturing Market in Europe: Distribution by Source of Cells
- 33.2.1. Cell Therapy Manufacturing Market in Europe for Autologous Cells, Historical Trends (since 2022) and Forecasted Estimates (till 2035)
- 33.2.2. Cell Therapy Manufacturing Market in Europe for Allogeneic Cells, Historical Trends (since 2022) and Forecasted Estimates (till 2035)
- 33.2.3. Cell Therapy Manufacturing Market in Europe for Other Cells, Historical Trends (since 2022) and Forecasted Estimates (till 2035)
- 33.3. Cell Therapy Manufacturing Market in Europe: Distribution by Scale of Operation
- 33.3.1. Cell Therapy Manufacturing Market in Europe for Clinical Scale, Historical Trends (since 2022) and Forecasted Estimates (till 2035)
- 33.3.2. Cell Therapy Manufacturing Market in Europe for Commercial Scale, Historical Trends (since 2022) and Forecasted Estimates (till 2035)
- 33.4. Cell Therapy Manufacturing Market in Europe: Distribution by Type of Manufacturer
- 33.4.1. Cell Therapy Manufacturing Market in Europe for Contract Manufacturing Organizations, Historical Trends (since 2022) and Forecasted Estimates (till 2035)
- 33.4.2. Cell Therapy Manufacturing Market in Europe for In-House Manufacturers, Historical Trends (since 2022) and Forecasted Estimates (till 2035)
34. CELL THERAPY MANUFACTURING MARKET OPPORTUNITY ANALYSIS: ASIA-PACIFIC AND REST OF THE WORLD
- 34.1. Cell Therapy Manufacturing Market in Asia-Pacific and Rest of the World: Distribution by Type of Cell therapy
- 34.1.1. Cell Therapy Manufacturing Market in Asia-Pacific and Rest of the World for CAR-T Cell Therapies, Historical Trends (since 2022) and Forecasted Estimates (till 2035)
- 34.1.2. Cell Therapy Manufacturing Market in Asia-Pacific and Rest of the World for Stem Cell Therapies, Historical Trends (since 2022) and Forecasted Estimates (till 2035)
- 34.1.3. Cell Therapy Manufacturing Market in Asia-Pacific and Rest of the World for TCR Cell Therapies, Historical Trends (since 2022) and Forecasted Estimates (till 2035)
- 34.1.4. Cell Therapy Manufacturing Market in Asia-Pacific and Rest of the World for TIL Cell Therapies, Historical Trends (since 2022) and Forecasted Estimates (till 2035)
- 34.1.5. Cell Therapy Manufacturing Market in Asia-Pacific and Rest of the World for Dendritic Cell Therapies, Historical Trends (since 2022) and Forecasted Estimates (till 2035)
- 34.1.6. Cell Therapy Manufacturing Market in Asia-Pacific and Rest of the World for Other Cell Therapies, Historical Trends (since 2022) and Forecasted Estimates (till 2035)
- 34.2. Cell Therapy Manufacturing Market in Asia-Pacific and Rest of the World: Distribution by Source of Cells
- 34.2.1. Cell Therapy Manufacturing Market in Asia-Pacific and Rest of the World for Autologous Cells, Historical Trends (since 2022) and Forecasted Estimates (till 2035)
- 34.2.2. Cell Therapy Manufacturing Market in Asia-Pacific and Rest of the World for Allogeneic Cells, Historical Trends (since 2022) and Forecasted Estimates (till 2035)
- 34.2.3. Cell Therapy Manufacturing Market in Asia-Pacific and Rest of the World for Other Cells, Historical Trends (since 2022) and Forecasted Estimates (till 2035)
- 34.3. Cell Therapy Manufacturing Market in Asia-Pacific and Rest of the World: Distribution by Scale of Operation
- 34.3.1. Cell Therapy Manufacturing Market in Asia-Pacific and Rest of the World for Clinical Scale, Historical Trends (since 2022) and Forecasted Estimates (till 2035)
- 34.3.2. Cell Therapy Manufacturing Market in Asia-Pacific and Rest of the World for Commercial Scale, Historical Trends (since 2022) and Forecasted Estimates (till 2035)
- 34.4. Cell Therapy Manufacturing Market in Asia-Pacific and Rest of the World: Distribution by Type of Manufacturer
- 34.4.1. Cell Therapy Manufacturing Market in Asia-Pacific and Rest of the World for Contract Manufacturing Organizations, Historical Trends (since 2022) and Forecasted Estimates (till 2035)
- 34.4.2. Cell Therapy Manufacturing Market in Asia-Pacific and Rest of the World for In-House Manufacturers, Historical Trends (since 2022) and Forecasted Estimates (till 2035)
- *Detailed information on Chapters 32-34 is available in the Excel Data Packs shared along with the report**
35. CONCLUDING REMARKS
36. EXECUTIVE INSIGHTS
- 36.1. Chapter Overview
- 36.2. Company A (Mid-sized Company, Australia)
- 36.2.1. Company Snapshot
- 36.2.2. Interview Transcript: Marketing Manager, Cell Therapy
- 36.3. Company B (UK)
- 36.3.1. Company Snapshot
- 36.3.2. Interview Transcript: Director
- 36.4. Company C (Small Company, Belgium)
- 36.4.1. Company Snapshot
- 36.4.2. Interview Transcript: Marketing Director
- 36.5. Company D (Large Company, Poland)
- 36.5.1. Company Snapshot
- 36.5.2. Interview Transcript: Management Board Vice-President
- 36.6. Company E (Small Company, US)
- 36.6.1. Company Snapshot
- 36.6.2. Interview Transcript: Senior Director of Sales Advanced Therapies; Vice President of Marketing
- 36.7. Company F (Mid-sized Company, Japan)
- 36.7.1. Company Snapshot
- 36.7.2. Interview Transcript: Business Administration Department Manager
- 36.8. Company G (Small Company, Netherlands)
- 36.8.1. Company Snapshot
- 36.8.2. Interview Transcript: Chief Business Officer
- 36.9. Company H (US)
- 36.9.1. Company Snapshot
- 36.9.2. Interview Transcript: Director of Finance and Facility Operations
- 36.10. Company I (Very Large Company, Japan)
- 36.10.1. Company Snapshot
- 36.10.2. Interview Transcript: Senior Director
- 36.11. Company J (Mid-sized Company, UK)
- 36.11.1. Company Snapshot
- 36.11.2. Interview Transcript: Chief Executive Officer
- 36.12. Company K (Large Company, US)
- 36.12.1. Company Snapshot
- 36.12.2. Interview Transcript: Former Chief Technical Officer
- 36.13. Company L (Small Company, Netherlands)
- 36.13.1. Company Snapshot
- 36.13.2. Interview Transcript: Former Chief Executive Officer,
- 36.14. Company M (Small Company, France)
- 36.14.1. Company Snapshot
- 36.14.2. Interview Transcript: Former General Manager
- 36.15. Company N (Large Company, China)
- 36.15.1. Company Snapshot
- 36.15.2. Interview Transcript: Chief Executive Officer
- 36.16. Company O (Small Company, Israel)
- 36.16.1. Company Snapshot
- 36.16.2. Interview Transcript: Executive Vice President Research and Development
- 36.17. Company P (Mid-sized Company, UK)
- 36.17.1. Company Snapshot
- 36.17.2. Interview Transcript: Former Business Development Manager
- 36.18. Company Q (US)
- 36.18.1. Company Snapshot
- 36.18.2. Interview Transcript: Professor and American Red Cross Chair in Transfusion Medicine
- 36.19. Company R (Small Company, Singapore)
- 36.19.1. Company Snapshot
- 36.19.2. Interview Transcript: Former Co-Founder and Chief Executive Officer
- 36.20. Company S (Mid-sized Company, Canada)
- 36.20.1. Company Snapshot
- 36.20.2. Interview Transcript: Former Manager, Business Development and Operations-cGMP Manufacturing Unit
- 36.21. Company T (Small Company, US)
- 36.21.1. Company Snapshot
- 36.21.2. Interview Transcript: Manager of Business Development
- 36.22. Company U (Mid-sized Company, France)
- 36.22.1. Company Snapshot
- 36.22.2. Interview Transcript: Former Department Leader, Cell Therapy Innovation and Development
- 36.23. Company V (Mid-sized Company, Australia)
- 36.23.1. Company Snapshot
- 36.23.2. Interview Transcript: Former Chief Executive Officer
- 36.24. Company W (Small Company, Netherlands)
- 36.24.1. Company Snapshot
- 36.24.2. Interview Transcript: Chief Executive Officer
