
|
시장보고서
상품코드
2072251
대사 기반 암 치료제 시장(제2판) : 치료법 유형별, 투여 경로별, 대상 질환 및 적응증별, 지역별 내역 및 치료제 판매량 예측 - 동향과 예측(2026-2035년)Cancer Metabolism Based Therapeutics Market (2nd Edition) Distribution by Type of Modality, Route of Administration, Target Disease Indication, Geographical Regions and Sales Forecast of Therapies - Trends and Forecast 2026-2035 |
||||||
대사 기반 암 치료제 시장 : 개요
대사 기반 암 치료제 시장 규모는 올해 37억 달러에서 2035년까지 263억 달러로 확대되어 2035년까지 예측 기간 동안 CAGR 24.3%로 성장할 것으로 추정됩니다.
대사 기반 암 치료제 시장 - 성장 및 동향
암은 여전히 전 세계 보건에 큰 부담이 되고 있으며, 매년 수백만 명의 사람들에게 영향을 미치고 있습니다. 암세포의 증식과 진행은 대사 재프로그래밍에 의해 촉진됩니다. 이는 암세포가 정상 세포와는 다른 방식으로 영양소를 이용할 수 있게 하는 과정입니다. 이러한 재프로그래밍은 포도당 흡수 증가(워버그 효과와 관련), 미토콘드리아 기능 장애, 글루타민 및 지질 등의 영양소에 대한 의존도 증가 등 주요 대사 경로의 변화를 특징으로 합니다. 이러한 변화들이 종합적으로, 건강한 세포와 비교했을 때 암세포 특유의 대사 프로파일을 정의하고 있습니다.
20세기 중반, 오토 바르버그가 수행한 암 대사에 관한 획기적인 연구를 통해 종양 조직이 호기성 당분해를 우선적으로 이용한다는 사실이 입증되었습니다. 이 발견을 계기로, 산업계와 학계의 이해관계자 양측 모두에서 종양의 생존에 필수적인 재프로그래밍된 대사 경로를 표적으로 삼는 연구에 대한 관심이 크게 높아졌습니다. 그 후, 연구 활동은 트리카르복실산(TCA) 회로, 지질 생합성, 아미노산, 펜토스 인산 및 뉴클레오티드 대사 등의 경로에 관여하는 주요 효소의 규명 및 특성 분석에 초점을 맞춰 왔습니다.
이러한 기초적인 연구 성과가 대사 기반 암 치료제 개발과 발전을 이끌어 왔습니다. 이러한 치료제는 종양 특이적인 대사 경로를 효과적으로 표적으로 삼아 그 기능을 억제함으로써, 통제 불가능한 세포 증식을 억제할 수 있는 유망한 가능성을 보여주고 있습니다. 유망한 치료 성과에 힘입어, 각 기업은 세계 암 대사 치료제 시장에서 연구 개발 활동을 가속화하기 위해 수많은 전략적 제휴를 맺고 있습니다. 후보 약물이 후기 임상 개발 단계로 진입함에 따라 제휴 활동이 더욱 활발해질 것으로 예상되며, 향후 몇 년간 시장의 견조한 성장을 뒷받침할 것으로 전망됩니다.
성장 요인 - 시장 확대의 전략적 원동력
대사 기반 암 치료제 시장의 성장은 개별 종양 프로파일과 관련된 특이적인 대사 경로를 표적으로 삼는 정밀 의학 접근법의 채택 확대에 힘입어 이루어지고 있습니다. 이를 통해 보다 맞춤형의 효과적인 치료 전략을 개발할 수 있게 되었습니다. 이러한 변화에 따라, 각 제약사는 표적 암 치료에 대한 수요 증가에 대응하기 위해 연구개발 파이프라인 확충을 추진하고 있습니다. 동시에 전 세계적으로 암으로 인한 부담은 계속해서 급격히 증가하고 있으며, 1년 동안 약 2,000만 명의 신규 환자와 1,000만 명 이상의 사망자가 보고되고 있습니다. 또한, 인구 증가와 인구 동향에 따라 2050년까지 연간 환자 수가 3,500만 명을 넘어설 가능성이 있다는 예측도 제시되고 있습니다. 이러한 유병률의 급증은 암세포에서 재프로그래밍된 대사 경로에 초점을 맞추어, 기존 치료법에 비해 효능을 높이고 고도의 개인화를 실현하는 대사 기반 암 치료제 등 혁신적인 치료 솔루션이 시급히 필요함을 여실히 보여주고 있습니다.
시장의 과제 - 진전을 가로막는 중대한 장벽
대사 기반 암 치료제 시장은 표적 특이성의 한계와 종양 대사가 본질적으로 지닌 복잡성으로 인해 중대한 과제에 직면해 있습니다. 암세포와 정상세포는 대사 경로가 중복되는 경우가 많기 때문에 오프타겟 효과가 발생하기 쉬우며, 많은 기존 치료법은 표적 특이성이 불충분하고 독성이 높습니다. 이러한 문제들은 임상시험의 높은 실패율, 규제 당국의 승인 제한, 개발 비용 증가, 그리고 상업적 실현 가능성의 제약으로 이어지고 있습니다. 또한, 암세포의 대사 가소성은 또 다른 장벽이 되고 있으며, 이로 인해 암세포는 영양 결핍이나 저산소 상태와 같은 미세환경의 스트레스에 동적으로 적응할 수 있게 됩니다. 종양 대사가 극히 불균일하고 유연한 특성을 가지고 있다는 점을 고려할 때, 이러한 적응 능력은 단일 대사 경로를 효과적으로 표적으로 삼으려는 노력을 복잡하게 만들고 있습니다. 그 결과, 화학요법이나 방사선 치료와 같은 기존의 치료법은 유전자 변이 및 단백질 발현 프로파일의 차이로 인해 치료 성과에 편차가 나타나며, 일부 환자에게만 효과가 있는 것으로 나타났습니다. 이러한 편차는 종양학 분야에서 정밀하고 맞춤형 치료 접근법을 추진하는 것이 지극히 중요하다는 점을 여실히 보여주고 있습니다.
대사 기반 암 치료제 시장 : 주요 인사이트
본 보고서에서는 대사에 기반한 항암제 시장의 현황을 상세히 분석하고, 업계 내 잠재적인 성장 기회를 파악하고 있습니다. 보고서의 주요 조사 결과는 다음과 같습니다:
- 현재, 약 250건에 달하는 대사 기반 암 치료제 개발 프로그램이 종양 세포 특유의 대사적 취약점을 활용하여 광범위한 암 질환을 대상으로 하고 있습니다.

- 대사 기반 암 치료제 프로그램의 90% 가까이가 임상 단계에 있으며, 그중 과반수(52%)는 2상 임상시험에서 검토되고 있습니다.
- 시험의 상당 부분(약 30%)이 2025년에 등록되었습니다. 또한, 시험의 70% 이상이 현재 대사 기반 암 치료제 연구의 대상자가 될 피험자를 모집하고 있습니다.
- 대사 기반 암 치료제 시장에서 체결된 계약의 약 65%는 지난 2년 동안 체결되었습니다. 특히, 계약의 과반수(50% 이상)는 북미에 본사를 둔 기업들과 체결되었습니다.
- 암 발병률의 증가, 표적 치료법의 발전, 그리고 연구개발(R&D) 활동에 대한 자금 투자의 확대가 시장 성장을 주도하고 있습니다.
- 암 유병률의 증가와 종양 대사 연구 분야의 눈부신 발전으로 인해, 전 세계 대사 기반 암 치료제 시장은 2035년까지 연평균 성장률(CAGR) 24.3%를 기록하며 성장할 것으로 전망됩니다.

- 미국의 대사 기반 암 치료제 시장은 임상에서의 활용 확대와 대사 기반 암 치료제 채택 증가에 힘입어, 예측 기간 동안 안정적인 연평균 성장률(CAGR)을 기록하며 성장할 것으로 전망됩니다.
- 이미 시장에 진출한 기업들의 존재, 암 진단 환자 수의 급격한 증가, 그리고 지속적인 기술 발전으로 인해 미국의 대사 기반 암 치료제 시장은 상당한 성장을 이룰 것으로 예상됩니다.
대사 기반 암 치료제 시장
시장 규모 및 기회 분석은 다음 매개변수를 기준으로 세분화되어 있습니다:
치료법 유형별
- 저분자 의약품
- 생물학적 제제
투여 경로별
- 경구
- 정맥 내
- 근육 내
대상 질환·적응증별
- 유방암
- 비소세포폐암
- 급성 골수성 백혈병
- 뇌종양
- 담관암
- 담도암
- 골수이형성증후군
- 악성 중피종
- 연부조직 육종
- 간세포암
- 췌장암
지역별
- 북미
- 유럽
- 아시아태평양
- 기타 지역
치료제 매출 전망
- 달라크손라시브
- 게다트리시브
- 오로모라시브
- 이나보리시브
- 보라시데닙
- STX-478
- AZD 5363
- AG-120
- 셀펠카티닙
- ADI-PEG 20
- 오그틸로
- 타레트레쿠티닙
- 픽레이
- TAS-120
- 레즐리디아
- AG-221
대사 기반 암 치료제 시장 - 주요 부문
대사 기반 암 치료제 시장에서 어떤 투여 경로가 가장 큰 점유율을 차지하고 있습니까?
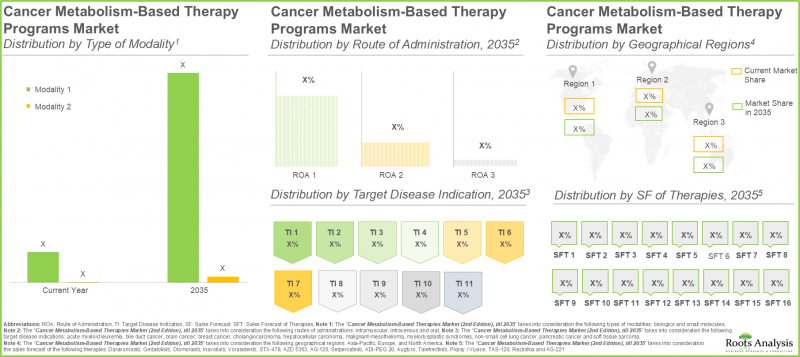
2035년까지 경구 투여 부문이 시장 점유율의 최대 약 85%를 차지할 것으로 예상되며, 예측 기간 동안 꾸준한 성장이 전망됩니다. 이러한 장점은 다른 투여 경로와 비교했을 때 비침습적이라는 점, 투여가 용이하다는 점, 그리고 환자의 복약 순응도가 높다는 점에 기인하는 것으로 보입니다. 한편, 근육 내 투여 부문은 대사 억제제를 장기간에 걸쳐 제어된 방식으로 지속적으로 방출할 수 있어, 안정적인 치료제 농도를 유지하고 투여 빈도를 줄일 수 있기 때문에 더 높은 연평균 성장률(CAGR)을 기록할 것으로 예상됩니다.
어떤 투여법이 가장 큰 점유율을 차지할까요?
시장 분석에 따르면, 2035년까지 저분자 의약품 부문이 암 대사 치료제 시장에서 가장 큰 점유율을 차지할 것으로 예상됩니다. 이러한 우위는 입증된 효능, 투여의 용이성, 비용 대비 효율이 높은 제조 공정, 그리고 확립된 안전성 프로파일에 의해 뒷받침되고 있습니다.
지역별 시장 분석 : 어느 지역이 가장 빠른 성장세를 보이고 있을까요?
북미 : 최대의 지역 시장
북미는 미국 내 대사 기반 암 치료제에 대한 수요가 증가하고, 해당 지역에서 확고한 입지를 구축한 치료제 개발 기업들의 강력한 존재감을 바탕으로, 2035년까지 세계 시장 점유율의 45% 이상을 차지할 것으로 전망됩니다. 또한, 몇몇 주요 제조업체들은 증가하는 지역 수요에 대응하기 위해 최근 개발 및 생산능력을 확대하고 있습니다.
아시아태평양 : 가장 빠르게 성장하고 있는 지역 시장
대사 기반 암 치료제 시장에서 아시아태평양은 새로운 대사 기반 암 치료법의 연구 개발에 대한 투자 증가와 전문 역량을 갖춘 개발 기업을 우대하는 규제 체계에 힘입어, 2035년까지 더 높은 연평균 성장률(CAGR)을 기록할 것으로 예상됩니다. 또한, 해당 지역의 환자 수 증가로 인해 의약품 및 헬스케어 제품의 잠재 시장이 확대되고 있으며, 이로 인해 시장 전체의 성장을 견인하고 있습니다.
대사 기반 암 치료제 시장의 주요 기업 사례
- Bristol Myers Squibb
- Eli Lilly
- Novartis
- Polaris
- Roche
대사 기반 암 치료제 시장 : 조사 범위
- 시장 규모 및 기회 분석 : 본 보고서에서는 대사 기반 암 치료제 시장에 대한 상세한 분석을 수행하고 있으며, [A] 치료법 유형, [B] 투여 경로, [C] 대상 질환, [D] 지역 및 [E] 치료제 매출 전망과 같은 주요 시장 부문에 초점을 맞추고 있습니다.
- 대사 기반 암 치료제 시장의 시장 동향 : 대사 기반 암 치료제 시장 전체의 시장 동향에 대한 상세한 평가 외에도, [A]대사 경로, [B] 표적, [C] 대상 질환, [D] 투여 경로, [E] 치료법 유형, [F] 치료법 유형, [G] 의약품 지정, [H] 설립 연도, [I] 기업 규모 및 [J] 본사 소재지 등 관련 여러 매개변수에 대한 정보를 수록하고 있습니다.
- 기업 개요 : 북미, 유럽, 아시아태평양에 거점을 둔 주요 기업의 상세한 프로필입니다. [A]설립 연도, [B]본사 소재지, [C]제품 포트폴리오, [D]최근 동향, [E]향후 전망 등 여러 가지 지표를 바탕으로 작성되었습니다.
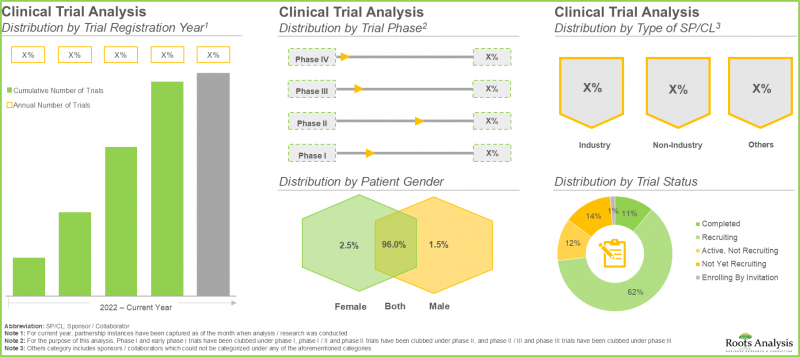
- 임상시험 분석 : 대사 기반 암 치료제를 조사하기 위해 완료된 및 진행 중인 임상시험에 대해 [A]시험 등록 연도, [B]시험 현황, [C]시험 단계, [D]등록 환자 수, [E]시험 설계, [F] 후원자 유형, [G] 환자의 성별, [H] 가장 활발한 업계 및 업계 외 참여자, [I] 지리적 분포와 같은 관련 매개변수를 바탕으로 상세한 분석을 수행합니다.
- 제휴 및 공동 연구 분석 : 이 분야에 종사하는 이해관계자별로 체결된 제휴에 대한 분석입니다. 여기에는 다양한 제휴 모델의 개요 외에도 [A] 제휴 연도, [B] 제휴 유형, 그리고 [C] 지역 분석을 바탕으로 한 제휴에 대한 상세한 분석이 포함됩니다.
- 시장 영향 분석 : 시장 성장에 영향을 미칠 수 있는 요인에 대한 상세한 분석입니다. 또한, 이 분야의 주요 촉진요인, 잠재적 제약요인, 새로운 기회 및 기존 과제를 파악하고 분석하는 내용도 포함되어 있습니다.
목차
제1장 배경
제2장 조사 방법
제3장 시장 역학
제4장 거시경제 지표
제5장 주요 요약
제6장 소개
제7장 시장 구도
제8장 기업 개요
제9장 임상시험 분석
제10장 파트너십과 협력 관계
제11장 시장 영향 분석
제12장 세계의 대사 기반 암 치료제 시장
제13장 대사 기반 암 치료제 시장(치료법 유형별)
제14장 대사 기반 암 치료제 시장(투여 경로별)
제15장 대사 기반 암 치료제 시장 : 대상 질환별
제16장 대사 기반 암 치료제 시장(지역별)
제17장 대사 기반 암 치료제 시장, 북미
제18장 대사 기반 암 치료제 시장, 유럽
제19장 대사 기반 암 치료제 시장, 아시아태평양
제20장 대사 기반 암 치료제 시장, 의약품 판매 예측
제21장 결론
제22장 경영진 인사이트
제23장 부록 I : 표형식 데이터
제24장 부록 II : 기업 및 조직 리스트
KSM 26.07.03Cancer Metabolism Based Therapeutics Market: Overview
As per Roots Analysis, the cancer metabolism based therapeutics market is estimated to grow from USD 3.7 billion in the current year to USD 26.3 billion by 2035, at a CAGR of 24.3% during the forecast period, till 2035.
Cancer Metabolism Based Therapeutics Market: Growth and Trends
Cancer continues to represent a major global health burden, impacting millions of individuals annually. The progression and proliferation of cancer cells are driven by metabolic reprogramming, a process that enables these cells to utilize nutrients differently from normal cells. This reprogramming is characterized by alterations in key metabolic pathways, including elevated glucose absorption (associated with the Warburg effect), impaired mitochondrial function, and increased reliance on nutrients such as glutamine and lipids. These changes collectively define the distinct metabolic profile of cancer cells compared to healthy cells.
In the mid-20th century, the seminal work of Otto Warburg in cancer metabolism demonstrated that tumor tissues preferentially utilize aerobic glycolysis. This discovery catalyzed significant interest among both industry and academic stakeholders in targeting reprogrammed metabolic pathways critical for tumor survival. Subsequently, research efforts have focused on identifying and characterizing key enzymes involved in pathways such as the tricarboxylic acid (TCA) cycle, lipid biosynthesis, and amino acid, pentose phosphate, and nucleotide metabolism.
These foundational insights have driven the development and advancement of cancer metabolism-based therapeutics, which have shown promise in effectively targeting and disrupting tumor-specific metabolic pathways, thereby inhibiting uncontrolled cell proliferation. Supported by encouraging therapeutic outcomes, companies have entered into numerous strategic collaborations to accelerate research and development activities within the global cancer metabolism therapeutics market. As more candidates progress into late-stage clinical development, partnership activity is expected to intensify, supporting robust market growth in the coming years.
Growth Drivers: Strategic Enablers of Market Expansion
The growth of the cancer metabolism-based therapeutics market is being driven by the increasing adoption of precision medicine approaches that target the distinct metabolic pathways associated with individual tumor profiles, enabling the development of more personalized and effective treatment strategies. This shift is encouraging pharmaceutical companies to expand their research and development pipelines to address the rising demand for targeted cancer therapies. At the same time, the global cancer burden continues to increase significantly, with approximately 20 million new cases and over 10 million deaths reported in a single year, and projections suggesting that annual incidence could exceed 35 million cases by 2050 due to population growth and demographic trends. This escalating prevalence underscores the urgent need for innovative therapeutic solutions, such as cancer metabolism-based therapies, which focus on reprogrammed metabolic pathways in cancer cells and offer improved efficacy and a higher degree of personalization compared to conventional treatment approaches.
Market Challenges: Critical Barriers Impeding Progress
The cancer metabolism-based therapeutics market faces significant challenges due to limitations in target specificity and the inherent complexity of tumor metabolism. Many existing therapies demonstrate suboptimal target specificity and elevated toxicity, as cancerous and healthy cells often share overlapping metabolic pathways, leading to off-target effects. These issues contribute to high clinical trial failure rates, limited regulatory approvals, increased development costs, and constrained commercial viability. Furthermore, the metabolic plasticity of cancer cells presents an additional hurdle, enabling them to dynamically adapt to microenvironmental stresses such as nutrient deprivation and hypoxia. This adaptability complicates efforts to effectively target a single metabolic pathway, given the highly heterogeneous and flexible nature of tumor metabolism. As a result, conventional treatments such as chemotherapy and radiation therapy yield variable outcomes and are effective only in a subset of patients, owing to differences in genetic mutations and protein expression profiles. This variability underscores the critical need for advancing precision and personalized therapeutic approaches in oncology.
Cancer Metabolism Based Therapeutics Market: Key Insights
The report delves into the current state of the cancer metabolism based therapeutics market and identifies potential growth opportunities within industry. Some key findings from the report include:
- Currently, close to 250 cancer metabolism-based therapy programs are exploiting the unique metabolic vulnerabilities of tumor cells for targeting a wide range of cancer disease indications.
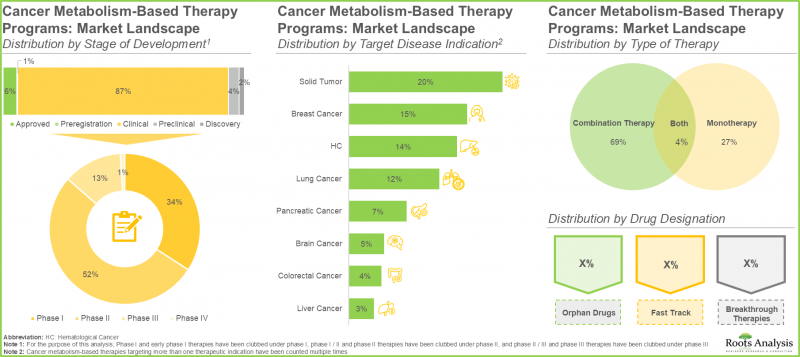
- Close to 90% of the cancer metabolism-based therapy programs are in clinical stages; majority (52%) of these programs are being investigated in phase II clinical trials.
- A sizeable proportion of the trials (~30%) were registered in 2025; over 70% of the trials are currently recruiting potential candidates for the investigation of cancer metabolism-based therapies.
- Around 65% of the agreements in the cancer metabolism-based therapies market were inked in the last two years; notably, majority (>50%) of the deals were inked by players headquartered in North America.

- Growing cancer burden, advancements in targeted therapies and increasing funding in R&D activities is driving market growth.
- Owing to the rising prevalence of cancer along with significant advances in tumor metabolism research, the global cancer metabolism-based therapies market is anticipated to grow at a CAGR of 24.3% till 2035.
- The cancer metabolism-based therapies market in the US is expected to grow at a steady CAGR during the forecast period, due to the expanding clinical use and growing adoption of cancer metabolism-based therapies.
- Owing to the presence of established market players, rapid increase in patients diagnosed with cancer, along with ongoing technological advancements, the cancer metabolism-based therapeutics market in the US is expected to witness substantial growth.
Cancer Metabolism based Therapeutics Market
The market sizing and opportunity analysis has been segmented across the following parameters:
By Type of Modality
- Small Molecules
- Biologics
By Route of Administration
- Oral
- Intravenous
- Intramuscular
By Target Disease Indication
- Breast Cancer
- Non-small Cell Lung Cancer
- Acute Myeloid Leukemia
- Brain Cancer
- Cholangiocarcinoma
- Bile Duct Cancer
- Myelodysplastic Syndromes
- Malignant-mesothelioma
- Soft Tissue Sarcoma
- Hepatocellular Carcinoma
- Pancreatic Cancer
By Geographical Regions
- North America
- Europe
- Asia-Pacific
- Rest of the World
By Sales Forecast of Therapies
- Daraxonrasib
- Gedatolisib
- Olomorasib
- Inavolisib
- Vorasidenib
- STX-478
- AZD 5363
- AG-120
- Selpercatinib
- ADI-PEG 20
- Augtyro
- Taletrectinib
- Piqray
- TAS-120
- Rezlidhia
- AG-221
Cancer Metabolism Based Therapeutics Market: Key Segments
Which Route of Administration Accounts for the Largest Cancer Metabolism Based Therapeutics Market Share?
By 2035, the oral route of administration segment is expected to account for the largest share of the market, capturing approximately 85%, while also demonstrating strong growth throughout the forecast period. This dominance can be attributed to its non-invasive nature, ease of administration, and higher patient compliance compared to alternative delivery routes. Meanwhile, the intramuscular segment is projected to register a higher compound annual growth rate (CAGR), driven by its ability to enable controlled and sustained release of metabolic inhibitors over extended durations, thereby maintaining stable therapeutic drug levels and reducing dosing frequency.
Which Type of Modality Accounts for the Largest Share?
Based on market analysis, the small molecules segment is expected to capture the largest share of the Cancer Metabolism based Therapeutics Market by 2035. This dominance is driven by their demonstrated efficacy, ease of administration, cost-effective manufacturing, and well-established safety profiles.
Regional Market Analysis: Which Regions are Showing the Fastest Growth?
North America: Largest Regional Market
North America is projected to account for over 45% of the global market share by 2035, driven by the increasing demand for cancer metabolism-based therapies in the United States and the strong presence of established therapy developers in the region. Additionally, several leading manufacturers have expanded their development and production capabilities in recent years to address the growing regional demand.
Asia-Pacific: Fastest Growing Regional Market
The Asia-Pacific market in Cancer Metabolism based Therapeutics Market is anticipated to register a higher CAGR through 2035, supported by increasing investments in research and development of novel cancer metabolism-based therapies and regulatory frameworks that favor developers with specialized capabilities. Additionally, the region's expanding patient population is enlarging the addressable market for pharmaceuticals and healthcare products, thereby driving overall market growth.
Example Players in Cancer Metabolism based Therapeutics Market
- Bristol Myers Squibb
- Eli Lilly
- Novartis
- Polaris
- Roche
Cancer Metabolism Based Therapeutics Market: Research Coverage
- Market Sizing and Opportunity Analysis: The report features an in-depth analysis of the Cancer Metabolism based Therapeutics Market, focusing on key market segments, including [A] type of modality, [B] route of administration, [C] target disease indication, [D] geographical regions, and [E] sales forecast of therapies.
- Cancer Metabolism-Based Therapies Market Landscape: A detailed assessment of the overall cancer metabolism-based therapies market landscape, along with information on several relevant parameters, such as [A] metabolic pathway, [B] target, [C] target disease indication, [D] route of administration, [E] type of modality, [F] type of therapy, [G] drug designation, [H] year of establishment [I] company size, and [J] location of headquarters.
- Company Profiles: In-depth profiles of key companies based in North America, Europe and Asia-Pacific based on several parameters such as [A] year of establishment, [B] location of headquarters, [C] product portfolio, [D] recent developments and [E] an informed future outlook.
- Clinical Trial Analysis: An in-depth analysis of completed and ongoing clinical trials investigating cancer metabolism-based therapies, based on several relevant parameters, such as [A] trial registration year, [B] trial status, [C] trial phase, [D] patients enrolled, [E] trial study design, [F] type of sponsor, [G] patient gender, [H] most active industry and non-industry players and [I] geographical distribution.
- Partnerships and Collaborations Analysis: An analysis of the partnerships that have been inked by stakeholders engaged in this domain. It includes a brief description of various partnership models and includes a detailed analysis of partnerships based on [A] year of partnership, [B] type of partnership, and [C] geographical analysis.
- Market Impact Analysis: An in-depth analysis of the factors that can impact the growth of the market. It also features identification and analysis of key drivers, potential restraints, emerging opportunities, and existing challenges in this domain.
Key Questions Answered in this Report
- Which are the leading companies in the Cancer Metabolism based Therapeutics Market?
- Which region dominates the Cancer Metabolism based Therapeutics Market?
- What are the key trends observed in the Cancer Metabolism based Therapeutics Market?
- What factors are likely to influence the evolution of this market?
- What are the primary challenges faced by cancer metabolism-based therapeutic developers?
- What is the current and future market size?
- What is the CAGR of this market?
- How is the current and future market opportunity likely to be distributed across key market segments?
Reasons to Buy this Report
- The report provides a comprehensive market analysis, offering detailed revenue projections of the overall market and its specific sub-segments. This information is valuable to both established market leaders and emerging entrants.
- The report offers stakeholders a comprehensive overview of the market, including key drivers, barriers, opportunities, and challenges. This information empowers stakeholders to stay abreast of market trends and make data-driven decisions to capitalize on growth prospects.
- The report can aid businesses in identifying future opportunities in any sector. It also helps in understanding if those opportunities are worth pursuing.
- The report helps in identifying customer demand by understanding the needs, preferences, and behavior of the target audience in order to tailor products or services effectively.
- The report equips new entrants with requisite information regarding a particular market to help them build successful business strategies.
- The report allows for more effective communication with the audience and in building strong business relations.
Additional Benefits
- Complimentary Excel Data Packs for all Analytical Modules in the Report
- 15% Free Content Customization
- Detailed Report Walkthrough Session with Research Team
- Free Updated report if the report is 6-12 months old or older
TABLE OF CONTENTS
1. BACKGROUND
- 1.1. Context
- 1.2. Project Objectives
2. RESEARCH METHODOLOGY
- 2.1. Chapter Overview
- 2.2. Research Assumptions
- 2.2.1. Market Landscape and Market Trends
- 2.2.2. Market Forecast and Opportunity Analysis
- 2.2.3. Comparative Analysis
- 2.3. Database Building
- 2.3.1. Data Collection
- 2.3.2. Data Validation
- 2.3.3. Data Analysis
- 2.4. Project Methodology
- 2.4.1. Secondary Research
- 2.4.1.1. Annual Reports
- 2.4.1.2. Academic Research Papers
- 2.4.1.3. Company Websites
- 2.4.1.4. Investor Presentations
- 2.4.1.5. Regulatory Filings
- 2.4.1.6. White Papers
- 2.4.1.7. Industry Publications
- 2.4.1.8. Conferences and Seminars
- 2.4.1.9. Government Portals
- 2.4.1.10. Media and Press Releases
- 2.4.1.11. Newsletters
- 2.4.1.12. Industry Databases
- 2.4.1.13. Roots Proprietary Databases
- 2.4.1.14. Paid Databases and Sources
- 2.4.1.15. Social Media Portals
- 2.4.1.16. Other Secondary Sources
- 2.4.2. Primary Research
- 2.4.2.1. Types of Primary Research
- 2.4.2.1.1. Qualitative Research
- 2.4.2.1.2. Quantitative Research
- 2.4.2.1.3. Hybrid Approach
- 2.4.2.2. Advantages of Primary Research
- 2.4.2.3. Techniques for Primary Research
- 2.4.2.3.1. Interviews
- 2.4.2.3.2. Surveys
- 2.4.2.3.3. Focus Groups
- 2.4.2.3.4. Observational Research
- 2.4.2.3.5. Social Media Interactions
- 2.4.2.4. Key Opinion Leaders Considered in Primary Research
- 2.4.2.4.1. Company Executives (CXOs)
- 2.4.2.4.2. Board of Directors
- 2.4.2.4.3. Company Presidents and Vice Presidents
- 2.4.2.4.4. Research and Development Heads
- 2.4.2.4.5. Technical Experts
- 2.4.2.4.6. Subject Matter Experts
- 2.4.2.4.7. Scientists
- 2.4.2.4.8. Doctors and Other Healthcare Providers
- 2.4.2.5. Ethics and Integrity
- 2.4.2.5.1. Research Ethics
- 2.4.2.5.2. Data Integrity
- 2.4.2.1. Types of Primary Research
- 2.4.3. Analytical Tools and Databases
- 2.4.1. Secondary Research
- 2.5. Robust Quality Control
3. MARKET DYNAMICS
- 3.1. Chapter Overview
- 3.2. Forecast Methodology
- 3.2.1. Top-down Approach
- 3.2.2. Bottom-up Approach
- 3.2.3. Hybrid Approach
- 3.3. Market Assessment Framework
- 3.3.1. Total Addressable Market (TAM)
- 3.3.2. Serviceable Addressable Market (SAM)
- 3.3.3. Serviceable Obtainable Market (SOM)
- 3.3.4. Currently Acquired Market (CAM)
- 3.4. Forecasting Tools and Techniques
- 3.4.1. Qualitative Forecasting
- 3.4.2. Correlation
- 3.4.3. Regression
- 3.4.4. Extrapolation
- 3.4.5. Convergence
- 3.4.6. Sensitivity Analysis
- 3.4.7. Scenario Planning
- 3.4.8. Data Visualization
- 3.4.9. Time Series Analysis
- 3.4.10. Forecast Error Analysis
- 3.5. Key Considerations
- 3.5.1. Demographics
- 3.5.2. Government Regulations
- 3.5.3. Reimbursement Scenarios
- 3.5.4. Market Access
- 3.5.5. Supply Chain
- 3.5.6. Industry Consolidation
- 3.5.7. Pandemic / Unforeseen Disruptions Impact
- 3.6. Limitations
4. MACRO-ECONOMIC INDICATORS
- 4.1. Chapter Overview
- 4.2. Market Dynamics
- 4.2.1. Time Period
- 4.2.1.1. Historical Trends
- 4.2.1.2. Current and Forecasted Estimates
- 4.2.2. Currency Coverage
- 4.2.2.1. Major Currencies Affecting the Market
- 4.2.2.2. Factors Affecting Currency Fluctuations
- 4.2.2.3. Impact of Currency Fluctuations on the Industry
- 4.2.3. Foreign Currency Exchange Rate
- 4.2.3.1. Impact of Foreign Exchange Rate Volatility on the Market
- 4.2.3.2. Strategies for Mitigating Foreign Exchange Risk
- 4.2.4. Recession
- 4.2.4.1. Assessment of Current Economic Conditions and Potential Impact on the Market
- 4.2.4.2. Historical Analysis of Past Recessions and Lessons Learnt
- 4.2.5. Inflation
- 4.2.5.1. Measurement and Analysis of Inflationary Pressures in the Economy
- 4.2.5.2. Potential Impact of Inflation on the Market Evolution
- 4.2.6. Interest Rates
- 4.2.6.1. Interest Rates and Their Impact on the Market
- 4.2.6.2. Strategies for Managing Interest Rate Risk
- 4.2.7. Commodity Flow Analysis
- 4.2.7.1. Type of Commodity
- 4.2.7.2. Origins and Destinations
- 4.2.7.3. Values and Weights
- 4.2.7.4. Modes of Transportation
- 4.2.8. Global Trade Dynamics
- 4.2.8.1. Import Scenario
- 4.2.8.2. Export Scenario
- 4.2.8.3. Trade Policies
- 4.2.8.4. Strategies for Mitigating the Risks Associated with Trade Barriers
- 4.2.8.5. Impact of Trade Barriers on the Market
- 4.2.9. War Impact Analysis
- 4.2.9.1. Russian-Ukraine War
- 4.2.9.2. Israel-Hamas War
- 4.2.10. COVID Impact / Related Factors
- 4.2.10.1. Global Economic Impact
- 4.2.10.2. Industry-specific Impact
- 4.2.10.3. Government Response and Stimulus Measures
- 4.2.10.4. Future Outlook and Adaptation Strategies
- 4.2.11. Other Indicators
- 4.2.11.1. Fiscal Policy
- 4.2.11.2. Consumer Spending
- 4.2.11.3. Gross Domestic Product
- 4.2.11.4. Employment
- 4.2.11.5. Taxes
- 4.2.11.6. Stock Market Performance
- 4.2.11.7. Cross Border Dynamics
- 4.2.1. Time Period
- 4.3. Conclusion
5. EXECUTIVE SUMMARY
- 5.1. Executive Summary: Market Landscape
- 5.2. Executive Summary: Market Trends
- 5.3. Executive Summary: Market Forecast and Opportunity Analysis
6. INTRODUCTION
- 6.1. Overview of Cancer Metabolism-Based Therapies
- 6.2. Key Metabolic Alterations Associated with Cancer Cells
- 6.3. Core Metabolic Pathways Associated with Cancer
- 6.4. Advantages of Cancer Metabolism-Based Therapies
- 6.5. Challenges Associated with Cancer Metabolism-Based Therapies
- 6.6. Future Outlook
7. MARKET LANDSCAPE
- 7.1. Methodology and Key Parameters
- 7.2. Cancer Metabolism-Based Therapies: Overall Market Landscape
- 7.2.1. Analysis by Stage of Development
- 7.2.2. Analysis by Metabolic Pathway
- 7.2.3. Analysis by Target
- 7.2.4. Analysis by Target Disease Indication
- 7.2.5. Analysis by Route of Administration
- 7.2.6. Analysis by Type of Modality
- 7.2.7. Analysis by Type of Therapy
- 7.2.8. Analysis by Drug Designation
- 7.3. Cancer Metabolism-Based Therapies: Developer Landscape
- 7.3.1. Analysis by Year of Establishment
- 7.3.2. Analysis by Company Size
- 7.3.3. Analysis by Location of Headquarters
- 7.3.4. Analysis by Company Size and Location of Headquarters
- 7.3.5. Most Active Players: Analysis by Number of Therapies Developed
8. COMPANY PROFILES
- 8.1. Chapter Overview
- 8.2. AstraZeneca
- 8.2.1. Company Details
- 8.2.2. Cancer Metabolism-Based Drugs Portfolio
- 8.2.3. Key Initiatives
- 8.3. Bristol Myers Squibb
- 8.3.1. Company Details
- 8.3.2. Cancer Metabolism-Based Drugs Portfolio
- 8.3.3. Key Initiatives
- 8.4. Cornerstone Pharmaceuticals
- 8.4.1. Company Details
- 8.4.2. Cancer Metabolism-Based Drugs Portfolio
- 8.4.3. Key Initiatives
- 8.5. Eli Lilly
- 8.5.1. Company Details
- 8.5.2. Cancer Metabolism-Based Drugs Portfolio
- 8.5.3. Key Initiatives
- 8.6. Novartis
- 8.6.1. Company Details
- 8.6.2. Cancer Metabolism-Based Drugs Portfolio
- 8.6.3. Key Initiatives
- 8.7. Polaris
- 8.7.1. Company Details
- 8.7.2. Cancer Metabolism-Based Drugs Portfolio
- 8.7.3. Key Initiatives
- 8.8. Roche
- 8.8.1. Company Details
- 8.8.2. Cancer Metabolism-Based Drugs Portfolio
- 8.8.3. Key Initiatives
- 8.9. Servier
- 8.9.1. Company Details
- 8.9.2. Cancer Metabolism-Based Drugs Portfolio
- 8.9.3. Key Initiatives
9. CLINICAL TRIAL ANALYSIS
- 9.1. Methodology and Key Parameters
- 9.2. Cancer Metabolism-Based Therapies: Clinical Trial Analysis
- 9.2.1. Analysis by Trial Registration Year
- 9.2.2. Analysis by Trial Status
- 9.2.3. Analysis by Trial Registration Year and Trial Status
- 9.2.4. Analysis by Number of Patients Enrolled and Trial Registration Year
- 9.2.5. Analysis by Number of Patients Enrolled and Trial Status
- 9.2.6. Analysis by Trial Phase
- 9.2.7. Analysis by Number of Patients Enrolled and Trial Phase
- 9.2.8. Analysis by Study Design
- 9.2.8.1. Analysis by Design Masking
- 9.2.8.2. Analysis by Type of Intervention Model
- 9.2.8.3. Analysis by Trial Purpose
- 9.2.8.4. Analysis by Type of Allocation
- 9.2.9. Analysis by Type of Sponsor / Collaborator
- 9.2.10. Analysis by Patient Gender
- 9.2.11. Most Active Industry Players: Analysis by Number of Clinical Trials
- 9.2.12. Most Active Non-Industry Players: Analysis by Number of Clinical Trials
- 9.2.13. Analysis by Geography
- 9.2.13.1. Analysis of Clinical Trials by Trial Status, Trial Phase and Geography
- 9.2.13.2. Analysis of Clinical Trials by Trial Status and Geography
- 9.2.13.3. Analysis of Clinical Trials by Patients Enrolled, Trial Status and Geography
- 9.2.14. Geographical Distribution of Trials and Number of Patients Enrolled
- 9.2.14.1. Clinical Trials in North America: Key Insights
- 9.2.14.2. Clinical Trials in Europe: Key Insights
- 9.2.14.3. Clinical Trials in Asia-Pacific: Key Insights
- 9.2.14.4. Clinical Trials in Rest of the World: Key Insights
10. PARTNERSHIPS AND COLLABORATIONS
- 10.1. Partnership Models
- 10.2. Cancer Metabolism-Based Therapies: Partnerships and Collaborations
- 10.2.1. Analysis by Year of Partnership
- 10.2.2. Analysis by Type of Partnership
- 10.2.3. Analysis by Year and Type of Partnership
- 10.2.4. Analysis by Target Disease Indication
- 10.2.5. Most Active Players: Analysis by Number of Partnerships
- 10.2.6. Analysis by Geography
- 10.2.6.1. Local and International Deals
- 10.2.6.2. Intercontinental and Intracontinental Deals
11. MARKET IMPACT ANALYSIS
- 11.1. Chapter Overview
- 11.2. Market Drivers
- 11.3. Market Restraints
- 11.4. Market Opportunities
- 11.5. Market Challenges
12. GLOBAL CANCER METABOLISM-BASED THERAPIES MARKET
- 12.1. Forecast Methodology
- 12.2. Key Assumptions
- 12.3. Global Cancer Metabolism-Based Therapies Market, Historical Trends (Since 2021) and Forecasted Estimates (Till 2035)
- 12.4. Multivariate Scenario Analysis
- 12.4.1. Global Cancer Metabolism-Based Therapies Market, Forecasted Estimates (Till 2035), Conservative Scenario
- 12.4.2. Global Cancer Metabolism-Based Therapies Market, Forecasted Estimates (Till 2035), Optimistic Scenario
- 12.5. Key Market Segmentations
13. CANCER METABOLISM-BASED THERAPIES MARKET, BY TYPE OF MODALITY
- 13.1. Cancer Metabolism-Based Therapies Market: Distribution by Type of Modality
- 13.1.1. Cancer Metabolism-Based Therapies Market for Biologics: Historical Trends (Since 2021) and Forecasted Estimates (Till 2035)
- 13.1.2. Cancer Metabolism-Based Therapies Market for Small Molecules: Historical Trends (Since 2021) and Forecasted Estimates (Till 2035)
- 13.2. Data Triangulation and Validation
14. CANCER METABOLISM-BASED THERAPIES MARKET, BY ROUTE OF ADMINISTRATION
- 14.1. Cancer Metabolism-Based Therapies Market: Distribution by Route of Administration
- 14.1.1. Cancer Metabolism-Based Therapies Market for Oral Route: Historical Trends (Since 2021) and Forecasted Estimates (Till 2035)
- 14.1.2. Cancer Metabolism-Based Therapies Market for Intramuscular Route: Forecasted Estimates (Till 2035)
- 14.1.3. Cancer Metabolism-Based Therapies Market for Intravenous Route: Forecasted Estimates (Till 2035)
- 14.2. Data Triangulation and Validation
15. CANCER METABOLISM-BASED THERAPIES MARKET: BY TARGET DISEASE INDICATION
- 15.1. Cancer Metabolism-Based Therapies Market: Distribution by Target Disease Indication
- 15.1.1.Cancer Metabolism-Based Therapies Market for Breast Cancer: Historical Trends (Since 2021) and Forecasted Estimates (Till 2035)
- 15.1.2. Cancer Metabolism-Based Therapies Market for Non-small Cell Lung Cancer: Historical Trends (Since 2021) and Forecasted Estimates (Till 2035)
- 15.1.3. Cancer Metabolism-Based Therapies Market for Acute Myeloid Leukemia: Historical Trends (Since 2021) and Forecasted Estimates (Till 2035)
- 15.1.4. Cancer Metabolism-Based Therapies Market for Brain Cancer: Historical Trends (Since 2025) and Forecasted Estimates (Till 2035)
- 15.1.5. Cancer Metabolism-Based Therapies Market for Cholangiocarcinoma: Historical Trends (Since 2021) and Forecasted Estimates (Till 2035)
- 15.1.6. Cancer Metabolism-Based Therapies Market for Bile Duct Cancer: Historical Trends (Since 2022) and Forecasted Estimates (Till 2035)
- 15.1.7. Cancer Metabolism-Based Therapies Market for Myelodysplastic Syndromes: Historical Trends (Since 2021) and Forecasted Estimates (Till 2035)
- 15.1.8. Cancer Metabolism-Based Therapies Market for Malignant-mesothelioma: Forecasted Estimates (Till 2035)
- 15.1.9. Cancer Metabolism-Based Therapies Market for Pancreatic Cancer: Forecasted Estimates (Till 2035)
- 15.1.10. Cancer Metabolism-Based Therapies Market for Soft Tissue Sarcoma: Forecasted Estimates (Till 2035)
- 15.1.11. Cancer Metabolism-Based Therapies Market for Hepatocellular Carcinoma: Forecasted Estimates (Till 2035)
- 15.2. Data Triangulation and Validation
16. CANCER METABOLISM-BASED THERAPIES MARKET, BY GEOGRAPHY
- 16.1. Cancer Metabolism-Based Therapies Market: Distribution by Geography
- 16.1.1. Cancer Metabolism-Based Therapies Market in North America: Historical Trends (Since 2021) and Forecasted Estimates (Till 2035)
- 16.1.1.1. Cancer Metabolism-Based Therapies Market in the US: Historical Trends (Since 2021) and Forecasted Estimates (Till 2035)
- 16.1.1.2. Cancer Metabolism-Based Therapies Market in Canada: Historical Trends (Since 2021) and Forecasted Estimates (Till 2035)
- 16.1.2. Cancer Metabolism-Based Therapies Market in Europe: Historical Trends (Since 2021) and Forecasted Estimates (Till 2035)
- 16.1.2.1. Cancer Metabolism-Based Therapies Market in Germany: Historical Trends (Since 2021) and Forecasted Estimates (Till 2035)
- 16.1.2.2. Cancer Metabolism-Based Therapies Market in the France: Historical Trends (Since 2021) and Forecasted Estimates (Till 2035)
- 16.1.2.3. Cancer Metabolism-Based Therapies Market in UK: Historical Trends (Since 2021) and Forecasted Estimates (Till 2035)
- 16.1.2.4. Cancer Metabolism-Based Therapies Market in Italy: Historical Trends (Since 2021) and Forecasted Estimates (Till 2035)
- 16.1.2.5. Cancer Metabolism-Based Therapies Market in Spain: Historical Trends (Since 2021) and Forecasted Estimates (Till 2035)
- 16.1.2.6. Cancer Metabolism-Based Therapies Market in Rest of Europe: Historical Trends (Since 2021) and Forecasted Estimates (Till 2035)
- 16.1.3. Cancer Metabolism-Based Therapies Market in Asia-Pacific: Historical Trends (Since 2021) and Forecasted Estimates (Till 2035)
- 16.1.3.1. Cancer Metabolism-Based Therapies Market in China: Historical Trends (Since 2021) and Forecasted Estimates (Till 2035)
- 16.1.3.2. Cancer Metabolism-Based Therapies Market in Japan: Historical Trends (Since 2021) and Forecasted Estimates (Till 2035)
- 16.1.3.3. Cancer Metabolism-Based Therapies Market in India: Historical Trends (Since 2021) and Forecasted Estimates (Till 2035)
- 16.1.3.4. Cancer Metabolism-Based Therapies Market in South Korea: Historical Trends (Since 2021) and Forecasted Estimates (Till 2035)
- 16.1.3.5. Cancer Metabolism-Based Therapies Market in Rest of Asia-Pacific: Historical Trends (Since 2021) and Forecasted Estimates (Till 2035)
- 16.1.3.6. Cancer Metabolism-Based Therapies Market in Rest of the World: Historical Trends (Since 2021) and Forecasted Estimates (Till 2035)
- 16.1.1. Cancer Metabolism-Based Therapies Market in North America: Historical Trends (Since 2021) and Forecasted Estimates (Till 2035)
17. CANCER METABOLISM-BASED THERAPIES MARKET, NORTH AMERICA
- 17.1. Cancer Metabolism-Based Therapies Market in North America: Distribution by Type of Modality
- 17.1.1. Cancer Metabolism-Based Therapies Market in North America for Biologics: Historical Trends (Since 2021) and Forecasted Estimates (Till 2035)
- 17.1.2. Cancer Metabolism-Based Therapies Market in North America for Small Molecules: Historical Trends (Since 2021) and Forecasted Estimates (Till 2035)
- 17.2. Cancer Metabolism-Based Therapies Market in North America: Distribution by Route of Administration
- 17.2.1. Cancer Metabolism-Based Therapies Market in North America for Oral Route: Historical Trends (Since 2021) and Forecasted Estimates (Till 2035)
- 17.2.2. Cancer Metabolism-Based Therapies Market in North America for Intramuscular Route: Forecasted Estimates (Till 2035)
- 17.2.3. Cancer Metabolism-Based Therapies Market in North America for Intravenous Route: Forecasted Estimates (Till 2035)
- 17.3. Cancer Metabolism-Based Therapies Market in North America: Distribution by Target Disease Indication
- 17.3.1. Cancer Metabolism-Based Therapies Market in North America for Breast Cancer: Historical Trends (Since 2021) and Forecasted Estimates (Till 2035)
- 17.3.2. Cancer Metabolism-Based Therapies Market in North America for Non-small Cell Lung Cancer: Historical Trends (Since 2021) and Forecasted Estimates (Till 2035)
- 17.3.3. Cancer Metabolism-Based Therapies Market in North America for Acute Myeloid Leukemia: Historical Trends (Since 2021) and Forecasted Estimates (Till 2035)
- 17.3.4. Cancer Metabolism-Based Therapies Market in North America for Brain Cancer: Historical Trends (Since 2025) and Forecasted Estimates (Till 2035)
- 17.3.5. Cancer Metabolism-Based Therapies Market in North America for Cholangiocarcinoma: Historical Trends (Since 2021) and Forecasted Estimates (Till 2035)
- 17.3.6. Cancer Metabolism-Based Therapies Market in North America for Bile Duct Cancer: Historical Trends (Since 2022) and Forecasted Estimates (Till 2035)
- 17.3.7. Cancer Metabolism-Based Therapies Market in North America for Myelodysplastic Syndromes: Historical Trends (Since 2021) and Forecasted Estimates (Till 2035)
- 17.3.8. Cancer Metabolism-Based Therapies Market in North America for Malignant-mesothelioma: Forecasted Estimates (Till 2035)
- 17.3.9. Cancer Metabolism-Based Therapies Market in North America for Pancreatic Cancer: Forecasted Estimates (Till 2035)
- 17.3.10. Cancer Metabolism-Based Therapies Market in North America for Soft Tissue Sarcoma: Forecasted Estimates (Till 2035)
- 17.3.11. Cancer Metabolism-Based Therapies Market in North America for Hepatocellular Carcinoma: Forecasted Estimates (Till 2035)
18. CANCER METABOLISM-BASED THERAPIES MARKET, EUROPE
- 18.1. Cancer Metabolism-Based Therapies Market in Europe: Distribution by Type of Modality
- 18.1.1. Cancer Metabolism-Based Therapies Market in Europe for Biologics: Historical Trends (Since 2021) and Forecasted Estimates (Till 2035)
- 18.1.2. Cancer Metabolism-Based Therapies Market in Europe for Small Molecules: Historical Trends (Since 2021) and Forecasted Estimates (Till 2035)
- 18.2. Cancer Metabolism-Based Therapies Market in Europe: Distribution by Route of Administration
- 18.2.1. Cancer Metabolism-Based Therapies Market in Europe for Oral Route: Historical Trends (Since 2021) and Forecasted Estimates (Till 2035)
- 18.2.2. Cancer Metabolism-Based Therapies Market in Europe for Intramuscular Route: Forecasted Estimates (Till 2035)
- 18.2.3. Cancer Metabolism-Based Therapies Market in Europe for Intravenous Route: Forecasted Estimates (Till 2035)
- 18.3. Cancer Metabolism-Based Therapies Market in Europe: Distribution by Target Disease Indication
- 18.3.1. Cancer Metabolism-Based Therapies Market in Europe for Breast Cancer: Historical Trends (Since 2021) and Forecasted Estimates (Till 2035)
- 18.3.2. Cancer Metabolism-Based Therapies Market in Europe for Non-small Cell Lung Cancer: Historical Trends (Since 2021) and Forecasted Estimates (Till 2035)
- 18.3.3. Cancer Metabolism-Based Therapies Market in Europe for Acute Myeloid Leukemia: Historical Trends (Since 2021) and Forecasted Estimates (Till 2035)
- 18.3.4. Cancer Metabolism-Based Therapies Market in Europe for Brain Cancer: Historical Trends (Since 2025) and Forecasted Estimates (Till 2035)
- 18.3.5. Cancer Metabolism-Based Therapies Market in Europe for Cholangiocarcinoma: Historical Trends (Since 2021) and Forecasted Estimates (Till 2035)
- 18.3.6. Cancer Metabolism-Based Therapies Market in Europe for Bile Duct Cancer: Historical Trends (Since 2022) and Forecasted Estimates (Till 2035)
- 18.3.7. Cancer Metabolism-Based Therapies Market in Europe for Myelodysplastic Syndromes: Historical Trends (Since 2021) and Forecasted Estimates (Till 2035)
- 18.3.8. Cancer Metabolism-Based Therapies Market in Europe for Malignant-mesothelioma: Forecasted Estimates (Till 2035)
- 18.3.9. Cancer Metabolism-Based Therapies Market in Europe for Pancreatic Cancer: Forecasted Estimates (Till 2035)
- 18.3.10. Cancer Metabolism-Based Therapies Market in Europe for Soft Tissue Sarcoma: Forecasted Estimates (Till 2035)
- 18.3.11. Cancer Metabolism-Based Therapies Market in Europe for Hepatocellular Carcinoma: Forecasted Estimates (Till 2035)
19. CANCER METABOLISM-BASED THERAPIES MARKET, ASIA-PACIFIC
- 19.1. Cancer Metabolism-Based Therapies Market in Asia-Pacific: Distribution by Type of Modality
- 19.1.1. Cancer Metabolism-Based Therapies Market in Asia-Pacific for Biologics: Historical Trends (Since 2021) and Forecasted Estimates (Till 2035)
- 19.1.2. Cancer Metabolism-Based Therapies Market in Asia-Pacific for Small Molecules: Historical Trends (Since 2021) and Forecasted Estimates (Till 2035)
- 19.2. Cancer Metabolism-Based Therapies Market in Asia-Pacific: Distribution by Route of Administration
- 19.2.1. Cancer Metabolism-Based Therapies Market in Asia-Pacific for Oral Route: Historical Trends (Since 2021) and Forecasted Estimates (Till 2035)
- 19.2.2. Cancer Metabolism-Based Therapies Market in Asia-Pacific for Intramuscular Route: Forecasted Estimates (Till 2035)
- 19.2.3. Cancer Metabolism-Based Therapies Market in Asia-Pacific for Intravenous Route: Forecasted Estimates (Till 2035)
- 19.3. Cancer Metabolism-Based Therapies Market in Asia-Pacific: Distribution by Target Disease Indication
- 19.3.1. Cancer Metabolism-Based Therapies Market in Asia-Pacific for Breast Cancer: Historical Trends (Since 2021) and Forecasted Estimates (Till 2035)
- 19.3.2. Cancer Metabolism-Based Therapies Market in Asia-Pacific for Non-small Cell Lung Cancer: Historical Trends (Since 2021) and Forecasted Estimates (Till 2035)
- 19.3.3. Cancer Metabolism-Based Therapies Market in Asia-Pacific for Acute Myeloid Leukemia: Historical Trends (Since 2021) and Forecasted Estimates (Till 2035)
- 19.3.4. Cancer Metabolism-Based Therapies Market in Asia-Pacific for Brain Cancer: Historical Trends (Since 2025) and Forecasted Estimates (Till 2035)
- 19.3.5. Cancer Metabolism-Based Therapies Market in Asia-Pacific for Cholangiocarcinoma: Historical Trends (Since 2021) and Forecasted Estimates (Till 2035)
- 19.3.6. Cancer Metabolism-Based Therapies Market in Asia-Pacific for Bile Duct Cancer: Historical Trends (Since 2022) and Forecasted Estimates (Till 2035)
- 19.3.7. Cancer Metabolism-Based Therapies Market in Asia-Pacific for Myelodysplastic Syndromes: Historical Trends (Since 2021) and Forecasted Estimates (Till 2035)
- 19.3.8. Cancer Metabolism-Based Therapies Market in Asia-Pacific for Malignant-mesothelioma: Forecasted Estimates (Till 2035)
- 19.3.9. Cancer Metabolism-Based Therapies Market in Asia-Pacific for Pancreatic Cancer: Forecasted Estimates (Till 2035)
- 19.3.10. Cancer Metabolism-Based Therapies Market in Asia-Pacific for Soft Tissue Sarcoma: Forecasted Estimates (Till 2035)
- 19.3.11. Cancer Metabolism-Based Therapies Market in Asia-Pacific for Hepatocellular Carcinoma: Forecasted Estimates (Till 2035)
Detailed segment-wise distribution across individual regions is available in supporting excel data packs
20. CANCER METABOLISM-BASED THERAPIES MARKET, SALES FORECAST OF DRUGS
- 20.1. Approved Cancer Metabolism-Based Therapies: Sales Forecast
- 20.1.1. Daraxonrasib: Sales Forecast
- 20.1.2. Gedatolisib: Sales Forecast
- 20.1.3. Olomorasib: Sales Forecast
- 20.1.4. Inavolisib: Sales Forecast
- 20.1.5. Vorasidenib: Sales Forecast
- 20.1.6. STX-478: Sales Forecast
- 20.1.7. AZD 5363: Sales Forecast
- 20.1.8. AG-120: Sales Forecast
- 20.1.9. Selpercatinib: Sales Forecast
- 20.1.10. ADI-PEG 20: Sales Forecast
- 20.1.11. Augtyro: Sales Forecast
- 20.1.12. Taletrectinib: Sales Forecast
- 20.1.13. Piqray / Vijoice: Sales Forecast
- 20.1.14. TAS-120: Sales Forecast
- 20.1.15. Rezlidhia: Sales Forecast
- 20.1.16. AG-221: Sales Forecast
21. CONCLUDING REMARKS
22. EXECUTIVE INSIGHTS
- 22.1. Chapter Overview
- 22.2. Company A
- 22.2.1. Company Snapshot
- 22.2.2. Interview Transcript: Associate Professor
- 22.3. Company B
- 22.3.1. Company Snapshot
- 22.3.2. Interview Transcript: Medical Oncologist
- 22.4. Company C
- 22.4.1. Company Snapshot
- 22.4.2. Interview Transcript: Associate Professor

