


|
시장보고서
상품코드
1462795
가스 미터 시장(스마트 및 표준형) : 제5판(2024년)Gas Meters Smart & Standard Ed 5 2024 |
||||||
가격
※ 부가세 별도
※ 본 상품은 영문 자료로 한글과 영문 목차에 불일치하는 내용이 있을 경우 영문을 우선합니다. 정확한 검토를 위해 영문 목차를 참고해주시기 바랍니다.
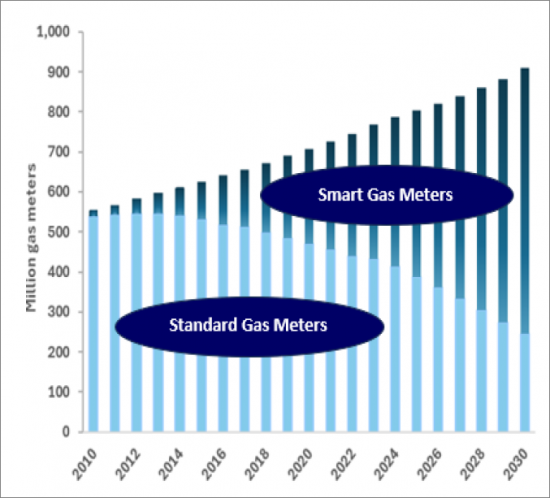
세계의 가스 미터 시장은 2023년에 8,080만 대, 금액으로 해 55억 달러에로 확대하며, 2028년에는 1억 1,600만 대에 달할 것으로 예측되고 있습니다.
샘플 뷰
가스 미터의 수요 촉진요인으 다음 3개 항목을 들 수 있습니다.
- 전기 스마트미터에 비해 뒤처졌던 가스 스마트미터가 보급되고 있습니다. 유럽, 아시아태평양, 중앙아시아에서 스마트 가스 계량기의 대규모 도입이 확인되고 있습니다.
- 초음파 계량기는 오랫동안 벌크 계량 및 관리 계량에 사용되어 왔지만 가격 때문에 주택 시장 진입에 어려움을 겪어왔습니다. 하지만 이제는 문제가 개선되어 현재 우세한 주거용 격막식 계량기에 도전할 준비가 되어 있습니다. 네덜란드, 미국, 캐나다, 일본, 영국에서 대규모 도입 계약이 체결되었고, 중국에서도 도입 가능성이 나타나고 있습니다. 국제적인 대형 제조업체들은 G1.6-16 초음파 측정기를 개발했고, 규제 당국은 전 세계에서 이를 인증하고 있습니다.
- 순 제로 목표, 녹색 운동가들의 반대, 풍력 및 태양광발전의 폭발적인 보급에도 불구하고 화석 연료는 여전히 세계 에너지의 주축입니다. 천연가스는 석탄과 석유보다 배출량이 적기 때문에 과도기적 연료로 유리한 위치에 있습니다. 도시가스 보급은 가장 큰 시장 중 일부에서 야심찬 성장 궤도에 올라서고 있습니다.
세계의 가스 미터(스마트 미터, 표준형 미터) 시장을 분석했으며, 전체적인 판매 대수·판매액 및 평균 판매 가격의 동향 전망(총 42개국, 2022-2028년) 및 미터 유형별 상세 동향(다이어프램, 로터리, 터빈, 오리피스, 초음파, 코리올리, 와류, MEMS), 주요 기업의 개요와 세계 시장 점유율(상위 23사), 각국 시장의 개요(제품·기업 개요, 수요 동향 등), 관련 시장(천연가스차(NGV), 오토 가스(자동차용 가스), 가스 공급 인프라 등)의 개요 등의 정보를 정리하여 전해드립니다.
목차
제1장 주요 요약
제2장 가스 미터 시장의 상황(2023년)
제3장 세계의 가스 미터 수요(2019-2025년)
제3장 스마트 가스 미터의 수요
- 계측 기술의 개요
- 미터 계측
- 다이어프램 미터
- 초음파 미터
- 스마트 미터
- 스마트 미터의 수요
제4장 가스 미터의 장기 수요 동향
제5장 가스 채굴·운송·유통
- 가스압
- 채굴 시스템
- 전송 시스템
- 압축 스테이션
- 라인 팩
- 게이트 스테이션
- 유통 네트워크
- 라스트마일 : 천연가스의 가정에 대한 운송
제6장 미터 유형 : 1843년부터 미래까지
- 용적식 가스 미터
- 다이어프램 미터
- 로터리 미터
- 추측식 미터
- 터빈 미터
- 오리피스 미터
- 초음파 유량계
- 가정용 초음파 미터
- 지능형 마이크로컴퓨터 미터
- 코리올리계
- 와류 합계
- MEMS(MEMS)
- 스마트/첨단 미터
- 통신 모듈
- 미터 사이즈(G)
- 발열량
- 수소 혼합
제7장 유럽의 가스 미터 시장
- 유럽의 가스 기업
- 러시아의 우크라이나 침공이 유럽의 천연가스 공급에 미치는 영향
- 스마트 미터
- 초음파 미터
- 미터 수요
- 오스트리아
- 벨기에
- 불가리아
- 체코
- 덴마크
- 에스토니아
- 핀란드
- 프랑스
- 독일
- 그리스
- 헝가리
- 아일랜드
- 이탈리아
- 라트비아
- 리투아니아
- 네덜란드
- 폴란드
- 포르투갈
- 루마니아
- 슬로바키아
- 슬로베니아
- 스페인
- 스웨덴
- 스위스
- 터키
- 영국
제8장 CIS 국가의 가스 미터 시장
- 미터 수요
- 러시아
- 우크라이나
- 아제르바이잔
- 카자흐스탄
- 우즈베키스탄
제9장 중동의 가스 미터 시장
- 이란
제10장 아프리카의 가스 미터 시장
- 북아프리카
- 알제리
- 이집트
- 사하라 이남 아프리카
제11장 아시아태평양의 가스 미터 시장
- 아시아태평양의 미터 수요
- 중국
- 호주
- 인도
- 인도네시아
- 일본
- 한국
- 뉴질랜드
- 파키스탄
- 대만
- 태국
제12장 북미의 가스 미터 시장
- 미국
- 캐나다
- 멕시코
제13장 남미의 가스 미터 시장
- 미터 수요
- 아르헨티나
- 브라질
- 칠레
- 콜롬비아
제14장 중앙아메리카의 가스 미터 시장
제15장 경쟁 분석, 기업 개요, 시장 점유율
- Elster
- Itron
- Landis+Gyr
- Dresser
- Diehl
- Apator
- Panasonic
- Nicor Gas
- Sagemcom
- Sensus
- Dongfa Group
- Holley
- Qianwei Kromschroder
- Emerson
- DNV GL
제16장 NGV(천연가스차)와 오토 가스 미터
- 충전 프로세스
제17장 세계의 가스 산업의 기원
- 전기 vs. 가스
- 에너지 전환에서 천연가스
제18장 가스 공급원·종류·공급량
- 가스 카테고리
- 천연가스
- 인조 가스
- 코크스로 가스
- 액화석유가스(LPG)
- 석탄 가스
- 바이오가스
- 용광로 가스
- 가스 하이드레이트
- 리파이너리(refinery) 가스
- 합성 천연가스(SNG)
- PG오토 가스
- 가스 운송과 저장
- 파이프 가스
- 액화천연가스(LNG)
- 액화석유가스(LPG)
- 압축천연가스(CNG)
- 분석 방법
- 가스 미터의 설치 대수
- 설치 기반
- 가스 미터의 수요
- 장기적인 수요 사이클
- 프랑스의 연간 장기 수요의 동향 : 스마트 가스 미터의 보급 상황에 수반하는 재계측 후
- 단기적인 수요
The Gas Meter market rose to 80.8 million meters in 2023 with a value of $5.5 billion and is predicted to reach 116 million meters by 2028.
SAMPLE VIEW

The new edition of Gas Meters Smart & Standard Ed5 2024 has identified three significant factors driving demand.
- Smart gas metering is taking off, after lagging behind electricity smart metering. Large deployments of smart gas meters are identified in Europe, Asia Pacific and Central Asia.
- Ultrasonic meters have long been used for bulk and custody metering but their entry into the residential market has been hampered by price. Costs have now come down and they are poised to challenge the traditional dominance of residential diaphragm meters. Large deployments have been contracted in the Netherlands, in the USA and Canada, in Japan and potentially in the UK, with China simmering. The leading international manufacturers have developed G1.6-16 ultrasonic meters and regulators are accrediting them around the globe.
- Despite net zero targets, opposition from green activists and an explosion of wind power and solar PV, fossil fuels are still the mainstay of global energy. Natural gas is well positioned as a transitional fuel because of lower emissions than coal and oil. City gas distribution is on ambitious growth paths in some of the largest markets.
Market statistics and analysis
- Sales of gas meters for 42 countries, by meter type - basic residential, AMR/AMI, prepayment, communal, communications modules, C&I - units, value, and average selling price, from 2022 to 2028.
- New deployments of smart gas meters, together with suppliers.
- The status of residential ultrasonic metering in relevant markets, deployments and manufacturers.
- The gas metering landscape in 2023 - numbers of population, households, gas consumers, and demand in meters and $ value.
- The major meter technologies described with total market shares; diaphragm, rotary, turbine, orifice and ultrasonic, Coriolis, vortex and MEMS.
- The major customers for gas meters, the gas transmission and distribution utilities in each of the 42 countries profiled, together with their structure.
- The growth of housing units, gas and electricity customers charted for each profiled country, from 1950 to 2030.
- Global market shares with profiles of the top 23 meter manufacturers - Profiles of Elster, Itron, Landis+Gyr, Sensus, Dresser, Diehl, Apator, Panasonic, Nicor Gas, Sagemcom, Sensus, Dongfa Group, Holley, Qianwei Kromschroeder, Emerson.
- The smart meter rollouts are causing fundamental changes in the demand cycle for meters.
- The NGV and autogas segment is reviewed, a small but growing segment for gas meters, with numbers and metering technology.
- Gas supply infrastructure outlined, which meters required for each function.
TABLE OF CONTENTS
1. EXECUTIVE SUMMARY
- 1. Natural das in the transition to net zero
- 2. Smart gasmeters
- 3. Ultrasonic residential gas meters
- Long-term annual demand trend with continuation of basic diaphragm meters, France, 1900-2050.
- Turndown ratio and rangeability
- Split between residential and C&I meter sales
- Competitive landscape
- Market shares of gas meter manufacturers in value 2023.
- Meter types
- Gas sources, types and delivery
- The origins of the global gas industry
- Electricity versus Gas
2. THE GAS METERING LANDSCAPE IN 2023
3. WORLD DEMAND FOR GAS METERS FROM 2019 TO 2025
3. DEMAND FOR SMART GAS METERS
- Introduction to metering technology
- Meter measurement
- Diaphragm meters
- Ultrasonic meters
- Smart metering
- Smart meter demand
4. LONG-TERM DEMAND TREND FOR GAS METERS
- Demand
5. GAS GATHERING, TRANSMISSION, DISTRIBUTION
- Gas pressure
- The gathering system
- The transmission system
- Compressor stations
- Line pack
- Gate stations
- The distribution network
- The last mile, moving natural gas into the home
6. METER TYPES FROM 1843 TO THE FUTURE
- POSITIVE DISPLACEMENT GAS METERS
- Diaphragm meters
- Rotary meters
- INFERENTIAL METERS
- Turbine meters
- Orifice meters
- Ultrasonic flow meters
- Residential ultrasonic meters
- Intelligent Micom meters
- Coriolis meters
- Vortex meters
- MEMS (Micro-Electro-Mechanical System)
- Smart/advanced meters
- Communication module
- Meter sizes - G
- Heating value
- Hydrogen blending
7. THE GAS METER MARKET IN EUROPE
- Establishment of gas in Europe
- The impact on the natural gas supply in Europe of the Russian war in Ukraine
- Smart meters
- Ultrasonic meters
- Meter demand
- AUSTRIA
- Smart meters
- Meter demand
- BELGIUM
- Smart meters
- Meter demand
- BULGARIA
- CZECH REPUBLIC
- DENMARK
- Smart meters
- Danish meter companies
- Ultrasonic meters
- Meter demand
- ESTONIA
- Smart meters
- Meter demand
- FINLAND
- Smart meters
- Meter demand
- FRANCE
- Smart meters
- Ultrasonic gas meters
- Meter demand
- GERMANY
- Smart meters
- Ultrasonic meters
- Meter demand
- GREECE
- Smart meters
- Meter demand
- HUNGARY
- Smart meters
- Meter demand
- IRELAND
- Smart meters
- Meter demand
- ITALY
- Smart meters
- Ultrasonic meters
- Meter demand
- LATVIA
- Smart meters
- Meter demand
- LITHUANIA
- Smart meters
- Meter demand
- NETHERLANDS
- Smart meters
- Ultrasonic gas meters
- Meter demand
- POLAND
- Smart meters
- Meter demand
- PORTUGAL
- Smart meters
- Meter demand
- ROMANIA
- Smart meters
- Meter demand
- SLOVAK REPUBLIC
- Smart meters
- SLOVENIA
- Smart meters
- SPAIN
- Smart meters
- Meter demand
- SWEDEN
- Smart meters
- Meter demand
- SWITZERLAND
- Smart meters
- Meter demand
- TURKEY
- Prepayment gas meters
- Smart meter progress
- Meter demand
- UNITED KINGDOM
- Certification
- Remanufacturing meters for the secondary or sub-metering market
- Smart meters
- Smart meter failures
- Pulse transmission of data for AMR
- Ultrasonic gas meters
8. THE GAS METER MARKET IN THE CIS
- Meter demand
- RUSSIA
- Smart meters
- Meter demand
- Meter manufacturers
- UKRAINE
- Meter production and manufacturers
- Smart meters
- Meter demand
- AZERBAIJAN
- Smart meters
- KAZAKHSTAN
- Smart meters
- UZBEKISTAN
- Smart meters
9. THE GAS METER MARKET IN THE MIDDLE EAST
- IRAN
- Meter demand
- Meter manufacturers
10. THE GAS METER MAKET IN AFRICA
- NORTH AFRICA
- Meter demand
- ALGERIA
- Meter demand
- Meter manufacturers
- EGYPT
- Meter demand
- Meter manufacturers
- SUB-SAHARAN AFRICA
11. THE GAS METER MARKET IN ASIA PACIFIC
- Meter demand Asia Pacific
- CHINA
- The development of distributed gas in China
- Manufactured gas
- LPG
- Natural gas
- City Gas players
- Smart meter progress
- Meter demand
- Meter manufacturers
- AUSTRALIA
- Smart meters
- Meter demand
- INDIA
- Historical development of City Gas Distribution
- Recent developments in the City Gas sector
- Smart meter progress
- Meter demand
- Gas meter companies
- INDONESIA
- Smart meters
- Meter demand
- JAPAN
- The intelligent Micom gas meter
- Ultrasonic intelligent gas meter
- Smart meters
- LPG meters
- Meter demand
- Meter manufacturers
- SOUTH KOREA
- Smart meters
- NEW ZEALAND
- Smart meter progress
- Meter demand
- PAKISTAN
- Meter demand
- Meter manufacturers
- TAIWAN
- Smart meters
- Meter demand
- Meter manufacturers
- THAILAND
12. THE GAS METER MARKET IN NORTH AMERICA
- UNITED STATES
- Gas industry structure
- Smart meters
- Ultrasonic meters
- Meter demand
- Meter manufacturers
- CANADA
- Smart meters
- Ultrasonic meters
- Meter demand
- MEXICO
- Meter demand
13. THE GAS METER MARKET IN SOUTH AMERICA
- Meter demand
- ARGENTINA
- Meter demand
- BRAZIL
- Meter demand
- CHILE
- Meter demand
- COLOMBIA
- Meter demand
14. THE GAS METER MARKET IN CENTRAL AMERICA
15. COMPETITIVE ANALYSIS, COMPANY PROFILES AND MARKET SHARES
- Elster
- Itron
- Landis+Gyr
- Dresser
- Diehl
- Apator
- Panasonic
- Nicor Gas
- Sagemcom
- Sensus
- Dongfa Group
- Holley
- Qianwei Kromschroder
- Emerson
- DNV GL
16. NGV and AUTOGAS METERING
- The filling process
17. THE ORIGINS OF THE GLOBAL GAS INDUSTRY
- Electricity versus Gas
- Natural gas in the energy transition
18. GAS SOURCES, TYPES AND DELIVERY
- GAS CATEGORIES
- Natural gas
- Manufactured gas
- Coke-oven gas
- 4. Liquefied petroleum gas (LPG)
- Coal gas
- Biogas
- Blast furnace gas
- Gas hydrates
- Refinery gas
- Syngas - SNG
- PG Autogas
- GAS DELIVERY AND STORAGE
- Piped gas
- Natural gas liquids, Liquefied Natural Gas (LNG)
- Liquefied petroleum gas (LPG)
- Compressed natural gas (CNG)
- METHODOLOGY
- Installed base of gas meters
- Installed base
- Demand for gas meters
- Long term demand cycle
- Long-term annual demand trend in France, reconfigured by the deployment of smart gas meters.
- Short term demand
Figures
- Figure 1: The global installed base of households with electricity and gas, 1900-2050
- Figure 2: Households with access to gas by region, 1900-2025.
- Figure 3: Long-term annual demand trend of basic diaphragm meters, France, 1900-2050.
- Figure 4: Long-term annual demand trend, reconfigured by the deployment of smart gas meters in a short rollout without periodic upgrading, France, 1900-2050.
- Figure 5: Gas gathering, transmission and distribution systems.
- Figure 6: The world's major gas transmission and distribution networks in km, 2018 and 2021.
- Figure 7: The European gas grid in 1965.
- Figure 8: The European gas grid in 2018.
- Figure 9: Natural gas pipeline flows into Europe from Russia since January 2022.
- Figure 10: Numbers of housing units, all gas and residential gas consumers, Europe,1900-2050.
- Figure 11: Numbers of metered users of gas, Europe, thousands, 2023
- Figure 12: Numbers of housing units, electricity and gas consumers, Austria, 1950-2030.
- Figure 13: Numbers of housing units, gas and electricity consumers, Belgium, 1950-2030.
- Figure 14: Numbers of housing units, gas and electricity consumers, Bulgaria, 1950-2050.
- Figure 15: Numbers of housing units, gas and electricity consumers, Czech Republic, 1950-2030.
- Figure 16: Numbers of housing units, gas and electricity consumers, Denmark, 1950-2020.
- Figure 17: Numbers of housing units, gas and electricity consumers, Estonia, 1900-2030.
- Figure 18: Numbers of housing units, gas and electricity consumers, Finland, 1900-2030.
- Figure 19: Household penetration of manufactured gas, natural gas and LPG in France, 1900-2030.
- Figure 20: Gazpar smart gas meter.
- Figure 21: Household penetration of manufactured gas, natural gas and LPG in Germany, 1900-2030.
- Figure 22: Numbers of housing units, gas and electricity consumers, Greece, 1950-2030.
- Figure 23: Numbers of housing units, gas and electricity consumers, Hungary, 1950-2030.
- Figure 24: Numbers of housing units, gas and electricity consumers, Ireland, 1950-2030.
- Figure 25: Household penetration of manufactured gas, natural gas and LPG in Italy, 1900-2030.
- Figure 26: Numbers of housing units, gas and electricity consumers, Latvia, 1950-2030.
- Figure 27: Numbers of housing units, gas and electricity consumers, Lithuania, 1950-2030.
- Figure 28: Numbers of housing units, gas and electricity consumers, Netherlands, 1950-2030.
- Figure 29: Numbers of housing units, gas and electricity consumers, Poland, 1950-2030.
- Figure 30: Annual demand trend for gas meters, IGC and residential, in units, $ value, with average selling price per meter, Poland, 2019-2025.
- Figure 31: Numbers of housing units, gas and electricity consumers, Portugal, 1950-2030.
- Figure 32: Numbers of housing units, gas and electricity consumers, Romania, 1950-2030.
- Figure 33: Numbers of housing units, gas and electricity consumers, Slovak Republic 1950-2030.
- Figure 34: Numbers of housing units, gas and electricity consumers, Slovenia, 1950-2030.
- Figure 35: Numbers of housing units, gas and electricity consumers, Spain, 1950-2030.
- Figure 36: Numbers of housing units, gas and electricity consumers, Sweden, 1950-2030.
- Figure 37: Numbers of housing units, gas and electricity consumers, Switzerland, 1950-2030.
- Figure 38: Numbers of housing units, gas and electricity consumers, Turkey, 1950-2030.
- Figure 39: Household penetration of manufactured gas, natural gas and LPG in the UK, 1900-2030.
- Figure 40: The impact of Covid 19 on the smart meter rollout in the UK for domestic smart meters.
- Figure 41: Numbers of housing units, all gas and residential consumers, CIS, 1950-2030.
- Figure 42: Household penetration of manufactured gas, natural gas and LPG in Russia, 1900-2030.
- Figure 43: Numbers of housing units, gas and electricity consumers, Russia, 1950-2030.
- Figure 44: Numbers of housing units, electricity and gas consumers, Azerbaijan, 1950-2030.
- Figure 45: Numbers of housing units, electricity and gas consumers, Kazakhstan, 1950-2030.
- Figure 46: Numbers of housing units, all gas and residential consumers, Middle East, 1950-2030.
- Figure 47: Numbers of housing units, electricity and gas consumers, North Africa, 1950-2030.
- Figure 48: Numbers of housing units, electricity and gas consumers, Algeria, 1950-2030.
- Figure 49: Numbers of housing units, electricity and gas consumers, Egypt, 1950-2030.
- Figure 50: Numbers of housing units, electricity and gas consumers, Sub-Saharan Africa, 1950-2030.
- Figure 51: Numbers of housing units, electricity and gas consumers, Asia-Pacific not inc. China, 1950-2030.
- Figure 52: Length of pipeline networks for Manufactured Gas, LPG and Natural Gas in China, 1978-2015.
- Figure 53: Numbers of households, PNGand manufactured gas and cylinder LPG, China, 2000-2030.
- Figure 54: Numbers of housing units, electricity and gas consumers, Australia, 1950-2030.
- Figure 55: City Gas Distribution rounds of bidding, 2008-2921.
- Figure 56: Numbers of housing units, electricity and gas consumers, India, 1950-2030.
- Figure 57: Numbers of housing units, electricity and gas consumers, Indonesia, 1950-2030.
- Figure 58: Household penetration of manufactured gas, natural gas and LPG in Japan, 1900-2030.
- Figure 59: Micom, conventional diaphragm intelligent gas meter.
- Figure 60 : Ultrasonic gas meter.
- Figure 61: Numbers of housing units, all gas and residential consumers, South Korea, 2000-2030.
- Figure 62: Numbers of housing units, electricity and gas consumers, New Zealand, 1950-2030.
- Figure 63: Numbers of housing units, electricity and gas consumers, Pakistan, 1950-2030.
- Figure 64: Numbers of housing units, electricity and gas consumers, Taiwan, 1950-2030.
- Figure 65: Household penetration of manufactured gas, natural gas and LPG in the USA, 1900-2030.
- Figure 66: Numbers of housing units, electricity and gas consumers, Canada, 1950-2030.
- Figure 67: Numbers of housing units, electricity and gas consumers, Mexico, 1950-2030.
- Figure 68: Numbers of housing units, electricity and gas consumers, Brazil, 1950-2030.
- Figure 69: Numbers of housing units, electricity and gas consumers, Chile, 1950-2030.
- Figure 70: Numbers of housing units, electricity and gas consumers, Columbia, 1950-2030.
- Figure 71: Numbers of housing units, all gas and residential consumers, Central America, 1900-2020.
- Figure 72: Market shares of gas meter manufacturers in value 2023.
- Figure 73: Timeline of global gas and electricity distribution.
Tables
- Table 1: Demographics, gas consumers and demand for gas meters in units and $ value, by region 2023.
- Table 2: Demographics, gas consumers and demand for gas meters in units and $ value, by country 2023.
- Table 3: Demand trend for gas meters, IGC and residential,in units, $ value, selected countries, 2022-2028.
- Table 4: Demand for gas meters in units, by region and country, 2018-2028..
- Table 5 Demand for gas meters in $ value, by region and country, 2018-28
- Table 6: Demand for smart gas meters in units by country, 2018 to 2028
- Table 7: Changes in the demand cycles for gas meter markets by country.
- Table 8: Typical turndown ratios of gas meter types.
- Table 9: G number for flow rates of gas metres
- Table 10: Basic population and gas statistics, Europe.
- Table 11: The status of smart gas metering in Europe, 2023.
- Table 12: Annual demand trend for gas meters, IGC and residential, in units, $ value, with average selling price per meter, Europe, 2022-28.
- Table 13: Basic population and gas statistics, Austria.
- Table 14: Annual demand trend for gas meters, IGC and residential, in units, $ value, with average selling price per meter, Austria, 2022-2028.
- Table 15: Basic population and gas statistics, Belgium.
- Table 16: Annual demand trend for gas meters, IGC and residential, in units, $ value, with average selling price per meter, Belgium, 2022-2028.
- Table 17 : Basic population and gas statistics, Bulgaria.
- Table 18: Basic population and gas statistics, Czech Republic.
- Table 19: Annual demand trend for gas meters, IGC and residential, in units, $ value, with average selling price per meter, Czech Republic, 2022-2028.
- Table 20: Basic population and gas statistics, Denmark.
- Table 21: Annual demand trend for gas meters, IGC and residential, in units, $ value, with average selling price per meter, Denmark, 2022-2028.
- Table 22: Basic population and gas statistics, Estonia.
- Table 23: Basic population and gas statistics, Finland.
- Table 24: Basic population and gas statistics, France.
- Table 25: Annual demand trend for gas meters, IGC and residential, in units, $ value, with average selling price per meter, France, 2022-2028.
- Table 26: Basic population and gas statistics, Germany.
- Table 27: Gas meters in use in Germany by type.
- Table 28: Annual demand trend for gas meters, IGC and residential, in units, $ value, with average selling price per meter, Germany, 2022-2028.
- Table 29: Basic population and gas statistics, Greece.
- Table 30: Annual demand trend for gas meters, IGC and residential, in units, $ value, with average selling price per meter, Greece, 2022-2028.
- Table 31: Basic population and gas statistics, Hungary.
- Table 32: Annual demand trend for gas meters, IGC and residential, in units, $ value, with average selling price per meter, Hungary, 2022-2028.
- Table 33: Basic population and gas statistics, Ireland.
- Table 34: Annual demand trend for gas meters, IGC and residential, in units, $ value, with average selling price per meter, Ireland, 2022-2028.
- Table 35: Basic population and gas statistics, Italy.
- Table 36: Annual demand trend for gas meters, IGC and residential, in units, $ value, with average selling price per meter, Italy, 2022-2028.
- Table 37: Basic population and gas statistics, Latvia
- Table 38: Annual demand trend for gas meters, IGC and residential, in units, $ value, with average selling price per meter, Latvia, 2022-2028.
- Table 39: Basic population and gas statistics, Lithuania.
- Table 40: Annual demand trend for gas meters, IGC and residential, in units, $ value, with average selling price per meter, Lithuania, 2022-2028.
- Table 41: Basic population and gas statistics, Netherlands.
- Table 42: Annual demand trend for gas meters, IGC and residential, in units, $ value, with average selling price per meter, Netherlands, 2022-28.
- Table 43: Basic population and gas statistics, Poland.
- Table 44: Basic population and gas statistics, Portugal.
- Table 45: Annual demand trend for gas meters, IGC and residential, in units, $ value, with average selling price per meter, Portugal, 2022-2028.
- Table 46: Basic population and gas statistics, Romania.
- Table 47: Annual demand trend for gas meters, IGC and residential, in units, $ value, with average selling price per meter, Romania, 2022-2028.
- Table 48: Basic population and gas statistics, Slovak Republic.
- Table 49 : Annual demand trend for gas meters, IGC and residential, in units, $ value, with average selling price per meter, Slovak Republic, 2022-2028.
- Table 50: Basic population and gas statistics, Slovenia.
- Table 51: Annual demand trend for gas meters, IGC and residential, in units, $ value, with average selling price per meter, Slovenia, 2022-2028.
- Table 52: Basic population and gas statistics, Spain.
- Table 53: Annual demand trend for gas meters, IGC and residential, in units, $ value, with average selling price per meter, Spain, 2022-2028.
- Table 54: Basic population and gas statistics, Sweden.
- Table 55: Basic population and gas statistics, Switzerland.
- Table 56: Annual demand trend for gas meters, IGC and residential, in units, $ value, with average selling price per meter, Switzerland, 2022-2028.
- Table 57: Basic population and gas statistic, Turkey.
- Table 58: Annual demand trend for gas meters, IGC and residential, in units, $ value, with average selling price per meter, Turkey, 2022-2028.
- Table 59: Basic population and gas statistics, United Kingdom.
- Table 60: Annual demand trend for gas meters, IGC and residential, in units, $ value, with average selling price per meter, United Kingdom, 2022-2028.
- Table 61: Basic population and gas statistics, CIS.
- Table 62: Annual demand trend for gas meters, IGC and residential, in units, $ value, with average selling price per meter, CIS, 2022-2028.
- Table 63: Basic population and gas statistics, Russia.
- Table 64: Annual demand trend for gas meters, IGC and residential, in units, $ value, with average selling price per meter, Russia, 2022-2028.
- Table 65: Basic population and gas statistics, Ukraine.
- Table 66: Annual demand trend for gas meters, IGC and residential, in units, $ value, with average selling price per meter, Ukraine, 2022-2028.
- Table 67: Basic population and gas statistics, Azerbaijan.
- Table 68: Annual demand trend for gas meters, IGC and residential, in units, $ value, with average selling price per meter, Azerbaijan, 2022-2028.
- Table 69: Basic population and gas statistics, Kazakhstan.
- Table 70: Annual demand trend for gas meters, IGC and residential, in units, $ value, with average selling price per meter, Kazakhstan, 2022-2028.
- Table 71: Basic population and gas statistics, Uzbekistan.
- Table 72: Numbers of housing units, electricity and gas consumers, Uzbekistan, 1950-2030.
- Table 73: Annual demand trend for gas meters, IGC and residential, in units, $ value, with average selling price per meter, Uzbekistan, 2022-2028.
- Table 74: Basic population and gas statistics, Middle East.
- Table 75: Annual demand trend for gas meters, IGC and residential, in units, $ value, with average selling price per meter, Middle East, 2022-2028
- Table 76: Basic population and gas statistics, Iran.
- Table 77: Annual demand trend for gas meters, IGC and residential, in units, $ value, with average selling price per meter, Iran, 2022-2028.
- Table 78: Basic population and gas statistics, North Africa
- Table 79: Annual demand trend for gas meters, IGC and residential, in units, $ value, with average selling price per meter, North Africa, 2022-2028.
- Table 80: Basic population and gas statistics, Algeria.
- Table 81: Annual demand trend for gas meters, IGC and residential, in units, $ value, with average selling price per meter, Algeria, 2022-2028.
- Table 82: Basic population and gas statistics, Egypt.
- Table 83: Annual demand trend for gas meters, IGC and residential, in units, $ value, with average selling price per meter, Egypt, 2022-2028.
- Table 84: Basic population and gas statistics, sub-Saharan Africa.
- Table 85: Basic population and gas statistics, Asia Pacific not including China.
- Table 86: Annual demand trend for gas meters, IGC and residential, in units, $ value, with average selling price per meter, Asia Pacific not including China, 2022-2028.
- Table 87: Basic population and gas statistics, China.
- Table 88: Five leading city gas distributors in China
- Table 89: Annual demand trend for gas meters, IGC and residential, in units, $ value, with average selling price per meter, China, 2022-2028.
- Table 90: Leading gas meter manufacturers in China
- Table 91: Basic population and gas statistics, Australia.
- Table 92: Annual demand trend for gas meters, IGC and residential, in units, $ value, with average selling price per meter, Australia, 2022-2028.
- Table 93: Basic population and gas statistics, India.
- Table 94: Annual demand trend for gas meters, IGC and residential, in units, $ value, with average selling price per meter, India, 2022-2028.
- Table 95: Basic population and gas statistics, Indonesia.
- Table 96: Annual demand trend for gas meters, IGC and residential, in units, $ value, with average selling price per meter, Indonesia, 2022-2028.
- Table 97: Basic population and gas statistics, Japan.
- Table 98: Annual demand trend for gas meters, IGC and residential, in units, $ value, with average selling price per meter, Japan, 2022-2028.
- Table 99: Basic population and gas statistics, South Korea.
- Table 100: Annual demand trend for gas meters, IGC and residential, in units, $ value, with average selling price per meter, Korea, 2022-2028.
- Table 101: Basic population and gas statistics, New Zealand.
- Table 102: Annual demand trend for gas meters, IGC and residential, in units, $ value, with average selling price per meter, New Zealand, 2022-2028.
- Table 103: Basic population and gas statistics, Pakistan.
- Table 104: Annual demand trend for gas meters, IGC and residential, in units, $ value, with average selling price per meter, Pakistan, 2022-2028.
- Table 105: Basic population and gas statistics, Taiwan.
- Table 106: Annual demand trend for gas meters, IGC and residential, in units, $ value, with average selling price per meter, Taiwan, 2022-2028.
- Table 107: Basic population and gas statistics, Thailand.
- Table 108: Basic population and gas statistics, United States.
- Table 109: Annual demand trend for gas meters, IGC and residential, in units, $ value, with average selling price per meter, United States, 2022-2028.
- Table 110: Basic population and gas statistics, Canada.
- Table 111: Annual demand trend for gas meters, IGC and residential, in units, $ value, with average selling price per meter, Canada, 2022-2028.
- Table 112: Basic population and gas statistics, Mexico.
- Table 113: Annual demand trend for gas meters, IGC and residential, in units, $ value, with average selling price per meter, Mexico, 2022-2028.
- Table 114: Basic population and gas statistics, South America.
- Table 115: Annual demand trend for gas meters, IGC and residential, in units, $ value, with average selling price per meter, selected countries in South America 2022-2028.
- Table 116: Basic population and gas statistics, Argentina.
- Table 117: Numbers of housing units, electricity and gas consumers, Argentina, 1950-2030.
- Table 118: Annual demand trend for gas meters, IGC and residential, in units, $ value, with average selling price per meter, Argentina, 2022-2028.
- Table 119: Basic population and gas statistics, Brazil.
- Table 120: Annual demand trend for gas meters, IGC and residential, in units, $ value, with average selling price per meter, Brazil, 2022-2028.
- Table 121: Basic population and gas statistics, Chile.
- Table 122: Annual demand trend for gas meters, IGC and residential, in units, $ value, with average selling price per meter, Chile, 2022-2028.
- Table 123: Basic population and gas statistics, Colombia.
- Table 124: Annual demand trend for gas meters, IGC and residential, in units, $ value, with average selling price per meter, Columbia, 2022-2028.
- Table 125: Basic population and gas statistics, Central America (excluding Mexico) , 2013

샘플 요청 목록