|
시장보고서
상품코드
1721592
바이오포토닉스 시장 기회, 성장 촉진요인, 산업 동향 분석 및 예측(2025-2034년)Biophotonics Market Opportunity, Growth Drivers, Industry Trend Analysis, and Forecast 2025 - 2034 |
||||||
세계의 바이오포토닉스 시장은 2024년 761억 달러로 평가되었고 CAGR 11.3%를 나타내 2034년에는 2,201억 달러에 이를 것으로 추정되고 있습니다. 생체시스템의 분석방법에 혁명을 가져와 바이오포토닉 디바이스를 보다 효율적이고 정밀하게 하고 있습니다.

비침습적인 치료와 실시간 진단이 중시되고, 바이오포토닉 혁신에 대한 수요는 헬스케어 환경 전반에 걸쳐 급증하고 있습니다. 업계에서는 연구개발, 자동화, 데이터 주도의 의사결정에 대한 투자가 확대되고 있으며, 연구, 진단, 치료에 걸친 바이오포토닉 용도 합리화에 도움이 되고 있습니다. 또한, 세계의 만성 질환 증가에 의해 효율적이고 정확하고 신속한 진단 방법의 탐구가 깊어지고 있어 이것도 시장의 지속적인 확대에 기여하고 있습니다.
| 시장 규모 | |
|---|---|
| 시작 연도 | 2024년 |
| 예측 연도 | 2025-2034년 |
| 시작 금액 | 761억 달러 |
| 예측 금액 | 2,201억 달러 |
| CAGR | 11.3% |
이 기술은 In-Vitro 플랫폼과 In-Vivo 플랫폼으로 이분됩니다. 이 중 In-Vitro 분야는 현저한 성장을 기록하고 있으며, 2034년까지 896억 달러에 이를 것으로 예측되고 있습니다. 이를 통한 분석과 자동화의 통합은 이러한 진보로 인위적 실수를 최소화하고 업무 효율성을 높이고 실험실 워크플로우를 더욱 정확하고 신속하게 하고 있습니다.
용도별로는 시스루 이미징, 현미경, 인사이드 이미징, 분광분자, 분석센싱, 광치료, 표면이미징, 바이오센서 등 다양한 부문에 걸쳐 있습니다.억 달러.이 분야의 리더십은 분자 수준에서의 민감도와 진단 정확도를 향상시킨 분광 도구의 진화로 인한 것입니다.
최종 용도의 관점에서 시장은 검사와 구성 요소, 의료진단, 의료치료, 비의료 용도로 구분됩니다.
지역별로는 미국이 북미의 바이오포토닉스 시장을 선도하고 있으며, 2034년에는 74억 달러 규모에 이를 것으로 예측되고 있습니다.
이 업계는 서모피셔 사이언티픽사, 칼자이스사, 하마마츠 포토닉스 주식회사, 올림푸스 주식회사, 옥스포드 기기사 등 주요 기업이 시장의 55%에서 60%를 차지하고 있어 완만한 통합이 계속되고 있습니다.
목차
제1장 조사 방법과 범위
제2장 주요 요약
제3장 업계 인사이트
- 생태계 분석
- 업계에 미치는 영향요인
- 성장 촉진요인
- 나노기술의 출현
- 고령화와 생활습관병 증가
- 세포·조직 진단에 있어서 바이오포토닉스의 사용 증가
- 가정용 POC 디바이스 수요 증가
- AI와 ML의 통합 증가
- 업계의 잠재적 위험 및 과제
- 높은 기술비용
- 느린 속도의 상업화
- 성장 촉진요인
- 성장 가능성 분석
- 규제 상황
- 기술의 상황
- 향후 시장 동향
- 갭 분석
- Porter's Five Forces 분석
- PESTEL 분석
제4장 경쟁 구도
- 서론
- 기업의 시장 점유율 분석
- 주요 시장 기업의 경쟁 분석
- 경쟁 포지셔닝 매트릭스
- 전략 대시보드
제5장 시장 추계·예측 : 기술별(2021-2034년)
- 주요 동향
- 체외
- In-Vivo
제6장 시장 추계·예측 : 용도별(2021-2034년)
- 주요 동향
- 시스루 이미징
- 현미경 검사
- 내부 이미징
- 스펙트로 분자
- 분석 감지
- 광선 치료
- 표면 이미징
- 바이오 센서
제7장 시장 추계·예측 : 최종 용도별(2021-2034년)
- 주요 동향
- 테스트 및 부품
- 의료 치료
- 의료 진단
- 비의료 용도
제8장 시장 추계·예측 : 지역별(2021-2034년)
- 주요 동향
- 북미
- 미국
- 캐나다
- 유럽
- 독일
- 영국
- 프랑스
- 스페인
- 이탈리아
- 네덜란드
- 아시아태평양
- 중국
- 인도
- 호주
- 한국
- 일본
- 라틴아메리카
- 브라질
- 멕시코
- 아르헨티나
- 중동 및 아프리카
- 사우디아라비아
- 아랍에미리트(UAE)
- 남아프리카
제9장 기업 프로파일
- Becton, Dickinson and Company
- Carl Zeiss AG
- Glenbrook Technologies
- Hamamatsu Photonics KK
- IDEX
- IPG Photonics Corporation
- NU Skin Enterprises
- Olympus Corporation
- Oxford Instruments PLC
- PerkinElmer Inc.
- Thermo Fisher Scientific
- TOSHIBA CORPORATION
- Zecotek Photonics Inc.
- Zenalux Biomedical Inc
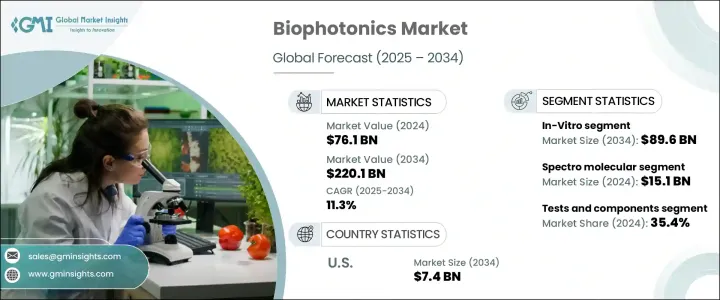
The Global Biophotonics Market was valued at USD 76.1 billion in 2024 and is estimated to grow at a CAGR of 11.3% to reach USD 220.1 billion by 2034. This remarkable growth trajectory is largely driven by rapid advancements in medical technology and the accelerating integration of nanotechnology across diagnostic and therapeutic platforms. The ability of nanotechnology to enhance light-matter interactions at the nanoscale has revolutionized the way biological systems are analyzed, making biophotonic devices more efficient and precise. These technologies now offer increased sensitivity and specificity when detecting biomarkers and imaging tissues, paving the way for more accurate diagnostics and tailored treatments, especially in early-stage disease detection.
With a growing emphasis on non-invasive procedures and real-time diagnostics, the demand for biophotonic innovations is surging across healthcare settings. The increasing global focus on personalized medicine, which relies heavily on precise molecular data, further reinforces the need for advanced optical technologies. Alongside technological evolution, the healthcare industry is witnessing greater investment in R&D, automation, and data-driven decision-making, which is helping streamline biophotonic applications across research, diagnostics, and treatment. Additionally, the rise in chronic conditions worldwide is prompting deeper exploration into efficient, accurate, and faster diagnostic methods-another factor contributing to the market's sustained expansion.
| Market Scope | |
|---|---|
| Start Year | 2024 |
| Forecast Year | 2025-2034 |
| Start Value | $76.1 Billion |
| Forecast Value | $220.1 Billion |
| CAGR | 11.3% |
Based on technology, the market is bifurcated into In-Vitro and In-Vivo platforms. Among these, the In-Vitro segment is registering notable growth and is expected to reach USD 89.6 billion by 2034. This surge is primarily fueled by breakthroughs in lab-based diagnostics, as well as the integration of AI-driven analytics and automation. These advancements are minimizing human error, increasing operational efficiency, and making laboratory workflows more accurate and responsive. As the healthcare sector continues to prioritize early disease detection, the adoption of In-Vitro biophotonic platforms is expanding rapidly.
In terms of application, the market spans various segments, including see-through imaging, microscopy, inside imaging, spectro molecular, analytics sensing, light therapy, surface imaging, and biosensors. The spectro molecular segment held the dominant market share, valued at USD 15.1 billion in 2024. Its leadership in the segment is due to the evolution of spectroscopic tools that now offer enhanced sensitivity and diagnostic precision at the molecular level. These tools play a vital role in identifying biochemical changes linked to disease, thereby enabling early and more personalized intervention strategies.
From an end-use perspective, the market is segmented into tests and components, medical diagnostics, medical therapeutics, and non-medical applications. The tests and components segment accounted for the largest share at 35.4% in 2024, supported by rising demand for advanced diagnostic tools and precision imaging technologies.
Regionally, the United States leads the North American biophotonics market and is expected to achieve a valuation of USD 7.4 billion by 2034, thanks to heavy R&D spending, sophisticated healthcare infrastructure, and increasing demand for advanced diagnostic solutions in response to the growing burden of chronic illnesses.
The industry remains moderately consolidated, with top players like Thermo Fisher Scientific Inc., Carl Zeiss AG, Hamamatsu Photonics K.K., Olympus Corporation, and Oxford Instruments collectively controlling around 55%-60% of the market. These companies continue to invest in high-precision biophotonic technologies and expand their geographic footprint to reinforce their competitive edge.
Table of Contents
Chapter 1 Methodology and Scope
- 1.1 Market scope and definitions
- 1.2 Research design
- 1.2.1 Research approach
- 1.2.2 Data collection methods
- 1.3 Base estimates and calculations
- 1.3.1 Base year calculation
- 1.3.2 Key trends for market estimation
- 1.4 Forecast model
- 1.5 Primary research and validation
- 1.5.1 Primary sources
- 1.5.2 Data mining sources
Chapter 2 Executive Summary
- 2.1 Industry 3600 synopsis
Chapter 3 Industry Insights
- 3.1 Industry ecosystem analysis
- 3.2 Industry impact forces
- 3.2.1 Growth drivers
- 3.2.1.1 Emergence of nanotechnology
- 3.2.1.2 Aging population and growing lifestyle diseases
- 3.2.1.3 Increasing use of biophotonics in cell and tissue diagnostics
- 3.2.1.4 Increasing demand for home-based POC devices
- 3.2.1.5 Rising integration with AI & ML
- 3.2.2 Industry pitfalls and challenges
- 3.2.2.1 High cost of technology
- 3.2.2.2 Slow rate of commercialization
- 3.2.1 Growth drivers
- 3.3 Growth potential analysis
- 3.4 Regulatory landscape
- 3.5 Technology landscape
- 3.6 Future market trends
- 3.7 Gap analysis
- 3.8 Porter’s analysis
- 3.9 PESTEL analysis
Chapter 4 Competitive Landscape, 2024
- 4.1 Introduction
- 4.2 Company market share analysis
- 4.3 Competitive analysis of major market players
- 4.4 Competitive positioning matrix
- 4.5 Strategy dashboard
Chapter 5 Market Estimates and Forecast, By Technology, 2021 – 2034 ($ Mn)
- 5.1 Key trends
- 5.2 In-Vitro
- 5.3 In-Vivo
Chapter 6 Market Estimates and Forecast, By Application, 2021 – 2034 ($ Mn)
- 6.1 Key trends
- 6.2 See-Through imaging
- 6.3 Microscopy
- 6.4 Inside imaging
- 6.5 Spectro molecular
- 6.6 Analytics sensing
- 6.7 Light therapy
- 6.8 Surface imaging
- 6.9 Biosensors
Chapter 7 Market Estimates and Forecast, By End Use, 2021 – 2034 ($ Mn)
- 7.1 Key trends
- 7.2 Tests and components
- 7.3 Medical therapeutics
- 7.4 Medical diagnostics
- 7.5 Non-medical application
Chapter 8 Market Estimates and Forecast, By Region, 2021 – 2034 ($ Mn)
- 8.1 Key trends
- 8.2 North America
- 8.2.1 U.S.
- 8.2.2 Canada
- 8.3 Europe
- 8.3.1 Germany
- 8.3.2 UK
- 8.3.3 France
- 8.3.4 Spain
- 8.3.5 Italy
- 8.3.6 Netherlands
- 8.4 Asia Pacific
- 8.4.1 China
- 8.4.2 India
- 8.4.3 Australia
- 8.4.4 South Korea
- 8.4.5 Japan
- 8.5 Latin America
- 8.5.1 Brazil
- 8.5.2 Mexico
- 8.5.3 Argentina
- 8.6 Middle East and Africa
- 8.6.1 Saudi Arabia
- 8.6.2 U.A.E.
- 8.6.3 South Africa
Chapter 9 Company Profiles
- 9.1 Becton, Dickinson and Company
- 9.2 Carl Zeiss AG
- 9.3 Glenbrook Technologies
- 9.4 Hamamatsu Photonics K.K
- 9.5 IDEX
- 9.6 IPG Photonics Corporation
- 9.7 NU Skin Enterprises
- 9.8 Olympus Corporation
- 9.9 Oxford Instruments PLC
- 9.10 PerkinElmer Inc.
- 9.11 Thermo Fisher Scientific
- 9.12 TOSHIBA CORPORATION
- 9.13 Zecotek Photonics Inc.
- 9.14 Zenalux Biomedical Inc