
|
시장보고서
상품코드
1740915
유제품 블렌드 시장 : 기회, 성장 촉진요인, 업계 동향 분석 및 예측(2025-2034년)Dairy Blends Market Opportunity, Growth Drivers, Industry Trend Analysis, and Forecast 2025 - 2034 |
||||||
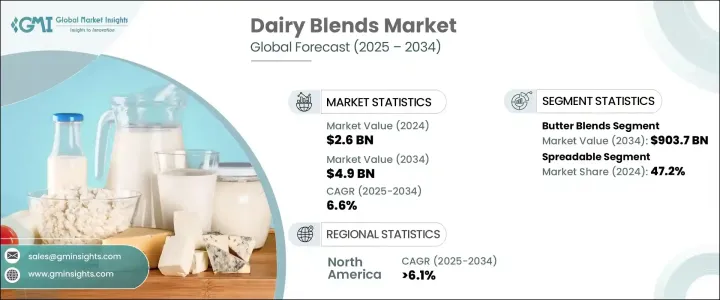
세계의 유제품 블렌드 시장 규모는 2024년에는 26억 달러로 평가되었고 현대의 소비 패턴에 대응한 다기능 식품 소재에 대한 수요 증가에 힘입어 2034년에는 49억 달러에 달할 것으로 예측되며, CAGR 6.6%로 성장할 전망입니다.
오늘날 소비자들은 맛, 영양, 편의성 사이에서 균형을 이루는 식품 옵션을 점점 더 많이 찾고 있으며, 유제품 블렌드는 모든 면에서 이점을 제공합니다. 이러한 변화는 건강에 대한 인식이 높아지고, 바로 사용할 수 있는 제품을 선호하는 바쁜 라이프스타일과 지속 가능하면서도 만족스러운 식생활 경험에 대한 열망에 의해 주도되고 있습니다. 유제품 블렌드는 전통적인 유제품의 풍부한 감각적 매력과 기능성 및 건강상의 이점을 결합한 완벽한 중간 지점에 위치합니다. 이러한 제품은 향상된 식감, 더 긴 유통기한, 열 안정성, 향상된 퍼짐성을 제공합니다. 이러한 특성 덕분에 유제품 블렌드는 냉동 및 제빵 제품부터 소스, 스낵에 이르기까지 다양한 식품에 이상적입니다. 전 세계적으로 식품 선호도가 진화함에 따라 소비자들은 맞춤형 영양 프로필을 제공하면서 일상 식사에 쉽게 포함할 수 있는 블렌드를 찾고 있습니다.

유제품 블렌드는 기술의 주요 발전 덕분에 빠르게 진화하고 있습니다. 균질화, 마이크로 캡슐화, 정밀 블렌딩의 획기적인 발전으로 제조업체는 특정 건강 목표나 식단 요건에 맞는 블렌드를 만들 수 있게 되었습니다. 지방 함량을 낮추거나 비타민을 강화하거나 어린이, 운동선수, 노인을 위한 맞춤형 블렌딩 등 이제 업계는 정밀한 영양을 제공할 수 있는 도구를 갖추게 되었습니다. 웰빙에 대한 관심이 그 어느 때보다 높아지면서 이러한 맞춤형 솔루션은 소비자가 맛이나 식감을 포기하지 않고도 개인의 건강 목표를 달성할 수 있도록 돕고 있습니다. 글로벌 공급망 다각화는 또 다른 원동력입니다. 이제 기업들은 원자재 가격 변동, 무역 역학, 기후 관련 문제에 빠르게 적응할 수 있도록 소싱과 생산에 더욱 민첩하게 대응하고 있습니다.
| 시장 범위 | |
|---|---|
| 시작 연도 | 2024년 |
| 예측 연도 | 2025-2034년 |
| 시작 금액 | 26억 달러 |
| 예측 금액 | 49억 달러 |
| CAGR | 6.6% |
시장은 유형별로 정제 크림, 버터, 치즈, 요거트 및 기타 특수 블렌드로 세분화됩니다. 이 중 버터 블렌드는 강력한 영향력을 발휘하고 있으며 2034년까지 9억 370만 달러에 달해 6.5%의 CAGR로 성장할 것으로 예상됩니다. 이러한 블렌드는 특히 제빵 및 포장 식품에서 일관된 질감, 풍미, 제품 제형 안정화 능력으로 식품 가공 부문에서 높은 가치를 인정받고 있습니다.
유제품 블렌드는 형태에 따라 분말, 액상, 스프레더블 제품으로 분류됩니다. 스프레더블 블렌드는 47.2%의 시장 점유율로 우위를 점하고 있으며 2034년까지 6.9%의 연평균 성장률로 성장하여 12억 달러에 달할 것으로 예상됩니다. 사용 편의성, 빠르게 변화하는 라이프스타일과의 호환성, 직접 스프레드부터 소스 및 밀 키트에 이르기까지 다양한 용도로 활용할 수 있어 소비자들이 선호하는 제품입니다.
북미의 유제품 혼합 시장은 2025년부터 2034년까지 6.1%의 연평균 성장률을 보일 것으로 예상되며, 이는 건강을 중시하는 식물성 식단으로 전환하는 북미 지역의 추세에 힘입은 결과입니다. 콩, 귀리, 아몬드 성분이 함유된 블렌드는 기존 유제품 대신 클린 라벨의 기능성 대안을 찾는 사람들 사이에서 주목을 받고 있습니다. 풍미를 높이고 영양이 풍부하며 유통기한이 긴 식품에 대한 수요가 증가하면서 시장 성장이 더욱 촉진되고 있습니다.
Cargill, Agropur, Friesland Campina, Kerry Group, Fonterra, Dohler, AFP 등 주요 기업들은 더 깨끗한 라벨과 더 높은 영양가를 제공하기 위한 R&D 투자로 한계를 뛰어넘고 있습니다. 이러한 기업들은 전략적 협업과 지속가능성에 초점을 맞춘 노력을 통해 책임 있는 소싱과 환경 영향 감소에 대한 소비자의 기대에 부응하면서 글로벌 입지를 확장하고 있습니다.
목차
제1장 조사 방법과 범위
제2장 주요 요약
제3장 업계 인사이트
- 생태계 분석
- 밸류체인에 영향을 주는 요인
- 이익률 분석
- 혁신
- 장래의 전망
- 제조업자
- 리셀러
- 트럼프 정권에 의한 관세에 대한 영향
- 무역에 미치는 영향
- 무역량의 혼란
- 보복 조치
- 업계에 미치는 영향
- 공급측의 영향(원자재)
- 주요 원자재의 가격 변동
- 공급망 재구성
- 생산 비용에 미치는 영향
- 수요측의 영향(판매가격)
- 최종 시장에의 가격 전달
- 시장 점유율 동향
- 소비자의 반응 패턴
- 공급측의 영향(원자재)
- 영향을 받는 주요 기업
- 전략적인 업계 대응
- 공급망 재구성
- 가격 설정 및 제품 전략
- 정책관여
- 전망과 향후 검토 사항
- 전략적인 업계 대응
- 공급망 재구성
- 가격 설정 및 제품 전략
- 정책관여
- 전망과 향후 검토 사항
- 무역에 미치는 영향
- 무역 통계(HS코드)
- 주요 수출국
- 주요 수입국
참고 : 위의 무역 통계는 주요 국가에만 제공됩니다.
- 공급자의 상황
- 이익률 분석
- 주요 뉴스와 대처
- 규제 상황
- 영향요인
- 성장 촉진요인
- 소비자는 지방과 콜레스테롤 함량이 낮은 유제품 블렌드를 선호
- 기능성 식품 수요 증가
- 유제품 블렌드는 적절한 대안을 제안
- 업계의 잠재적 위험 및 과제
- 엄격한 라벨링 및 성분 법규
- 일부 구매자는 혼합 유제품을 순수 유제품보다 품질이 낮다고 생각
- 성장 촉진요인
- 성장 가능성 분석
- Porter's Five Forces 분석
- PESTEL 분석
제4장 경쟁 구도
- 소개
- 기업의 시장 점유율 분석
- 경쟁 포지셔닝 매트릭스
- 전략적 전망 매트릭스
제5장 시장 추계 및 예측 : 유형별(2021-2034년)
- 주요 동향
- 크림 블렌드
- 버터 블렌드
- 요구르트 블렌드
- 치즈 블렌드
- 기타 블렌드
제6장 시장 추계 및 예측 : 형태별(2021-2034년)
- 주요 동향
- 스프레더블
- 액상
- 분말
제7장 시장 추계 및 예측 : 용도별(2021-2034년)
- 주요 동향
- 베이커리 및 제과
- 유제품 및 냉동 디저트
- 음료
- 영양 및 기능성 식품
- 기타
제8장 시장 추계 및 예측 : 지역별(2021-2034년)
- 주요 동향
- 북미
- 미국
- 캐나다
- 유럽
- 영국
- 독일
- 프랑스
- 이탈리아
- 스페인
- 러시아
- 아시아태평양
- 중국
- 인도
- 일본
- 한국
- 호주
- 라틴아메리카
- 브라질
- 멕시코
- 중동 및 아프리카
- 남아프리카
- 사우디아라비아
- 아랍에미리트(UAE)
제9장 기업 프로파일
- Kerry Group plc
- FrieslandCampina
- Cargill, Incorporated
- Fonterra Co-operative Group Limited
- Dohler GmbH
- Agropur
- AFP advanced food products llc
- Cape Food Ingredients
- Intermix Australia Pty Ltd.
- Spectrum Organics Products, LLC
The Global Dairy Blends Market was valued at USD 2.6 billion in 2024 and is estimated to grow at a CAGR of 6.6% to reach USD 4.9 billion by 2034, fueled by the rising demand for multi-functional food ingredients that meet modern consumption patterns. Consumers today are increasingly looking for food options that offer a balance between taste, nutrition, and convenience, and dairy blends deliver on all fronts. This shift is being driven by a growing awareness of health, a busy lifestyle that favors ready-to-use products, and a desire for sustainable yet indulgent eating experiences. Dairy blends strike that perfect middle ground-they combine the rich sensory appeal of traditional dairy with added functionality and health benefits. These products provide improved mouthfeel, longer shelf life, thermal stability, and enhanced spreadability. These attributes make dairy blends ideal for a wide range of food applications, from frozen and baked goods to sauces and snacks. As global food preferences evolve, consumers are turning to blends that are easy to incorporate into their daily meals while offering tailored nutritional profiles.
Dairy blends are evolving quickly, thanks to major advancements in technology. Breakthroughs in homogenization, microencapsulation, and precision blending are allowing manufacturers to create blends that target specific health goals or dietary requirements. Whether it's lowering fat content, enriching with vitamins, or customizing blends for children, athletes, or the elderly, the industry now has the tools to deliver precision nutrition. The focus on wellness is stronger than ever, and these tailored solutions are helping consumers meet personal health targets without giving up flavor or texture. Global supply chain diversification is another driving factor. Companies are now more agile in their sourcing and production, helping them adapt quickly to fluctuations in raw material prices, trade dynamics, and climate-related challenges.
| Market Scope | |
|---|---|
| Start Year | 2024 |
| Forecast Year | 2025-2034 |
| Start Value | $2.6 Billion |
| Forecast Value | $4.9 Billion |
| CAGR | 6.6% |
The market is segmented by type into refined creams, butter, cheese, yogurt, and other specialty blends. Among these, butter blends are making a strong impact and are expected to reach USD 903.7 million by 2034, growing at a CAGR of 6.5%. These blends are highly valued in the food processing sector for their consistent texture, flavor, and ability to stabilize product formulations, particularly in baked and packaged foods.
In terms of form, dairy blends are categorized as powders, liquids, and spreadable products. Spreadable blends dominate with a 47.2% market share and are projected to hit USD 1.2 billion by 2034, growing at a CAGR of 6.9%. Their ease of use, compatibility with fast-paced lifestyles, and versatility in everything from direct spreads to sauces and meal kits make them a consumer favorite.
North America's dairy blends market is forecasted to grow at a CAGR of 6.1% between 2025 and 2034, supported by the region's shift toward health-conscious, plant-forward diets. Blends incorporating soy, oat, or almond elements are gaining traction among those seeking clean-label, functional alternatives to traditional dairy. The rising demand for flavor-enhancing, nutrient-rich, and shelf-stable foods further boosts market growth.
Leading companies such as Cargill, Agropur, Friesland Campina, Kerry Group, Fonterra, Dohler, and AFP are pushing the envelope with R&D investments aimed at delivering cleaner labels and higher nutritional value. Through strategic collaborations and sustainability-focused initiatives, these players are expanding their global footprint while meeting consumer expectations for responsible sourcing and reduced environmental impact.
Table of Contents
Chapter 1 Methodology & Scope
- 1.1 Market scope & definitions
- 1.2 Base estimates & calculations
- 1.3 Forecast calculations
- 1.4 Data sources
- 1.4.1 Primary
- 1.4.2 Secondary
- 1.4.2.1 Paid sources
- 1.4.2.2 Public sources
Chapter 2 Executive Summary
- 2.1 Industry synopsis, 2021 - 2034
Chapter 3 Industry Insights
- 3.1 Industry ecosystem analysis
- 3.1.1 Factor affecting the value chain
- 3.1.2 Profit margin analysis
- 3.1.3 Disruptions
- 3.1.4 Future outlook
- 3.1.5 Manufacturers
- 3.1.6 Distributors
- 3.2 Trump administration tariffs
- 3.2.1 Impact on trade
- 3.2.1.1 Trade volume disruptions
- 3.2.1.2 Retaliatory measures
- 3.2.2 Impact on the industry
- 3.2.2.1 Supply-side impact (raw materials)
- 3.2.2.1.1 Price volatility in key materials
- 3.2.2.1.2 Supply chain restructuring
- 3.2.2.1.3 Production cost implications
- 3.2.2.2 Demand-side impact (selling price)
- 3.2.2.2.1 Price transmission to end markets
- 3.2.2.2.2 Market share dynamics
- 3.2.2.2.3 Consumer response patterns
- 3.2.2.1 Supply-side impact (raw materials)
- 3.2.3 Key companies impacted
- 3.2.4 Strategic industry responses
- 3.2.4.1 Supply chain reconfiguration
- 3.2.4.2 Pricing and product strategies
- 3.2.4.3 Policy engagement
- 3.2.5 Outlook and future considerations
- 3.2.6 Strategic industry responses
- 3.2.6.1 Supply chain reconfiguration
- 3.2.6.2 Pricing and product strategies
- 3.2.6.3 Policy engagement
- 3.2.7 Outlook and future considerations
- 3.2.1 Impact on trade
- 3.3 Trade statistics (HS code)
- 3.3.1 Major exporting countries
- 3.3.2 Major importing countries
Note: The above trade statistics will be provided for key countries only
- 3.4 Supplier landscape
- 3.5 Profit margin analysis
- 3.6 Key news & initiatives
- 3.7 Regulatory landscape
- 3.8 Impact forces
- 3.8.1 Growth drivers
- 3.8.1.1 Consumers prefer dairy blends for lower fat and cholesterol content.
- 3.8.1.2 Growing demand for functional foods
- 3.8.1.3 Dairy blends offer a suitable alternative
- 3.8.2 Industry pitfalls & challenges
- 3.8.2.1 Strict labeling and composition laws can limit market expansion.
- 3.8.2.2 Some buyers see blends as lower quality than pure dairy.
- 3.8.1 Growth drivers
- 3.9 Growth potential analysis
- 3.10 Porter's analysis
- 3.11 PESTEL analysis
Chapter 4 Competitive Landscape, 2024
- 4.1 Introduction
- 4.2 Company market share analysis
- 4.3 Competitive positioning matrix
- 4.4 Strategic outlook matrix
Chapter 5 Market Estimates & Forecast, By Type, 2021 - 2034 (USD Billion) (Kilo Tons)
- 5.1 Key trends
- 5.2 Dairy cream blends
- 5.3 Butter blends
- 5.4 Yogurt blends
- 5.5 Cheese blends
- 5.6 Other blends
Chapter 6 Market Estimates & Forecast, By Form, 2021 - 2034 (USD Billion) (Kilo Tons)
- 6.1 Key trends
- 6.2 Spreadable
- 6.3 Liquid
- 6.4 Powder
Chapter 7 Market Estimates & Forecast, By Application, 2021 - 2034 (USD Billion) (Kilo Tons)
- 7.1 Key trends
- 7.2 Bakery & confectionery
- 7.3 Dairy & frozen desserts
- 7.4 Beverages
- 7.5 Nutritional & functional foods
- 7.6 Others
Chapter 8 Market Estimates & Forecast, By Region, 2021 - 2034 (USD Billion) (Kilo Tons)
- 8.1 Key trends
- 8.2 North America
- 8.2.1 U.S.
- 8.2.2 Canada
- 8.3 Europe
- 8.3.1 UK
- 8.3.2 Germany
- 8.3.3 France
- 8.3.4 Italy
- 8.3.5 Spain
- 8.3.6 Russia
- 8.4 Asia Pacific
- 8.4.1 China
- 8.4.2 India
- 8.4.3 Japan
- 8.4.4 South Korea
- 8.4.5 Australia
- 8.5 Latin America
- 8.5.1 Brazil
- 8.5.2 Mexico
- 8.6 MEA
- 8.6.1 South Africa
- 8.6.2 Saudi Arabia
- 8.6.3 UAE
Chapter 9 Company Profiles
- 9.1 Kerry Group plc
- 9.2 FrieslandCampina
- 9.3 Cargill, Incorporated
- 9.4 Fonterra Co-operative Group Limited
- 9.5 Dohler GmbH
- 9.6 Agropur
- 9.7 AFP advanced food products llc
- 9.8 Cape Food Ingredients
- 9.9 Intermix Australia Pty Ltd.
- 9.10 Spectrum Organics Products, LLC

