
|
시장보고서
상품코드
2071189
풀 트럭로드 시장 : 기회, 성장 촉진요인, 업계 동향 분석 및 예측(2026-2035년)Full Truckload Market Opportunity, Growth Drivers, Industry Trend Analysis, and Forecast 2026 - 2035 |
||||||
세계의 풀 트럭로드 시장은 2025년에 1조 4,600억 달러 규모가 되어, CAGR 5.1%로 성장하여 2035년까지 2조 3,900억 달러에 이를 것으로 추정되고 있습니다.
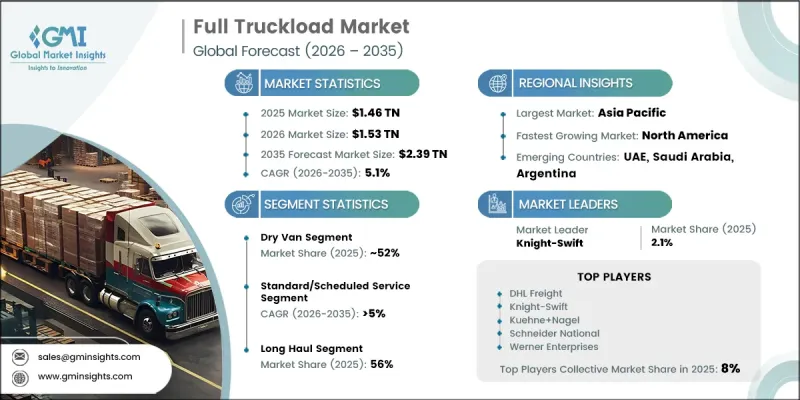
풀 트럭로드 시장의 성장은 화물 운송 수요의 변화, 공급망의 복잡화, 그리고 신뢰할 수 있는 전용 운송 솔루션에 대한 수요 증가에 힘입어 이루어지고 있습니다. 전자상거래 활동의 급속한 확대는 화물 이동 패턴을 크게 변화시켰으며, 이는 물류 시설과 유통 네트워크 간 정기 트럭 운송에 대한 수요 증가로 이어지고 있습니다. 물류에 대한 기대가 점점 높아지는 가운데, 화주들은 더 높은 효율성, 예측 가능성, 운송 속도를 제공하는 전용 운송 서비스에 대한 의존도를 높이고 있습니다. 이러한 추세로 인해 혼합 운송 모델에 대한 의존도가 낮아지면서, 운송업체와 물류 사업자에게 더 큰 수익 기회가 생겨나고 있습니다. 또한, 현재 진행 중인 공급망 재편 노력에 따라 화물 운송 경로가 재구성되면서, 국내 및 지역 간 트럭 운송 서비스에 대한 수요가 증가하고 있습니다. 기업들은 공급망의 회복탄력성, 업무의 유연성, 그리고 최종 시장과의 근접성을 점점 더 중요하게 여기고 있으며, 이는 트럭 운송 수요의 지속적인 확대에 기여하고 있습니다. 이러한 요인들에 더해, 물류 인프라에 대한 지속적인 투자와 화물 최적화 전략이 맞물려 전 세계 트럭 운송 업계 전반의 장기적인 성장을 뒷받침할 것으로 예측됩니다.
| 시장 범위 | |
|---|---|
| 시작 연도 | 2025년 |
| 예측 기간 | 2026-2035년 |
| 개시 금액 | 1조 4,600억 달러 |
| 예측 금액 | 2조 3,900억 달러 |
| CAGR | 5.1% |
세계 공급망의 재구축은 풀 트럭로드 시장에 계속해서 유리한 여건을 조성하고 있습니다. 기업들은 지리적 분산과 공급망 대응 능력 향상을 중시하는 조달 및 제조 전략을 점점 더 많이 채택하고 있습니다. 이러한 변화로 인해 국내 및 국경을 넘는 운송 노선에서 전용 화물 운송 능력에 대한 수요가 더욱 증가하고 있습니다. 기업들이 재고 동향과 유통 효율을 더욱 세밀하게 관리하려는 가운데, 풀 트럭로드 서비스는 현대 물류 업무에서 점점 더 중요한 요소로 자리 잡고 있습니다. 지역 밀착형 공급 네트워크에 대한 관심이 높아짐에 따라, 예측 기간 동안 화물량과 운송 활동은 더욱 확대될 것으로 전망됩니다.
드라이밴(건화물용 트레일러) 부문은 2025년에 52%의 시장 점유율을 차지하고, 2035년까지 연평균 성장률(CAGR) 4.5%를 기록하며 성장할 것으로 전망됩니다. 이 부문의 선도적 지위는 그 범용성과 다양한 유형의 화물을 운송할 수 있는 능력에 힘입어 유지되고 있습니다. 밀폐형 트레일러는 포장된 상품, 공업 제품, 소비재 및 운송 중 보호가 필요한 각종 일반 화물의 운송에 여전히 널리 이용되고 있습니다. 드라이밴 운송이 제공하는 유연성과 운영 효율성 덕분에, 많은 산업 분야와 운송 용도에서 여전히 선호되는 운송 수단으로 자리 잡고 있습니다.
2025년 기준으로 장거리 운송 부문은 시장 점유율의 56%를 차지했습니다. 장거리 운송의 성장은 주요 생산 거점, 물류 허브 및 최종 사용자 시장 간의 화물 운송량 증가에 힘입어 계속해서 뒷받침되고 있습니다. 제조업체, 소매업체 및 물류 서비스 제공업체는 광범위한 지역에 걸쳐 있는 공급망을 연결하기 위해 장거리 트럭 운송 솔루션에 크게 의존하고 있습니다. 무역 활동의 활성화, 물류 네트워크의 확대, 그리고 화물 수요 증가로 인해, 예측 기간 동안 장거리 운송 서비스 이용이 견조한 추세를 보일 것으로 전망됩니다.
북미의 풀 트럭로드(FTL) 시장은 2025년에 4,756억 달러 규모에 달하고, 2035년까지 연평균 성장률(CAGR) 6.3%로 성장할 것으로 전망됩니다. 이 지역은 선진적인 운송 인프라, 활발한 화물 운송 활동, 그리고 확대되는 물류 투자를 바탕으로 세계 시장의 성장에 있어 계속해서 중심적인 역할을 수행하고 있습니다. 화물 운송 수요의 지속적인 증가, 주문 처리 및 유통 능력의 확대, 그리고 대규모 인프라 투자로 인해 전미에서 트럭 운송 활동이 활발해지고 있습니다. 이러한 요인들로 인해 북미는 전 세계 풀트럭로드 시장의 성장에 있어 주요 견인차로서의 위상을 유지할 것으로 예측됩니다.
자주 묻는 질문
목차
제1장 조사 방법
제2장 주요 요약
제3장 업계 인사이트
제4장 경쟁 구도
제5장 시장 추산 및 예측 : 차량별, 2022-2035년
제6장 시장 추산 및 예측 : 서비스별, 2022-2035년
제7장 시장 추산 및 예측 : 운송 거리별, 2022-2035년
제8장 시장 추산 및 예측 : 최종 용도별, 2022-2035년
제9장 시장 추산 및 예측 : 연료별, 2022-2035년
제10장 시장 추산 및 예측 : 지역별, 2022-2035년
제11장 기업 개요
JHS 26.07.01The Global Full Truckload Market was valued at USD 1.46 trillion in 2025 and is estimated to grow at a CAGR of 5.1% to reach USD 2.39 trillion by 2035.

Growth in the full truckload market is driven by evolving freight transportation requirements, increasing supply chain complexity, and the rising need for reliable, dedicated shipping solutions. The rapid expansion of e-commerce activities has significantly transformed freight movement patterns, leading to greater demand for scheduled truckload transportation between logistics facilities and distribution networks. As delivery expectations continue to accelerate, shippers are increasingly relying on dedicated transportation services that provide greater efficiency, predictability, and transit speed. This trend is reducing dependence on consolidated freight models and creating stronger revenue opportunities for carriers and logistics providers. In addition, ongoing supply chain realignment initiatives are reshaping freight corridors and strengthening demand for domestic and regional trucking services. Businesses are increasingly prioritizing supply chain resilience, operational flexibility, and proximity to end markets, contributing to sustained truckload transportation demand. These factors, combined with continued investment in logistics infrastructure and freight optimization strategies, are expected to support long-term expansion across the global full truckload industry.
| Market Scope | |
|---|---|
| Start Year | 2025 |
| Forecast Year | 2026-2035 |
| Start Value | $1.46 Trillion |
| Forecast Value | $2.39 Trillion |
| CAGR | 5.1% |
The restructuring of global supply chains continues to create favorable conditions for the full truckload market. Companies are increasingly adopting sourcing and manufacturing strategies that emphasize geographic diversification and improved supply chain responsiveness. This shift is generating additional demand for dedicated freight capacity across domestic and cross-border transportation routes. As organizations seek greater control over inventory movement and distribution efficiency, full truckload services are becoming an increasingly important component of modern logistics operations. The growing preference for regionalized supply networks is expected to further strengthen freight volumes and transportation activity throughout the forecast period.
The dry van segment accounted for 52% share in 2025 and is anticipated to grow at a CAGR of 4.5% through 2035. The segment's leading position is supported by its versatility and ability to transport a broad range of freight categories. Enclosed trailers remain widely utilized for the movement of packaged goods, industrial products, consumer merchandise, and various types of general cargo that require protection during transit. The flexibility and operational efficiency offered by dry van transportation continue to make it the preferred equipment type across numerous industries and shipping applications.
The long-haul segment represented 56% share in 2025. Growth in long-haul transportation continues to be supported by increasing freight movement between major production centers, distribution hubs, and end-user markets. Manufacturers, retailers, and logistics service providers rely heavily on long-distance trucking solutions to connect supply chains across broad geographic areas. Rising trade activity, expanding logistics networks, and increasing freight demand are expected to sustain strong utilization of long-haul transportation services throughout the forecast period.
North America Full Truckload Market generated USD 475.6 billion in 2025 and is projected to grow at a CAGR of 6.3% through 2035. The region continues to play a central role in global market expansion, supported by advanced transportation infrastructure, strong freight activity, and growing logistics investments. Continued growth in freight transportation demand, expanding fulfillment and distribution capabilities, and large-scale infrastructure investments are strengthening trucking activity throughout the country. These factors are expected to maintain North America's position as a major contributor to the growth of the global full truckload market.
Leading companies operating in the global full truckload market include DHL Freight, Kuehne+Nagel, CEVA, GEODIS, Knight-Swift, Schneider National, and Werner Enterprises. Companies operating in the full truckload market are adopting a variety of strategies to strengthen their market presence and enhance competitive positioning. Major industry participants are investing in fleet modernization, transportation management technologies, and digital freight platforms to improve operational efficiency and service quality. Many carriers are expanding their geographic coverage and strengthening logistics networks to better serve evolving customer requirements. Strategic acquisitions, partnerships, and capacity expansion initiatives enable companies to increase market share and improve service capabilities. Organizations are also leveraging advanced analytics, route optimization software, and real-time visibility tools to enhance fleet utilization and reduce operating costs.
Table of Contents
Chapter 1 Methodology
- 1.1 Research approach
- 1.2 Quality Commitments
- 1.2.1 GMI AI policy & data integrity commitment
- 1.2.1.1 Source consistency protocol
- 1.2.1 GMI AI policy & data integrity commitment
- 1.3 Research Trail & Confidence Scoring
- 1.3.1 Research Trail Components
- 1.3.2 Scoring Components
- 1.4 Data Collection
- 1.4.1 Partial list of primary sources
- 1.5 Data mining sources
- 1.5.1 Paid sources
- 1.5.2 Sources, by region
- 1.6 Base estimates and calculations
- 1.6.1 Base year calculation
- 1.7 Forecast model
- 1.7.1 Quantified market impact analysis
- 1.7.1.1 Mathematical impact of growth parameters on forecast
- 1.7.1 Quantified market impact analysis
- 1.8 Research transparency addendum
- 1.8.1 Source attribution framework
- 1.8.2 Quality assurance metrics
- 1.8.3 Our commitment to trust
Chapter 2 Executive Summary
- 2.1 Industry 360° synopsis, 2022 - 2035
- 2.2 Key market trends
- 2.2.1 Regional
- 2.2.2 Vehicle
- 2.2.3 Service
- 2.2.4 Haul Distance
- 2.2.5 End Use
- 2.2.6 Fuel
- 2.3 TAM Analysis, 2026-2035
- 2.4 CXO perspectives: Strategic imperatives
Chapter 3 Industry Insights
- 3.1 Industry ecosystem analysis
- 3.1.1 Supplier landscape
- 3.1.2 Profit margin analysis
- 3.1.3 Cost structure
- 3.1.4 Value addition at each stage
- 3.1.5 Factor affecting the value chain
- 3.1.6 Disruptions
- 3.2 Industry impact forces
- 3.2.1 Growth drivers
- 3.2.1.1 Growth of e-commerce & last-mile distribution networks
- 3.2.1.2 Near-shoring & supply chain regionalization boosting domestic freight
- 3.2.1.3 Rising demand for dedicated & contracted capacity solutions
- 3.2.1.4 Infrastructure investment programs driving construction freight
- 3.2.2 Industry pitfalls and challenges
- 3.2.2.1 Structural driver shortage & high turnover rates
- 3.2.2.2 Overcapacity & prolonged spot rate depression
- 3.2.2.3 Rising insurance, fuel & maintenance cost burden
- 3.2.2.4 Regulatory compliance costs
- 3.2.3 Market opportunities
- 3.2.3.1 Digital Freight Brokerage & Load Matching Platform Adoption
- 3.2.3.2 Cold Chain Expansion for Pharma & Perishable Goods
- 3.2.3.3 Autonomous Trucking Commercialization Reducing Driver Dependency
- 3.2.3.4 Emerging Market Logistics Infrastructure Build-Out
- 3.2.1 Growth drivers
- 3.3 Growth potential analysis
- 3.4 Regulatory landscape
- 3.4.1 North America
- 3.4.1.1 Federal Motor Carrier Safety Regulations (FMCSRs)
- 3.4.1.2 Federal Motor Carrier Safety Administration (FMCSA)
- 3.4.1.3 U.S. Department of Transportation (DOT)
- 3.4.1.4 Electronic Logging Device (ELD) Mandate
- 3.4.1.5 National Safety Code (NSC) for Motor Carriers - Canada
- 3.4.2 Europe
- 3.4.2.1 EU Mobility Package
- 3.4.2.2 Drivers' Hours and Tachograph Regulation
- 3.4.2.3 Combined Transport Directive
- 3.4.2.4 EU Road Freight Transport Regulations
- 3.4.2.5 ADR Regulations for Dangerous Goods Transport
- 3.4.3 Asia Pacific
- 3.4.3.1 China Road Transport Regulations
- 3.4.3.2 Indian Motor Vehicles Act & Central Motor Vehicle Rules (CMVR)
- 3.4.3.3 National Heavy Vehicle Law (NHVL) - Australia
- 3.4.3.4 Japanese Road Transport Vehicle Act
- 3.4.3.5 ASEAN Framework Agreement on the Facilitation of Goods in Transit (AFAFGIT)
- 3.4.4 Latin America
- 3.4.4.1 Brazilian National Land Transport Agency (ANTT) Freight Regulations
- 3.4.4.2 Brazilian Road Cargo Transport Registry (RNTRC)
- 3.4.4.3 Mexican Federal Motor Carrier Regulations
- 3.4.4.4 Mercosur Road Transport Agreement
- 3.4.4.5 Regional Customs and Cross-Border Freight Transport Regulations
- 3.4.5 Middle East & Africa
- 3.4.5.1 GCC Unified Customs Law
- 3.4.5.2 Saudi Transport General Authority (TGA) Road Freight Regulations
- 3.4.5.3 UAE Federal Transport Authority Freight Transport Regulations
- 3.4.5.4 South African National Road Traffic Act (NRTA)
- 3.4.5.5 African Continental Free Trade Area (AfCFTA) Trade & Transport Protocols
- 3.4.1 North America
- 3.5 Porter's analysis
- 3.6 PESTEL analysis
- 3.7 Technology and innovation landscape
- 3.7.1 Current technological trends
- 3.7.2 Emerging technologies
- 3.8 Price analysis (Driven by Primary Research)
- 3.8.1 Historical Price Trend Analysis
- 3.8.2 Pricing Strategy by Player Type (Premium / Value / Cost-plus)
- 3.9 Cost breakdown analysis
- 3.10 Patent analysis (Driven by Primary Research)
- 3.11 Impact of AI & generative AI on the market
- 3.11.1 AI-driven disruption of existing business models
- 3.11.2 GenAI use cases & adoption roadmap by segment
- 3.11.3 Risks, limitations & regulatory considerations
- 3.12 Sustainability and environmental aspects
- 3.12.1 Sustainable practices
- 3.12.2 Waste reduction strategies
- 3.12.3 Energy efficiency in production
- 3.12.4 Eco-friendly Initiatives
- 3.12.5 Carbon footprint considerations
- 3.13 Forecast assumptions & scenario analysis (Driven by Primary Research)
- 3.13.1 Base Case - key macro & industry variables driving CAGR
- 3.13.2 Optimistic Scenarios - Favorable macro and industry tailwinds
- 3.13.3 Pessimistic Scenario - Macroeconomic slowdown or industry headwinds
Chapter 4 Competitive Landscape, 2025
- 4.1 Introduction
- 4.2 Company market share analysis
- 4.2.1 North America
- 4.2.2 Europe
- 4.2.3 Asia Pacific
- 4.2.4 LATAM
- 4.2.5 MEA
- 4.3 Competitive analysis of major market players
- 4.4 Competitive positioning matrix
- 4.5 Key developments
- 4.5.1 Mergers & acquisitions
- 4.5.2 Partnerships & collaborations
- 4.5.3 New Product Launches
- 4.5.4 Expansion Plans and funding
- 4.6 Company tier benchmarking
- 4.6.1 Tier classification criteria & qualifying thresholds
- 4.6.2 Tier positioning matrix by revenue, geography & innovation
Chapter 5 Market Estimates & Forecast, By Vehicle, 2022 - 2035 ($Mn, Fleet Size)
- 5.1 Key trends
- 5.2 Dry Van
- 5.3 Refrigerated
- 5.4 Flatbed
- 5.5 Tanker
- 5.6 Others
Chapter 6 Market Estimates & Forecast, By Service, 2022 - 2035 ($Mn)
- 6.1 Key trends
- 6.2 Standard/Scheduled Service
- 6.3 Expedited Service
- 6.4 Dedicated Contract Service
- 6.5 Spot Market Service
Chapter 7 Market Estimates & Forecast, By Haul Distance, 2022 - 2035 ($Mn, Fleet Size)
- 7.1 Key trends
- 7.2 Long Haul
- 7.3 Regional Haul
- 7.4 Short Haul
Chapter 8 Market Estimates & Forecast, By End Use, 2022 - 2035 ($Mn, Fleet Size)
- 8.1 Key trends
- 8.2 Manufacturing
- 8.3 Retail & E-Commerce
- 8.4 Food & Beverage
- 8.5 Construction
- 8.6 Chemicals & Petroleum
- 8.7 Agriculture
- 8.8 Others
Chapter 9 Market Estimates & Forecast, By Fuel, 2022 - 2035 ($Mn, Fleet Size)
- 9.1 Key trends
- 9.2 Diesel
- 9.3 Natural gas
- 9.4 BEV
- 9.5 HEV
- 9.6 FCEV
Chapter 10 Market Estimates & Forecast, By Region, 2022 - 2035 ($Mn, Fleet Size)
- 10.1 Key trends
- 10.2 North America
- 10.2.1 US
- 10.2.2 Canada
- 10.3 Europe
- 10.3.1 UK
- 10.3.2 Germany
- 10.3.3 France
- 10.3.4 Italy
- 10.3.5 Spain
- 10.3.6 Russia
- 10.3.7 Nordics
- 10.4 Asia Pacific
- 10.4.1 China
- 10.4.2 India
- 10.4.3 Japan
- 10.4.4 South Korea
- 10.4.5 Southeast Asia
- 10.4.5.1 Indonesia
- 10.4.5.2 Malaysia
- 10.4.5.3 Singapore
- 10.4.5.4 Thailand
- 10.4.5.5 Vietnam
- 10.4.6 ANZ
- 10.5 Latin America
- 10.5.1 Brazil
- 10.5.2 Argentina
- 10.5.3 Mexico
- 10.6 MEA
- 10.6.1 UAE
- 10.6.2 Saudi Arabia
- 10.6.3 South Africa
Chapter 11 Company Profiles
- 11.1 Global Players
- 11.2 CEVA Logistics
- 11.3 Dachser
- 11.4 Delhivery
- 11.5 DHL Freight
- 11.6 DSV
- 11.7 GEODIS
- 11.8 Kuehne+Nagel
- 11.9 Maersk Logistics
- 11.10 Nippon Express
- 11.11 Rhenus
- 11.12 Sinotrans
- 11.13 Regional Players
- 11.14 Girteka
- 11.15 Knight-Swift
- 11.16 Schneider
- 11.17 SF Express
- 11.18 STEF
- 11.19 TFI International
- 11.20 Waberer's
- 11.21 Werner
- 11.22 Emerging Players
- 11.23 CJ Darcl
