
|
시장보고서
상품코드
2071270
그래핀 시장 : 기회, 성장요인, 업계 동향 분석 및 예측(2026-2035년)Graphene Market Opportunity, Growth Drivers, Industry Trend Analysis, and Forecast 2026 - 2035 |
||||||
세계의 그래핀 시장은 2025년에 6억 2,510만 달러 규모가 되어, 22%의 연평균 복합 성장률(CAGR)로 확대되어 2035년까지 46억 달러에 이를 것으로 추정되고 있습니다.
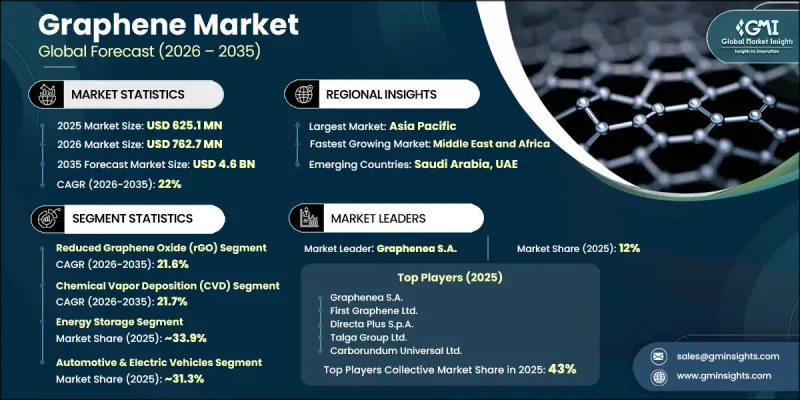
이 시장은 전 세계 수요의 대부분을 차지하는 전자 및 에너지 저장 분야에서의 그래핀 채택 확대에 힘입어 강력한 성장을 이루고 있습니다. 코팅, 복합재료 및 첨단 재료 시스템에서의 활용 확대 역시 시장 성장을 더욱 뒷받침하고 있습니다. 정부의 이니셔티브와 산업계의 협력을 바탕으로 활발해진 연구 개발 활동은 상용화를 가속화하는 데 있어 지극히 중요한 역할을 하고 있습니다. 아시아태평양은 강력한 전자제품 제조 역량과 첨단 소재에 대한 지속적인 투자를 바탕으로 여전히 주요 생산 거점으로서의 위상을 유지하고 있습니다. 한편, 북미와 유럽에서는 확립된 혁신 생태계와 지속 가능한 기술에 초점을 맞춘 지원적인 규제 환경을 통해 그래핀 연구가 지속적으로 진행되고 있습니다. 그래핀의 용도가 전 세계적으로 확대되고 있는 것은 그 뛰어난 성능 특성을 통해 여러 첨단 산업을 혁신할 잠재력을 여실히 보여주고 있습니다. 표준화 노력과 연구 프로그램을 통해 재료의 일관성과 확장성에 관한 중요한 과제들이 점차 해결되고 있으며, 이러한 요소들은 여전히 더 광범위한 상업적 채택을 위해 필수적입니다. 품질 관리 및 분류 체계를 목적으로 한 국제적인 노력을 통해 공급망의 통합이 진전되면서, 신뢰성이 더욱 높은 대규모 생산이 가능해지고 있습니다. 또한, 주요 지역에서 시행되고 있는 정부 주도의 프로그램이 특히 에너지 저장 시스템 및 첨단 복합재료 분야에서 시범 프로젝트와 상용화 노력을 적극적으로 지원하고 있습니다.
| 시장 범위 | |
|---|---|
| 시작 연도 | 2025년 |
| 예측 기간 | 2026-2035년 |
| 시작 연도 시장 규모 | 6억 2,510만 달러 |
| 예측 금액 | 46억 달러 |
| CAGR | 22% |
환원 산화 그래핀(rGO)은 2025년에 43.8%의 시장 점유율을 차지하고, 2035년까지 연평균 성장률(CAGR) 21.6%로 성장할 것으로 전망됩니다. 이 부문의 확고한 입지는 뛰어난 전도성, 가공의 용이성, 그리고 다양한 산업 분야에서의 적용성에 기인합니다. 이러한 재료 특성 덕분에 에너지 저장 시스템, 전도성 재료 및 코팅 솔루션 분야에서 폭넓게 활용될 수 있습니다. 분산성 향상과 화학적 적응성 향상으로 인해 여러 최종 이용 산업에서의 적용성이 더욱 높아지고 있으며, 이는 시장 전체의 성장에 크게 기여하고 있습니다.
화학기상증착(CVD) 부문은 2025년에 39.4%의 시장 점유율을 차지하고, 예측 기간 동안 연평균 성장률(CAGR) 21.7%로 성장할 것으로 전망됩니다. 이 방법은 첨단 전자 시스템이나 특수 코팅에 적합한, 균일한 구조와 뛰어난 성능 특성을 갖춘 고품질 그래핀 박막을 제조하는 데 널리 활용되고 있습니다. 또한, 액상 박리법 역시 기능성 잉크, 도료, 복합재료의 배합에 사용되는 확장 가능한 그래핀 분산액의 제조에 널리 활용되고 있습니다. 열 박리 기술은 표면적이 증가한 확장 그래핀 구조의 제조에 기여하고 있으며, 에너지 관련 용도에 특히 적합합니다.
2025년, 북미의 그래핀 시장은 18%의 점유율을 차지했습니다. 이 지역은 강력한 연구 역량, 선진적인 산업 인프라, 그리고 전자, 에너지 저장, 복합재료 등 다양한 분야에서 그래핀 기반 솔루션의 채택이 확대되고 있는 혜택을 누리고 있습니다. 확립된 혁신 생태계와 첨단 소재 개발을 촉진하는 지원 정책이 어우러져 지역 시장의 확대를 더욱 뒷받침하고, 그래핀 기술에 대한 지속적인 투자를 촉진하고 있습니다.
자주 묻는 질문
목차
제1장 조사 방법과 범위
제2장 주요 요약
제3장 업계 인사이트
제4장 경쟁 구도
제5장 시장 추산 및 예측 : 제품별, 2022-2035년
제6장 시장 추산 및 예측 : 생산 방법별, 2022-2035년
제7장 시장 추산 및 예측 : 용도별, 2022-2035년
제8장 시장 추산 및 예측 : 최종 사용자별, 2022-2035년
제9장 시장 추산 및 예측 : 지역별, 2022-2035년
제10장 기업 개요
JHS 26.07.01The Global Graphene Market was valued at USD 625.1 million in 2025 and is estimated to grow at a CAGR of 22% to reach USD 4.6 billion by 2035.

The market is witnessing strong expansion driven by the rising adoption of graphene across electronics and energy storage applications, which collectively account for a significant portion of global demand. Growing utilization in coatings, composites, and advanced material systems is further reinforcing market growth. Increasing research and development activities supported by government initiatives and industrial collaborations are playing a critical role in accelerating commercialization. The Asia Pacific region remains the dominant production hub, supported by strong electronics manufacturing capabilities and sustained investment in advanced materials. Meanwhile, North America and Europe continue to advance graphene research through well-established innovation ecosystems and supportive regulatory environments focused on sustainable technologies. The global expansion of graphene applications highlights its potential to transform multiple high-tech industries through enhanced performance characteristics. Standardization efforts and research programs are addressing key challenges related to material consistency and scalability, which remain essential for broader commercial adoption. International initiatives aimed at quality control and classification frameworks are improving supply chain integration and enabling more reliable large-scale production. In addition, government-backed programs across major regions are actively supporting pilot projects and commercialization efforts, particularly in energy storage systems and advanced composite materials.
| Market Scope | |
|---|---|
| Start Year | 2025 |
| Forecast Year | 2026-2035 |
| Start Value | $625.1 Million |
| Forecast Value | $4.6 Billion |
| CAGR | 22% |
The reduced graphene oxide (rGO) accounted for 43.8% share in 2025 and is projected to grow at a CAGR of 21.6% through 2035. The segment's strong position is attributed to its favorable electrical conductivity, ease of processing, and suitability for various industrial applications. Its material properties support widespread use in energy storage systems, conductive materials, and coating solutions. Improved dispersibility and chemical adaptability further enhance its applicability across multiple end-use industries, making it a key contributor to overall market growth.
The chemical vapor deposition (CVD) segment held a 39.4% share in 2025 and is expected to grow at a CAGR of 21.7% during the forecast period. This method is widely used for producing high-quality graphene films with uniform structure and strong performance characteristics suitable for advanced electronic systems and specialized coatings. Liquid-phase exfoliation is also widely adopted for producing scalable graphene dispersions used in functional inks, paints, and composite formulations. Thermal exfoliation techniques contribute to the production of expanded graphene structures with increased surface area, making them particularly suitable for energy-related applications.
North America Graphene Market held an 18% share in 2025. The region benefits from strong research capabilities, advanced industrial infrastructure, and increasing adoption of graphene-based solutions across electronics, energy storage, and composite material applications. A well-established innovation ecosystem, combined with supportive policies promoting advanced materials development, is further strengthening regional market expansion and encouraging continued investment in graphene technologies.
Major companies operating in the Global Graphene Market include Graphene Manufacturing Group Ltd. (GMG), Graphenea S.A., Talga Group Ltd., First Graphene Ltd., Directa Plus S.p.A., Paragraf, Bio Graphene Solutions (BGS), Solidion Technology, Inc., Hycamite TCD Technologies Ltd., Graphenemex, Carborundum Universal Ltd. (CUMI), Tata Steel, Miraculum Graphene Pvt. Ltd., LHP Nanotechnologies LLP, BT Corp Generic Nano Pvt. Ltd., and KNV'S Incorporation. Companies operating in the Graphene Market are adopting multiple strategic initiatives to strengthen their competitive position and expand market presence. Key strategies include increasing investments in research and development to enhance material performance, scalability, and cost efficiency. Businesses are focusing on improving production technologies and developing standardized manufacturing processes to ensure consistent product quality. Strategic collaborations with research institutions, industrial partners, and end-use industries are accelerating commercialization efforts and expanding application areas. Companies are also prioritizing capacity expansion, geographic diversification, and supply chain optimization to strengthen global reach.
Table of Contents
Chapter 1 Methodology & Scope
- 1.1 Market scope and definition
- 1.2 Research design
- 1.2.1 Research approach
- 1.2.2 Data collection methods
- 1.3 Data mining sources
- 1.3.1 Global
- 1.3.2 Regional/Country
- 1.4 Base estimates and calculations
- 1.4.1 Base year calculation
- 1.4.2 Key trends for market estimation
- 1.5 Primary research and validation
- 1.5.1 Primary sources
- 1.6 Forecast model
- 1.7 Research assumptions and limitations
Chapter 2 Executive Summary
- 2.1 Industry 360° synopsis
- 2.2 Key market trends
- 2.2.1 Regional
- 2.2.2 Product
- 2.2.3 Production Method
- 2.2.4 Application
- 2.2.5 End Use
- 2.3 TAM Analysis, 2026-2035
- 2.4 CXO perspectives: Strategic imperatives
- 2.4.1 Executive decision points
- 2.4.2 Critical success factors
- 2.5 Future Outlook and Strategic Recommendations
Chapter 3 Industry Insights
- 3.1 Industry ecosystem analysis
- 3.1.1 Supplier landscape
- 3.1.2 Profit margin
- 3.1.3 Value addition at each stage
- 3.1.4 Factor affecting the value chain
- 3.1.5 Disruptions
- 3.2 Industry impact forces
- 3.2.1 Growth drivers
- 3.2.1.1 Increasing graphene penetration in the electronic industry
- 3.2.1.2 Increasing investment in research & development of graphene
- 3.2.1.3 Increasing use of graphene in automotive & aerospace industries
- 3.2.2 Industry pitfalls and challenges
- 3.2.2.1 High manufacturing cost and environmental concerns
- 3.2.2.2 Lack of standardization and quality control
- 3.2.3 Market opportunities
- 3.2.3.1 Integration in next-generation energy storage systems
- 3.2.3.2 Expansion in flexible and wearable electronics
- 3.2.1 Growth drivers
- 3.3 Growth potential analysis
- 3.4 Regulatory landscape
- 3.4.1 North America
- 3.4.2 Europe
- 3.4.3 Asia Pacific
- 3.4.4 Latin America
- 3.4.5 Middle East & Africa
- 3.5 Porter's analysis
- 3.6 PESTEL analysis
- 3.7 Price trends
- 3.7.1 By region
- 3.7.2 By Product
- 3.8 Future market trends
- 3.9 Technology and Innovation landscape
- 3.9.1 Current technological trends
- 3.9.2 Emerging technologies
- 3.10 Patent Landscape
- 3.11 Trade statistics (HS code)
- 3.11.1 Major importing countries
- 3.11.2 Major exporting countries
- 3.12 Sustainability and environmental aspects
- 3.12.1 Sustainable practices
- 3.12.2 Waste reduction strategies
- 3.12.3 Energy efficiency in production
- 3.12.4 Eco-friendly initiatives
- 3.13 Carbon footprint consideration
Chapter 4 Competitive Landscape, 2025
- 4.1 Introduction
- 4.2 Company market share analysis
- 4.2.1 By region
- 4.2.1.1 North America
- 4.2.1.2 Europe
- 4.2.1.3 Asia Pacific
- 4.2.1.4 LATAM
- 4.2.1.5 MEA
- 4.2.1 By region
- 4.3 Company matrix analysis
- 4.4 Competitive analysis of major market players
- 4.5 Competitive positioning matrix
- 4.6 Key developments
- 4.6.1 Mergers & acquisitions
- 4.6.2 Partnerships & collaborations
- 4.6.3 New Product Launches
- 4.6.4 Expansion Plans
Chapter 5 Market Estimates and Forecast, By Product, 2022-2035 (USD Million) (Kilo Tons)
- 5.1 Key trends
- 5.2 Graphene Oxide
- 5.3 Reduced Graphene Oxide (rGO)
- 5.4 Pristine/Monolayer Graphene
- 5.5 Few-Layer Graphene (FLG)
- 5.6 Functionalized Graphene
- 5.7 Graphene Nanoribbons (GNR)
- 5.8 Graphene Films & Coatings
- 5.9 Graphene Powders & Dispersions
Chapter 6 Market Estimates and Forecast, By Production Method, 2022-2035 (USD Million) (Kilo Tons)
- 6.1 Key trends
- 6.2 Chemical Vapor Deposition (CVD)
- 6.3 Liquid-Phase Exfoliation (Ultrasonic)
- 6.4 Thermal Exfoliation
- 6.5 Chemical Exfoliation (Hummers Method)
- 6.6 Electrochemical Exfoliation
- 6.7 Methane Pyrolysis/Methane Splitting
Chapter 7 Market Estimates and Forecast, By Application, 2022-2035 (USD Million) (Kilo Tons)
- 7.1 Key trends
- 7.2 Energy Storage
- 7.2.1 Lithium-Ion Battery Anodes
- 7.2.2 Lithium-Sulfur (Li-S) Batteries
- 7.2.3 Supercapacitors & Micro-Supercapacitors
- 7.2.4 Fuel Cells
- 7.2.5 Others
- 7.3 Electronics & Optoelectronics
- 7.3.1 Transparent Conductive Films
- 7.3.2 Flexible & Wearable Electronics
- 7.3.3 Semiconductors & Transistors
- 7.3.4 Sensors & Biosensors
- 7.3.5 Others
- 7.4 Composites & Structural Materials
- 7.4.1 Polymer Composites
- 7.4.2 Aerospace & Defense Composites
- 7.4.3 Automotive Composites
- 7.5 Thermal Management & Heat Dissipation
- 7.5.1 Electronics Cooling Solutions
- 7.5.2 Graphene Films & Sheets
- 7.5.3 Thermal Interface Materials
- 7.5.4 High-Power Device Applications
- 7.5.5 Others
- 7.6 Coatings & Surface Treatments
- 7.6.1 Anticorrosion Coatings
- 7.6.2 Conductive Coatings
- 7.6.3 Thermal Coatings
- 7.6.4 Others
- 7.7 Filtration & Separation
- 7.7.1 Graphene Oxide Membranes
- 7.7.2 Desalination Applications
- 7.7.3 Industrial Water Treatment
- 7.7.4 Others
- 7.8 Biomedical & Healthcare
- 7.8.1 Drug Delivery Systems
- 7.8.2 Biosensors & Diagnostics
- 7.8.3 Tissue Engineering
- 7.8.4 Others
- 7.9 Conductive Inks & Printed Electronics
- 7.9.1 Flexible Circuit Applications
- 7.9.2 RFID Tags
- 7.9.3 Printed Sensors
- 7.9.4 Others
- 7.10 Photovoltaics & Solar Cells
- 7.10.1 Transparent Electrodes
- 7.10.2 Active Layer Materials
- 7.10.3 Flexible PV Applications
- 7.10.4 Others
Chapter 8 Market Estimates and Forecast, By End-User, 2022-2035 (USD Million) (Kilo Tons)
- 8.1 Key trends
- 8.2 Automotive & Electric Vehicles
- 8.3 Electronics & Semiconductors
- 8.4 Aerospace & Defense
- 8.5 Energy & Utilities
- 8.6 Healthcare & Biomedical
- 8.7 Chemical Manufacturing & Materials
- 8.8 Construction & Building Materials
- 8.9 Textiles & Sports Equipment
- 8.10 Others
Chapter 9 Market Estimates and Forecast, By Region, 2022-2035 (USD Million) (Kilo Tons)
- 9.1 Key trends
- 9.2 North America
- 9.2.1 U.S.
- 9.2.2 Canada
- 9.3 Europe
- 9.3.1 Germany
- 9.3.2 UK
- 9.3.3 France
- 9.3.4 Spain
- 9.3.5 Italy
- 9.3.6 Rest of Europe
- 9.4 Asia Pacific
- 9.4.1 China
- 9.4.2 India
- 9.4.3 Japan
- 9.4.4 Australia
- 9.4.5 South Korea
- 9.4.6 Rest of Asia Pacific
- 9.5 Latin America
- 9.5.1 Brazil
- 9.5.2 Mexico
- 9.5.3 Argentina
- 9.5.4 Rest of Latin America
- 9.6 Middle East and Africa
- 9.6.1 Saudi Arabia
- 9.6.2 South Africa
- 9.6.3 UAE
- 9.6.4 Rest of Middle East and Africa
Chapter 10 Company Profiles
- 10.1 Hycamite TCD Technologies Ltd.
- 10.2 Talga Group Ltd.
- 10.3 Graphenea S.A.
- 10.4 Bio Graphene Solutions (BGS)
- 10.5 Solidion Technology, Inc.
- 10.6 First Graphene Ltd.
- 10.7 Directa Plus S.p.A.
- 10.8 Graphene Manufacturing Group Ltd. (GMG)
- 10.9 Paragraf
- 10.10 Graphenemex
- 10.11 Miraculum Graphene Pvt. Ltd.
- 10.12 Tata Steel
- 10.13 KNV'S Incorporation
- 10.14 Carborundum Universal Ltd. (CUMI)
- 10.15 LHP Nanotechnologies LLP
- 10.16 BT Corp Generic Nano Pvt. Ltd.

