|
시장보고서
상품코드
1654630
대화형 AI 시장(2025-2029년)Global Conversational AI Market: 2025-2029 |
||||||
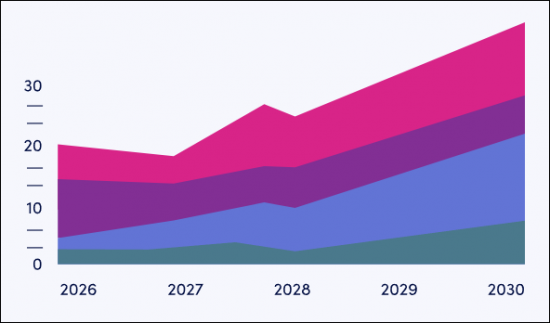
"대화 AI는 향후 3년간 세계에서 570억 달러의 수익을 창출할 전망"
| 주요 통계 | |
|---|---|
| 2025년 총 수익: | 146억 달러 |
| 2029년 총 수익: | 308억 달러 |
| 2025-2029년 시장 성장률: | 110% |
| 예측 기간: | 2025-2029년 |
설문조사 제품군은 진화하는 대화형 AI 시장을 촉진하는 주요 요인의 종합적인 분석으로 구성되어 있으며, 특히 비즈니스 커뮤니케이션의 자동화를 촉진하는 기술적 진보에 중점을 둡니다. 이 보고서를 통해 대화형 AI 공급업체 및 통신 서비스 제공업체와 같은 이해 관계자는 대화형 AI의 주요 투자 기회가 어디에 있는지 파악할 수 있습니다.
대화 AI 시장 보고서에는 개별적으로 구입할 수 있는 몇 가지 옵션이 포함되어 있습니다. 여기에는 대화형 AI 시장의 기업 도입과 향후 성장에 대한 시장 예측에 대한 액세스와 최신 시장 동향과 기회에 초점을 맞춘 상세한 조사가 포함됩니다. 또한 대화형 AI 분야의 주요 기업 분석을 포함한 경쟁 리더보드 등의 자료도 포함되어 있습니다.
주요 특징
- 시장 역학: 대화 AI 시장 전망에 대한 자세한 통찰력을 제공하고, 생성형 AI와 에이전트 AI가 비즈니스 커뮤니케이션 자동화의 미래에 미치는 영향을 포함하여 향후 시장 성장의 주요 촉진요인을 평가합니다. 채용을 촉진하는 기술적 진보, 비용 예측 가능성의 중요성, 대화형 메시징 이용 사례에 대한 기업 수요 증가 등 올해의 대화형 AI 시장 성장에 영향을 미치는 주요 요인을 다루고 있습니다. 또한 이 조사에서는 은행 및 금융, 소매, 헬스케어, 운수 등 주요 산업에서의 대화형 AI 서비스에 대한 기업 수요에 대해서도 조사했습니다. 또한 61개국 시장 기회를 평가하는 국가별 준비 지수도 포함되어 있으며, 대화형 AI 벤더에게 올해 주목해야 할 국가를 확인하고 있습니다.
- 주요 요점과 전략적 권장 사항: 대화형 AI 시장의 주요 발전 기회, 업계 동향, 지식을 상세하게 분석하고 이해관계자에 대한 주요 전략적 권장 사항를 함께 제공합니다.
- 벤치마크 업계 예측 : 대화형 AI를 도입하는 기업의 총 수와 대화형 AI로부터의 수익 총액의 5년 예측을 포함한 대화형 AI 시장 규모와 예측을 제공합니다. 또한 웹 기반, 앱 기반, 오버더톱(OTT) 기반, 리치 커뮤니케이션 서비스(RCS) 기반의 채팅 및 음성 봇 등 채팅 봇 유형별로 채팅 봇의 총 사용자 수와 액세스 수를 예측합니다. 또한 각 채팅봇 유형의 대화형 상거래 수익을 조사했습니다.
- Juniper Research의 경쟁 리더보드: 대화형 AI 공급업체 22개 기업의 능력을 평가합니다.
SAMPLE VIEW
시장 데이터 및 예측 보고서
시장 동향·전략 보고서

현재 시장 상황을 종합적으로 분석하고 전략적 제안을 합니다.
시장 데이터 및 예측 보고서
설문 조사 제품군에는 68개의 표와 31,000개 이상의 데이터 포인트에 대한 시장 예측 데이터 세트에 대한 액세스가 포함되어 있습니다. 설문조사 스위트에는 다음 측정항목이 포함됩니다.
- 채팅봇의 총 사용자 수와 액세스 수:
- 웹 기반
- 앱 기반
- OTT 베이스
- RCS 베이스
- 보이스봇
- 대화형 상거래에 대한 총 지출액
- 대화형 AI를 도입하고 있는 기업의 총 수
- 대화형 AI에 의한 총 수익
Juniper Research Interactive Forecast Excel에는 다음과 같은 기능이 있습니다.
- 통계 분석 : 데이터 기간 동안 모든 지역 및 국가에 대해 표시되며 특정 측정항목을 검색할 수 있습니다. 그래프는 쉽게 변경할 수 있으며 클립보드로 내보낼 수 있습니다.
- 국가별 데이터 도구: 이 도구를 사용하면 예측 기간 동안 모든 주요 지역과 국가 측정항목을 볼 수 있습니다. 검색창에 표시할 측정항목을 좁힐 수 있습니다.
- 국가별 비교 도구: 사용자는 국가를 선택하고 특정 국가에 대해 각각 비교할 수 있습니다. 이 도구에는 그래프를 내보내는 기능이 포함되어 있습니다.
- What-if 분석 : 5가지 대화형 시나리오를 통해 사용자는 예측 전제조건과 비교할 수 있습니다.
목차
시장 동향과 전략
제1장 중요 포인트와 전략적 권장 사항
- 중요 포인트
- 전략적 권장 사항
제2장 미래 시장 전망
- 미래 시장 전망 - 대화형 AI
- 대화형 AI 시장의 주요 촉진요인
- 대화형 AI의 도입을 촉진하는 기술의 진보
- 대화형 AI 서비스의 비용 절감과 비용 예측 가능성에 의한 도입률 향상
- 대화형 메시징에 대한 소비자 수요 증가
- 미래 시장 전망 - 대화형 상거래
- 대화형 상거래 시장의 주요 촉진요인
- 슈퍼 앱의 인기 증가
- 대화형 상거래 시장의 주요 촉진요인
- 규제 상황의 탐색
- 가드 레일을 작성할 때의 안내 제공
제3장 업계 수요
- 업계 수요
- 은행 및 금융
- 소매
- 헬스케어
- 수송
제4장 국가별 준비지수
- 대화형 AI 국가별 준비 지수
- 중점 시장
- 성장 시장
- 포화 시장
- 신흥국 시장
경쟁 리더보드
제1장 경쟁 리더보드
제2장 벤더 프로파일
- AWS
- Cisco Webex
- CM.com
- Cognigy
- Genesys
- Gupshup
- IBM
- Infobip
- IntelePeer
- Kore.ai
- LivePerson
- Microsoft Azure
- Route Mobile
- Sinch
- Soprano Design
- Sprinklr
- Tata Communications
- Unifonic
- Vonage
- Yellow.ai
- Zendesk
- Juniper Research 리더보드 평가조사방법
- 제한과 해석
- 관련 조사
데이터 및 예측
제1장 주요 시장 예측과 요점
- 대화형 AI 시장 개요와 전망
- 예측 기법
- 채팅봇 사용자수
제2장 대화형 상거래
- 채팅봇에 의한 대화형 상거래
- 웹 기반 채팅봇: 예측 기법
- 앱 기반 채팅봇: 예측 기법
- RCS 기반 채팅봇: 예측 기법
- OTT 기반 채팅봇: 예측 기법
- 음성 봇 : 예측 방법
- 액세스된 채팅봇 수
- 대화형 상거래에 의한 지출액
제3장 대화형 AI 서비스 지출액
- 대화형 AI 서비스의 지출액
- 예측 기법
- 대화형 AI를 활용한 기업
- 대화형 AI 서비스의 수익
'Conversational AI to Generate $57 Billion of Revenue Globally Over Next Three Years'
| KEY STATISTICS | |
|---|---|
| Total revenue in 2025: | $14.6bn |
| Total revenue in 2029: | $30.8bn |
| Market growth 2025-2029: | 110% |
| Forecast period: | 2025-2029 |
Overview
Our latest "Conversational AI" research suite comprises a comprehensive analysis of the key factors driving this evolving market in 2025, with specific focus on technological advancements enabling greater automation of business communications; including generative AI and agentic AI. The report enables stakeholders, from conversational AI vendors and communication service providers, to understand where the key investment opportunities are for conversational AI next year.
The conversational AI market report includes several different options that can be purchased separately. This includes access to a market forecast of the enterprise adoption and future growth of the conversational AI market, and a detailed study highlighting the latest market trends and opportunities. It also includes a Competitor Leaderboard document containing an analysis of the major players in the conversational AI space. The coverage can also be purchased as a full research suite, containing all these elements and including a substantial discount.
The study will provide stakeholders with key information on how to succeed in the conversational AI market, particularly as the market moves at a rapid pace. With many vendors offering competing conversational AI services, the report provides insight into the tools vendors must offer to provide the highest value to enterprises. Its extensive coverage makes the conversational AI research suite an incredibly valuable resource for examining the future of this market.
Key Features
- Market Dynamics: Provides detailed insight into the future outlook of the conversational AI market; assessing key drivers to future market growth, including the impact that generative AI and agentic AI will have on the future of business communication automation. It addresses the key factors that will impact the growth of the conversational AI market this year, including the technological advancements driving adoption, the importance of cost predictability, and increased enterprise demand for conversational messaging use cases. The research also explores enterprise demand for conversational AI services across key industries, including banking and finance, retail, healthcare, and transport. Moreover, it includes a Country Readiness Index which assesses the market opportunities across 61 countries, identifying countries which must be of focus for conversational AI vendors this year.
- Key Takeaways & Strategic Recommendations: In-depth analysis of key development opportunities, industry trends and findings within the conversational AI market; accompanied by key strategic recommendations for stakeholders.
- Benchmark Industry Forecasts: This provides market size and forecasts for conversational AI, including 5-year forecasts for total number of enterprises implementing conversational AI, and total revenue from conversational AI. It also forecasts the total number of chatbot users and accesses by chatbot type, including web-based, app-based, over-the-top (OTT)-based, and rich communications services (RCS)-based chatbots, as well as voicebots. It also looks at conversational commerce revenue across each chatbot type.
- Juniper Research Competitor Leaderboard: Key industry player capability and capacity assessment for 22 conversational AI vendors, via the Juniper Research Competitor Leaderboard.
SAMPLE VIEW
Market Data & Forecasting Report

The numbers tell you what's happening, but our written report details why, alongside the methodologies.
Market Trends & Strategies Report
A comprehensive analysis of the current market landscape, alongside strategic recommendations.
Market Data & Forecasting Report
The market-leading research suite for the "Conversational AI" market includes access to the full set of market forecast data of 68 tables and over 31,000 datapoints. Metrics in the research suite include:
- Total Number of Chatbot Users and Accesses, split into:
- Web-based
- App-based
- OTT-based
- RCS-based
- Voicebots
- Total Spend on Conversational Commerce
- Total Number of Businesses Implementing Conversational AI
- Total Revenue from Conversational AI
Juniper Research Interactive Forecast Excel contains the following functionality:
- Statistics Analysis: Users benefit from the ability to search for specific metrics, displayed for all regions and countries across the data period. Graphs are easily modified and can be exported to the clipboard.
- Country Data Tool: This tool lets users look at metrics for all key regions and countries in the forecast period. Users can refine the metrics displayed via a search bar.
- Country Comparison Tool: Users can select countries and compare each of them for specific countries. The ability to export graphs is included in this tool.
- What-if Analysis: Here, users can compare forecast metrics against their own assumptions, via five interactive scenarios.
Market Trends & Strategies Report
This market study examines the "Conversational AI" landscape in detail; assessing the impact of technological advancements with large language models and agentic AI frameworks. The report delivers an in-depth analysis of the strategic opportunities for vendors; addressing key technological advancements, industry demand, and considerations for navigating the regulatory landscape surrounding AI.
It also evaluates country level opportunities for conversational AI growth via Juniper Research's Country Readiness Index; identifying the key markets that conversational AI vendors should focus on next year.
Competitor Leaderboard Report
This Conversational AI market study includes a Competitor Leaderboard report, which provides detailed evaluation and market positioning of 22 conversational AI vendors. The vendors are positioned as established leaders, leading challengers, or disruptors and challengers based on product and capability assessments.
Juniper Research Competitor Leaderboard for Conversational AI, includes the following key players:
|
|
This document is centred around the Juniper Research Competitor Leaderboard; a vendor positioning tool that provides an at-a-glance view of the competitive landscape in a market, backed by a robust methodology.
Table of Contents
Market Trends & Strategies
1. Key Takeaways & Strategic Recommendations
- 1.1 Key Takeaways
- 1.2. Strategic Recommendations
2. Future Market Outlook
- 2.1. Introduction
- 2.2. Future Market Outlook - Conversational AI
- Figure 2.1: Total Conversational AI Service Revenue ($m), 2025-2029, Split by 8 Key Regions
- Figure 2.2: Total Number of Chatbot Users in 2025 (m), Split by 8 Key Regions
- 2.2.1 Key Drivers of the Conversational AI Market
- i. Technological Advancements Driving Conversational AI Adoption
- ii. Reduced Cost and Cost Predictability of Conversational AI Services will Drive Higher Adoption Rates
- iii. Increased Consumer Demand for Conversational Messaging
- Figure 2.3: Countries With the Highest Number of OTT Messaging Users in 2025 (m)
- 2.3. Future Market Outlook - Conversational Commerce
- Figure 2.4: Total Spend on Goods or Services via Chatbots ($m), 2025-2029, Split by 8 Key Regions
- 2.3.1. Key Drivers of the Conversational Commerce Market
- i. Growing Popularity of Superapps
- 2.4. Navigating the Regulatory Landscape
- i. Provide Guidance when Creating Guardrails
3. Industry Demand
- 3.1.1. Industry Demand
- i. Banking and Finance
- ii. Retail
- iii. Healthcare
- iv. Transport
4. Country Readiness Index
- 4.1. Conversational AI Country Readiness Index
- Figure 4.1: Countries in Each Region
- Table 4.2: Juniper Research Conversational AI Country Readiness Index: Scoring Criteria
- Figure 4.3: Juniper Research Country Readiness Index - Conversational AI
- Table 4.4: Conversational AI Country Readiness Index: Market Segments
- 4.1.1. Focus Markets
- i. Focus Markets Have Started to Implement More Comprehensive AI Regulations and Frameworks
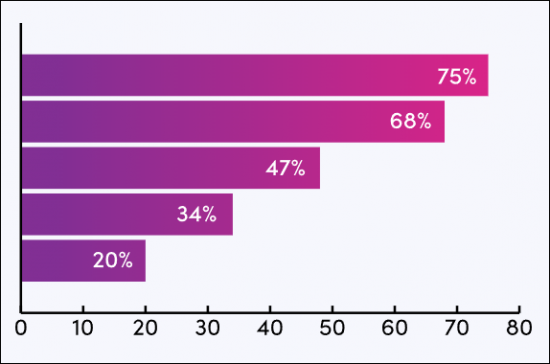
- Figure 4.5: Proportion of B2C Businesses Implementing Conversational AI (%), Key Focus Markets in West Europe in 2025
- ii. Notable Deployments of Conversational AI Will Accelerate Enterprise Adoption
- i. Focus Markets Have Started to Implement More Comprehensive AI Regulations and Frameworks
- 4.1.2. Growth Markets
- i. High Number of OTT Messaging Users
- Figure 4.6: Proportion of Mobile Subscribers that are Active OTT Messaging Users in Growth Markets in 2025 (%)
- i. High Number of OTT Messaging Users
- 4.1.3. Saturated Markets
- i. High A2P Traffic but Limited Opportunity for Conversational Messaging Across Rich Media Channels
- Figure 4.7: Proportion of Mobile Subscribers that are Active OTT Messaging Users (%) in Saturated Markets in 2025
- i. High A2P Traffic but Limited Opportunity for Conversational Messaging Across Rich Media Channels
- 4.1.4. Developing Markets
- i. Lower A2P Messaging Traffic Volumes Indicates Lower Enterprise Readiness for Conversational AI
- Figure 4.8: Average Number of A2P Messages Received per Mobile Subscriber per Month in Select Developing Markets, Compared with Select Focus Markets
- Table 4.9: Juniper Research Country Readiness Index Heatmap: North America
- i. Lower A2P Messaging Traffic Volumes Indicates Lower Enterprise Readiness for Conversational AI
Competitor Leaderboard
1. Competitor Leaderboard
- Table 1.1: Juniper Research Leaderboard: Conversational AI Vendors Included & Product Portfolio
- Figure 1.2: Juniper Research Competitor Leaderboard: Conversational AI Vendors
- Figure 1.3: Juniper Research Leaderboard: Conversational AI Vendors & Positioning
- Figure 1.4: Juniper Research Competitor Leaderboard Heatmap: Conversational AI Vendors: Part 1 of 2
- Table 1.5: Juniper Research Competitor Leaderboard Heatmap: Conversational AI Vendors - Part 2 of 2
2. Vendor Profiles
- 2.1.1. AWS
- i. Corporate Information
- Table 2.1: AWS' Revenue ($bn), 2021-2023
- ii. Geographical Spread
- Figure 2.2: Amazon Web Service Infrastructure Deployments Map, 2023
- iii. Key Clients & Strategic Partnerships
- iv. High-level View of Offerings
- v. Juniper Research's View: Key Strengths & Strategic Development Opportunities
- 2.1.2. Cisco Webex
- i. Corporate Information
- Table 2.3: Cisco's Relevant Acquisitions, 2023 - Present
- Table 2.4: Cisco's Selected Financial Information ($bn), 2021-2023
- ii. Geographical Spread
- iii. Key Clients & Strategic Partnerships
- iv. High-level View of Offerings
- v. Juniper Research's View: Key Strengths & Strategic Development Opportunities
- i. Corporate Information
- 2.1.3. CM.com
- i. Corporate Information
- Table 2.5: Acquisitions Made by CM.com, 2021-present
- Table 2.6: CM.com's Select Financial Information (Euro-m), 2022-2023
- ii. Geographical Spread
- iii. Key Clients & Strategic Partnerships
- iv. High-level View of Offerings
- v. Juniper Research's View: Key Strengths & Strategic Development Opportunities
- i. Corporate Information
- 2.1.4. Cognigy
- i. Corporate Information
- ii. Geographical Spread
- iii. Key Clients & Strategic Partnerships
- iv. High-level View of Offerings
- Figure 2.7: Cognigy.AI Platform
- v. Juniper Research's View: Key Strengths & Strategic Development Opportunities
- 2.1.5. Genesys
- i. Corporate Information
- ii. Geographical Spread
- iii. Key Clients & Strategic Partnerships
- iv. High-level View of Offerings
- v. Juniper Research's View: Key Strengths & Strategic Development Opportunities
- 2.1.6. Google
- i. Corporate Information
- Table 2.8: Google's Relevant Acquisitions, 2014-present
- Table 2.9: Google's Select Financial Information ($billion), 2022-2023
- ii. Geographical Spread
- iii. Key Clients & Strategic Partnerships
- iv. High-level View of Offerings
- v. Juniper Research's View: Key Strengths & Strategic Development Opportunities
- i. Corporate Information
- 2.1.7. Gupshup
- i. Corporate Information
- Table 2.10: Gupshup's Acquisitions, 2021-present
- ii. Geographical Spread
- iii. Key Clients & Strategic Partnerships
- iv. High-level View of Offerings
- v. Juniper Research's View: Key Strengths & Strategic Development Opportunities
- i. Corporate Information
- 2.1.8. IBM
- i. Corporate Information
- Table 2.11: IBM's Select Financial Information ($m), 2022-2023
- Table 2.12: IBM Recent Acquisitions Relevant to its AI and Software Solutions, 2023-present
- ii. Geographical Spread
- iii. Key Clients & Strategic Partnerships
- iv. High-level View of Offerings
- v. Juniper Research's View: Key Strengths & Strategic Development Opportunities
- i. Corporate Information
- 2.1.9. Infobip
- i. Corporate Information
- Table 2.13: Infobip's Acquisitions - April 2021 to Present
- ii. Geographical Spread
- iii. Key Clients & Strategic Partnerships
- iv. High-level View of Offerings
- v. Juniper Research's View: Key Strengths & Strategic Development Opportunities
- i. Corporate Information
- 2.1.10. IntelePeer
- i. Corporate Information
- ii. Geographical Spread
- iii. Key Clients & Strategic Partnerships
- iv. High-level View of Offerings
- v. Juniper Research's View: Key Strengths & Strategic Development Opportunities
- 2.1.11. Kore.ai
- i. Corporate Information
- ii. Geographical Spread
- iii. Key Clients & Strategic Partnerships
- iv. High-level View of Offerings
- v. Juniper Research's View: Key Strengths & Strategic Development Opportunities
- 2.1.12. LivePerson
- i. Corporate Information
- Table 2.14: LivePerson's Financial Revenue ($m) 2021-2023, Split by Segment
- Table 2.15: LivePerson Acquisitions 2018-present
- ii. Geographical Spread
- iii. Key Clients & Strategic Partnerships
- iv. High-level View of Offerings
- v. Juniper Research's View: Key Strengths & Strategic Development Opportunities
- i. Corporate Information
- 2.1.13. Microsoft Azure
- i. Corporate Information
- Table 2.16: Relevant Microsoft Acquisitions, 2018-present
- Table 2.17: Microsoft's Select Financial Information ($billion), FY 2022-FY 2024
- ii. Geographical Spread
- iii. Key Clients & Strategic Partnerships
- iv. High-level View of Offerings
- v. Juniper Research's View: Key Strengths & Strategic Development Opportunities
- i. Corporate Information
- 2.1.14. Route Mobile
- i. Corporate Information
- Table 2.18: Route Mobile's Financial Information (Indian Rupee Cr), FY 2021-22 - FY 2023-24
- ii. Geographical Spread
- iii. Key Clients & Strategic Partnerships
- iv. High-level View of Offerings
- v. Juniper Research's View: Key Strengths & Strategic Development Opportunities
- i. Corporate Information
- 2.1.15. Sinch
- i. Corporate Information
- Table 2.19: Sinch's Most Recent Acquisitions, 2020-2021
- Table 2.20: Sinch's Select Financial Information (SEKm), 2022-2023
- ii. Geographical Spread
- iii. Key Clients & Strategic Partnerships
- iv. High-level View of Offerings
- v. Juniper Research's View: Key Strengths & Strategic Development Opportunities
- i. Corporate Information
- 2.1.16. Soprano Design
- i. Corporate Information
- ii. Geographical Spread
- Figure 2.21: Soprano Design's Global Reach and Support Network
- iii. Key Clients & Strategic Partnerships
- iv. High-level View of Offerings
- v. Juniper Research's View: Key Strengths & Strategic Development Opportunities
- 2.1.17. Sprinklr
- i. Corporate Information
- Table 2.22: Sprinklr's Select Financial Information ($m), FY 2022-FY 2024
- ii. Geographical Spread
- iii. Key Clients & Strategic Partnerships
- iv. High-level View of Offerings
- v. Juniper Research's View: Key Strengths & Strategic Development Opportunities
- i. Corporate Information
- 2.1.18. Tata Communications
- i. Corporate Information
- Table 2.23: Tata Communications' Select Financial Information (Indian Rupee in crore), FY 2022-23 & FY 2023-24
- ii. Geographical Spread
- iii. Key Clients & Strategic Partnerships
- iv. High-level View of Offerings
- v. Juniper Research's View: Key Strengths & Strategic Development Opportunities
- i. Corporate Information
- 2.1.19. Unifonic
- i. Corporate Information
- ii. Geographical Spread
- iii. Key Clients & Strategic Partnerships
- iv. High-level View of Offerings
- v. Juniper Research's View: Key Strengths & Strategic Development Opportunities
- 2.1.20. Vonage
- i. Corporate Information
- ii. Geographical Spread
- iii. Key Clients & Strategic Partnerships
- iv. High-level View of Offerings
- v. Juniper Research's View: Key Strengths & Strategic Development Opportunities
- 2.1.21. Yellow.ai
- i. Corporate Information
- ii. Geographical Spread
- iii. Key Clients & Strategic Partnerships
- iv. High-level View of Offerings
- v. Juniper Research's View: Key Strengths & Strategic Development Opportunities
- 2.1.22. Zendesk
- i. Corporate Information
- ii. Geographical Spread
- iii. Key Clients & Strategic Partnerships
- iv. High-level View of Offerings
- v. Juniper Research's View: Key Strengths & Strategic Development Opportunities
- i. Corporate Information
- 2.2. Juniper Research Leaderboard Assessment Methodology
- 2.3. Limitations & Interpretations
- Table 2.24: Juniper Research Competitor Leaderboard Scoring Criteria
- 2.4. Related Research
Data & Forecasting
1. Key Market Forecasts & Takeaways
- 1.1. Conversational AI Market Summary & Future Outlook
- Conversational AI Market Summary Forecast Methodology
- Figure 1.1: Conversational AI Market Summary Forecast Methodology
- Chatbot Users
- Figure & Table 1.2: Total Number of Chatbot Users (m), Split by 8 Key Regions, 2025-2029
- Conversational AI Market Summary Forecast Methodology
2. Conversational Commerce
- Conversational Commerce over Chatbots
- Web-based Chatbots Forecast Methodology
- App-based Chatbots Forecast Methodology
- RCS-based Chatbots Forecast Methodology
- OTT-based Chatbots Forecast Methodology
- Voice Bots Forecast Methodology
- Figure 2.1: Web-based Chatbots Forecast Methodology
- Figure 2.2: App-based Chatbots Forecast Methodology
- Figure 2.3: RCS-based Chatbots Forecast Methodology
- Figure 2.4: OTT-based Chatbots Forecast Methodology
- Figure 2.5: Voice Bots Forecast Methodology
- 2.1.1. Chatbots Accessed
- Figure & Table 2.6: Total Number of Chatbots Accessed (m), Split by Chatbot Technologies, 2025-2029
- 2.1.2. Spend over Conversational Commerce
- Figure & Table 2.7: Total Spend over Conversational Commerce Channels ($m), Split by Chatbot Technologies, 2025-2029
3. Conversational AI Service Spend
- 3.1. Conversational AI Service Spend
- 3.1.1. Conversational AI Service Spend Forecast Methodology
- Figure 3.1: Conversational AI Service Spend Forecast Methodology
- 3.1.2. Businesses Using Conversational AI
- Figure & Table 3.2: Total Number of Businesses Using Conversational AI Services (m), Split by 8 Key Regions, 2025-2029
- 3.1.3. Conversational AI Service Revenue
- Figure & Table 3.3: Total Conversational AI Services Revenue ($m), Split by 8 Key Regions, 2025-2029
- 3.1.1. Conversational AI Service Spend Forecast Methodology