|
시장보고서
상품코드
1687724
뿌리혹박테리아(Rhizobium) : 시장 점유율 분석, 산업 동향, 통계, 성장 예측(2025-2030년)Rhizobium - Market Share Analysis, Industry Trends & Statistics, Growth Forecasts (2025 - 2030) |
||||||
뿌리혹박테리아(Rhizobium) 시장 규모는 2025년에 9억 달러, 2030년에는 15억 1,000만 달러에 이를 것으로 예측되며, 예측 기간 중(2025-2030년)의 CAGR은 10.74%를 나타낼 전망입니다.
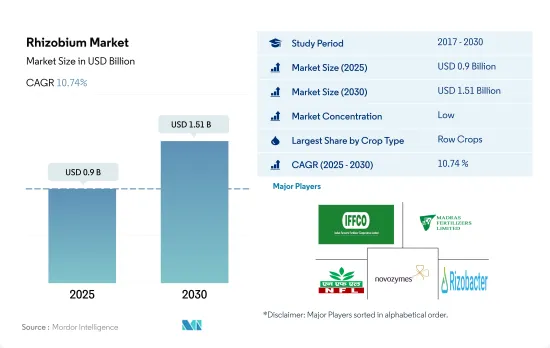
- 뿌리혹박테리아(Rhizobium)와 콩과 식물의 뿌리와의 특이적인 상호 작용은 고도로 제어 된 모듈레이션이라는 프로세스를 형성하고 대기 중의 질소를 동화 가능한 식물 영양소로 전환시킵니다. 이 능력은 농작물 생산에서 박테리아 접종제의 사용의 기초가 됩니다. 2022년 균근균 시장은 연작 작물이 지배적이었고 시장 매출의 약 69.7%를 차지했습니다. 세계적으로 가장 중요한 연작 작물은 보리, 옥수수, 밀, 유채, 호밀, 해바라기, 콩, 쌀입니다.
- 원예 작물의 뿌리혹박테리아(Rhizobium) 기반 바이오 비료 시장은 2022년 4,900톤이 사용되어 1억 3,720만 달러에 달했습니다. 뿌리혹박테리아(Rhizobium) 균주는 토마토와 피망의 뿌리에 착생하여 생산의 다양한 단계에서 성장을 가속하고 모종과 과일의 수율과 품질을 향상시킵니다. 또, 토마토나 고추 등의 온실 재배나, 기타 원예 과실 재배에도 이용되고 있습니다.
- 커피, 차, 코코아, 면화, 사탕수수, 유채, 해바라기, 담배는 세계적으로 재배되는 주요 환금 작물입니다. 2022년 뿌리혹박테리아(Rhizobium) 바이오비료 시장가치는 환금작물이 6,870만 달러를 차지했습니다. 북미는 환금 작물 시장을 독점했으며 2022년에는 약 5,220만 달러를 차지했습니다.
- 뿌리혹박테리아(Rhizobium)의 접종은 무기 질소 비료 수요를 줄이면서 식물에 필요한 질소를 공급할 수 있습니다. 효과적인 뿌리 박테리아 접종은 수율을 높이는 데 필요한 총 질소의 최대 50-70%를 공급할 수 있습니다. 뿌리 박테리아는 또한 비타민, 아미노산, 시데로포어, 옥신, 질소 고정을 생산합니다.
- 위의 특성과 뿌리혹박테리아(Rhizobium)에 기초한 비료의 용도가 증가함에 따라 시장은 2023년과 2029년 사이에 성장할 것으로 예상됩니다.
- 뿌리혹박테리아(Rhizobium)는 식물과 공생 관계에 있으며 콩과 식물의 뿌리 곡물에 서식하는 가장 중요한 질소 고정 박테리아입니다. 뿌리혹박테리아(Rhizobium)는 바이오비료 중 세계에서 두 번째로 소비량이 많아 2022년에는 25.4%의 점유율을 차지합니다.
- 뿌리혹박테리아(Rhizobium)의 미생물 활동에 의해 다양한 콩과 작물로 연간 1헥타르당 40-250kg의 질소가 고정될 것으로 추정되고 있습니다. 유럽 연합(EU)은 콩과 작물의 재배 면적 확대를 통해 지속 가능한 식물성 단백질 생산으로의 전환을 계획하고 있습니다.
- 북미가 세계 뿌리혹박테리아(Rhizobium) 시장을 독점했으며 2022년 시장 점유율은 52.7%였습니다. 북미의 뿌리혹박테리아(Rhizobium) 바이오 비료 시장은 연작 작물이 지배적이며 2022년 시장 매출의 약 62.4%를 차지하고 있습니다. 연작작물이 우세한 이유는 뿌리혹박테리아(Rhizobium)가 연작작물에 포함된 콩과작물과 공생하기 때문입니다. 이 지역에서는 연작 작물의 재배가 활발하기 때문에 그 시장 가치는 증가하고, 2023년부터 2029년에 걸쳐 CAGR 13.0%를 나타낼 것으로 예상됩니다.
- 비 레귤럼 작물에서는 작물의 수율 잠재력을 높이기 위해 질소를 추가 적용해야합니다. 생물학적 질소 고정 박테리아의 사용은 곡물, 과일, 야채와 같은 비 반추 작물의 생산을 증가시킬 수 있습니다. 뿌리혹박테리아(Rhizobium) 바이오 비료 시장은 경작 작물이 지배적이며, 농작물의 재배 면적이 넓기 때문에 2022년 시장 매출의 약 69.8%를 차지하고 있습니다. 뿌리 알갱이 바이오 비료를 과일 및 채소 작물에 적용하면 영양의 이용성이 높아지고 필요한 식물 호르몬이 생성되는 것으로 알려져 있습니다.
세계의 뿌리혹박테리아(Rhizobium) 시장 동향
북미와 유럽에서는 의식이 높아지고 정부의 이니셔티브으로 유기농업의 생산량이 과거 최고를 기록하고 있습니다.
- 유기농업은 지속가능한 식량시스템에 크게 공헌하는 것으로 대두되어 세계 187개국에서 실천되고 있습니다. 2021년 현재 세계 유기농지역은 7,230만 ha로 2018년부터 2021년까지 전 지역에서 평균 2.9% 증가하고 있습니다. 유기농경지는 1,440만 ha로, 유기농지 전체의 19.9%를 차지하고 있습니다.
- 유기농업의 가장 강력한 시장은 북미와 유럽으로 세계 유기농 경지의 41.0%를 차지하고 있습니다. 2022년에는 유럽에는 650만ha의 유기 경작지가 있으며, 이는 유기 경작지 전체의 44.1%에 해당합니다. 북미와 유럽에서 유기 재배되는 가장 중요한 작물은 사과, 딸기, 곡물, 올리브입니다.
- 아시아태평양의 신흥 국가들은 또한 유기농업운동에 참여하며 국내 수요를 충족하는 신선한 유기농산물의 생산과 공급으로 자급자족하고 있습니다. 유기농업의 동향은 아시아태평양에서 기세를 늘리고 있으며, 이 지역에서는 2017년부터 2022년에 걸쳐 유기경지면적이 18.8% 증가합니다. 이 지역 정부의 주요 이니셔티브도 유기농 농업의 확대 경향에 중요한 역할을 합니다. 예를 들어 일본의 식량 및 농업 및 농촌 기본계획은 2030년까지 유기농가와 유기농지의 수를 3배로 늘리는 것을 목표로 하고 있습니다.
- 유기농업의 성장의 원동력이 되는 것은 토양의 건강을 촉진하고, 환경에 대한 영향을 줄이고, 보다 건강한 식품을 생산하는 등 유기농업의 이점에 대한 의식 증가입니다.
유기농 식품의 1인당 지출은 주로 미국과 독일에서 관찰되지만, 이는 보다 건강하고 지속 가능한 식품에 대한 소비자 수요에 기인합니다.
- 유기농 식품 시장은 지난 몇 년간 현저한 성장을 거두었으며, 세계 매출은 2012년 708억 달러에서 2020년 1,206억 달러에 이릅니다. 유기농 식품에 대한 추세는 보다 건강하고 지속가능한 식품 선택을 추구하는 소비자 수요 증가와 전통적인 농업이 환경에 미치는 영향에 대한 의식이 증가하는 등 여러 요인들에 힘입어지고 있습니다. 세계 유기농 식품 시장은 향후 수년간 성장세가 지속될 것으로 예상됩니다.
- 유기농 무역협회가 2021년에 실시한 조사에 따르면 같은 해 유기농 과일 및 채소 매출은 약 4.5% 증가하여 전체 유기농 매출의 15%를 차지했습니다. 유기농 제품에 대한 평균 지출액은 북미가 시장을 독점하고 있으며, 미국 1인당 지출액은 2021년에 186.7달러에 이르고, 북미 국가 중 가장 높습니다. 유럽도 유기농 식품 시장에서 큰 성장이 예상되고 있으며, 2021년 1인당 지출액이 가장 높은 것은 독일에서 75.6달러입니다.
- 유기농 식품 시장은 소비자의 가처분 소득이 높은 선진국들이 여전히 지배적이지만, 신흥 국가에서도 성장이 예상됩니다. 예를 들어, 아시아태평양에서는 근로자 계급이 증가하고 있으며, 유기농 식품을 입수하기 쉽고 저렴한 가격으로 구입할 수 있게 되어 시장 확대에 기여할 가능성이 있습니다.
뿌리혹박테리아(Rhizobium) 산업 개요
뿌리혹박테리아(Rhizobium) 시장은 단편화되어 상위 5개사에서 28.14%를 차지하고 있습니다. 이 시장 주요 기업은 다음과 같습니다. Indian Farmers Fertiliser Cooperative Limited, Madras Fertilizers Limited, National Fertilizers Limited, Novozymes and Rizobacter(sorted alphabetically).
기타 혜택
- 엑셀 형식 시장 예측(ME) 시트
- 3개월의 애널리스트 서포트
목차
제1장 주요 요약과 주요 조사 결과
제2장 보고서 제안
제3장 소개
- 조사의 전제조건과 시장 정의
- 조사 범위
- 조사 방법
제4장 주요 산업 동향
- 유기 재배 면적
- 1인당 유기농 제품에 대한 지출
- 규제 프레임워크
- 아르헨티나
- 호주
- 브라질
- 캐나다
- 중국
- 이집트
- 프랑스
- 독일
- 인도
- 인도네시아
- 이탈리아
- 일본
- 멕시코
- 네덜란드
- 나이지리아
- 필리핀
- 러시아
- 남아프리카
- 스페인
- 태국
- 터키
- 영국
- 미국
- 베트남
- 밸류체인과 유통채널 분석
제5장 시장 세분화
- 작물 유형
- 환금작물
- 원예작물
- 경작작물
- 지역
- 아프리카
- 국가별
- 이집트
- 나이지리아
- 남아프리카
- 기타 아프리카
- 아시아태평양
- 국가별
- 호주
- 중국
- 인도
- 인도네시아
- 일본
- 필리핀
- 태국
- 베트남
- 기타 아시아태평양
- 유럽
- 국가별
- 프랑스
- 독일
- 이탈리아
- 네덜란드
- 러시아
- 스페인
- 터키
- 영국
- 기타 유럽
- 중동
- 국가별
- 이란
- 사우디아라비아
- 기타 중동
- 북미
- 국가별
- 캐나다
- 멕시코
- 미국
- 기타 북미
- 남미
- 국가별
- 아르헨티나
- 브라질
- 기타 남미
- 아프리카
제6장 경쟁 구도
- 주요 전략 동향
- 시장 점유율 분석
- 기업 상황
- 기업 프로파일.
- Indian Farmers Fertiliser Cooperative Limited
- Indogulf BioAg LLC(Biotech Division of Indogulf Company)
- IPL Biologicals Limited
- Lallemand Inc.
- Madras Fertilizers Limited
- National Fertilizers Limited
- Novozymes
- Rizobacter
- T Stanes and Company Limited
- Vittia Group
제7장 CEO에 대한 주요 전략적 질문
제8장 부록
- 세계 개요
- 개요
- Five Forces 분석 프레임워크
- 세계의 밸류체인 분석
- 시장 역학(DROs)
- 정보원과 참고문헌
- 도표 일람
- 주요 인사이트
- 데이터 팩
- 용어집
The Rhizobium Market size is estimated at 0.9 billion USD in 2025, and is expected to reach 1.51 billion USD by 2030, growing at a CAGR of 10.74% during the forecast period (2025-2030).

- The specific interaction between rhizobia and legume roots results in the formation of a highly regulated process termed modulation, which converts atmospheric nitrogen into an assimilable plant nutrient. This ability provides the basis for the use of bacterial inoculants in field crop production. Row crops dominated the mycorrhiza market in 2022, accounting for around 69.7% of market value. Globally, the most important row crops are barley, maize, wheat, rapeseed, rye, sunflower, soybean, and rice.
- The market for rhizobium-based biofertilizers in horticultural crops is expected to be worth USD 137.2 million, with 4.9 thousand metric tons used in 2022. Rhizobium strains colonize the roots of tomato and pepper plants to encourage growth at various stages of production, increasing seedling and fruit yield and quality. It is also utilized in greenhouse culture, such as tomato and capsicum farming, as well as other horticultural fruit growing.
- Coffee, tea, cocoa, cotton, sugarcane, rapeseed, sunflower, and tobacco are some of the major cash crops grown globally. Cash crops accounted for USD 68.7 million in the market value of rhizobium-based biofertilizers in 2022. North America dominated the market for cash crops and accounted for about USD 52.2 million in 2022.
- Rhizobium inoculation can provide plant nitrogen requirements while decreasing the demand for inorganic nitrogen fertilizer. Effective rhizobium inoculation can deliver up to 50-70% of the total nitrogen required to boost yields. Rhizobium also generates vitamins, amino acids, siderophores, auxins, and nitrogen fixation.
- Owing to the above-mentioned characteristics and the increase in the application of rhizobium-based fertilizers, the market is anticipated to grow between 2023 and 2029.
- Rhizobium is the most important nitrogen-fixing bacterium that exists in a symbiotic relationship with plants and lives in the root nodules of leguminous plants. Rhizobium is the second most consumed among biofertilizers globally and accounted for a share of 25.4% in the year 2022.
- It has been estimated that 40-250 kg of nitrogen per hectare per year is fixed by different legume crops by the microbial activities of rhizobium. The European Union is planning to make the transition toward sustainable plant protein production through the expansion of the area under leguminous crop cultivation.
- North America dominated the global rhizobium market with a market share of 52.7% in 2022. Row crops dominate the rhizobium biofertilizer market in North America, and they accounted for about 62.4% of the market value in 2022. The dominance of row crops is due to rhizobium's symbiotic association with leguminous crops, which come under row crops. Due to the large cultivation of row crops in the region, their market value is anticipated to increase, registering a CAGR of 13.0% between 2023 and 2029.
- The requirement for additional application of nitrogen in non-leguminous crops is high in order to enhance the yield potential of the crops. The usage of biological nitrogen-fixing bacteria can increase the production of non-leguminous crops like cereals, fruits, and vegetables. Row crops dominate the rhizobium biofertilizer market and accounted for about 69.8% of the market value in 2022, owing to the large area under the cultivation of field crops. The application of rhizobium biofertilizers in fruit and vegetable crops is known to increase nutrient availability and produce required plant hormones.
Global Rhizobium Market Trends
Organic production is at an all-time high in North America and Europe, due to the increasing awareness and Government initiatives.
- Organic agriculture has emerged as a significant contributor to sustainable food systems, with 187 countries practicing it globally. As of 2021, there was 72.3 million ha of organic agricultural land worldwide, with an average increase of 2.9% across all regions from 2018 to 2021. Organic arable land accounted for 14.4 million ha, representing 19.9% of the total organic agricultural land.
- The strongest markets for organic farming are North America and Europe, accounting for 41.0% of the global organic arable land. In 2022, Europe had 6.5 million ha of organic arable land, equivalent to 44.1% of the overall organic arable agricultural area. The most significant crops grown organically in North America and Europe are apples, strawberries, cereals, and olives.
- Developing countries in Asia-Pacific are also joining the organic agriculture movement and becoming self-sufficient in producing and providing fresh organic produce to meet their domestic demand. The trend of organic farming is gaining momentum in Asia-Pacific, with the region recording an 18.8% increase in organic arable land from 2017 to 2022. The major initiatives by governments in the region also play a vital role in the growing trend of organic farming. For example, Japan's Basic Plan for Food, Agriculture, and Rural Areas aims to triple the number of organic farmers and lands by 2030.
- The growth of organic agriculture is driven by the rising awareness of the benefits of organic farming, such as promoting soil health, reducing environmental impacts, and producing healthier food.
Per capita spending of organic food majorly observed in United States and Germany, attributed to the consumer demand for healthier and sustainable food
- The organic food market experienced significant growth in the past few years, with global sales reaching USD 120.6 billion in 2020, up from USD 70.8 billion in 2012. The trend toward organic food is being driven by several factors, such as increasing consumer demand for healthier, more sustainable food options and a growing awareness of the environmental impact of conventional agriculture. The global organic food market is expected to continue its growth trend over the coming years.
- According to a survey conducted by the Organic Trade Association in 2021, sales of organic fruits and vegetables increased by around 4.5% in the same year, accounting for 15% of the overall organic sales. North America dominates the market in terms of average spending on organic products, with per capita spending in the United States reaching USD 186.7 in 2021, the highest among all North American countries. Europe is also expected to experience significant growth in the organic food market, with Germany accounting for the highest per capita spending of USD 75.6 in 2021.
- While the organic food market is still dominated by developed countries with high consumer disposable incomes, it is also expected to grow in developing nations. For example, the increasing number of working-class people in the Asia-Pacific region may contribute to the market's expansion due to the growing availability and affordability of organic food products.
Rhizobium Industry Overview
The Rhizobium Market is fragmented, with the top five companies occupying 28.14%. The major players in this market are Indian Farmers Fertiliser Cooperative Limited, Madras Fertilizers Limited, National Fertilizers Limited, Novozymes and Rizobacter (sorted alphabetically).
Additional Benefits:
- The market estimate (ME) sheet in Excel format
- 3 months of analyst support
TABLE OF CONTENTS
1 EXECUTIVE SUMMARY & KEY FINDINGS
2 REPORT OFFERS
3 INTRODUCTION
- 3.1 Study Assumptions & Market Definition
- 3.2 Scope of the Study
- 3.3 Research Methodology
4 KEY INDUSTRY TRENDS
- 4.1 Area Under Organic Cultivation
- 4.2 Per Capita Spending On Organic Products
- 4.3 Regulatory Framework
- 4.3.1 Argentina
- 4.3.2 Australia
- 4.3.3 Brazil
- 4.3.4 Canada
- 4.3.5 China
- 4.3.6 Egypt
- 4.3.7 France
- 4.3.8 Germany
- 4.3.9 India
- 4.3.10 Indonesia
- 4.3.11 Italy
- 4.3.12 Japan
- 4.3.13 Mexico
- 4.3.14 Netherlands
- 4.3.15 Nigeria
- 4.3.16 Philippines
- 4.3.17 Russia
- 4.3.18 South Africa
- 4.3.19 Spain
- 4.3.20 Thailand
- 4.3.21 Turkey
- 4.3.22 United Kingdom
- 4.3.23 United States
- 4.3.24 Vietnam
- 4.4 Value Chain & Distribution Channel Analysis
5 MARKET SEGMENTATION (includes market size in Value in USD and Volume, Forecasts up to 2030 and analysis of growth prospects)
- 5.1 Crop Type
- 5.1.1 Cash Crops
- 5.1.2 Horticultural Crops
- 5.1.3 Row Crops
- 5.2 Region
- 5.2.1 Africa
- 5.2.1.1 By Country
- 5.2.1.1.1 Egypt
- 5.2.1.1.2 Nigeria
- 5.2.1.1.3 South Africa
- 5.2.1.1.4 Rest of Africa
- 5.2.2 Asia-Pacific
- 5.2.2.1 By Country
- 5.2.2.1.1 Australia
- 5.2.2.1.2 China
- 5.2.2.1.3 India
- 5.2.2.1.4 Indonesia
- 5.2.2.1.5 Japan
- 5.2.2.1.6 Philippines
- 5.2.2.1.7 Thailand
- 5.2.2.1.8 Vietnam
- 5.2.2.1.9 Rest of Asia-Pacific
- 5.2.3 Europe
- 5.2.3.1 By Country
- 5.2.3.1.1 France
- 5.2.3.1.2 Germany
- 5.2.3.1.3 Italy
- 5.2.3.1.4 Netherlands
- 5.2.3.1.5 Russia
- 5.2.3.1.6 Spain
- 5.2.3.1.7 Turkey
- 5.2.3.1.8 United Kingdom
- 5.2.3.1.9 Rest of Europe
- 5.2.4 Middle East
- 5.2.4.1 By Country
- 5.2.4.1.1 Iran
- 5.2.4.1.2 Saudi Arabia
- 5.2.4.1.3 Rest of Middle East
- 5.2.5 North America
- 5.2.5.1 By Country
- 5.2.5.1.1 Canada
- 5.2.5.1.2 Mexico
- 5.2.5.1.3 United States
- 5.2.5.1.4 Rest of North America
- 5.2.6 South America
- 5.2.6.1 By Country
- 5.2.6.1.1 Argentina
- 5.2.6.1.2 Brazil
- 5.2.6.1.3 Rest of South America
- 5.2.1 Africa
6 COMPETITIVE LANDSCAPE
- 6.1 Key Strategic Moves
- 6.2 Market Share Analysis
- 6.3 Company Landscape
- 6.4 Company Profiles (includes Global Level Overview, Market Level Overview, Core Business Segments, Financials, Headcount, Key Information, Market Rank, Market Share, Products and Services, and Analysis of Recent Developments).
- 6.4.1 Indian Farmers Fertiliser Cooperative Limited
- 6.4.2 Indogulf BioAg LLC (Biotech Division of Indogulf Company)
- 6.4.3 IPL Biologicals Limited
- 6.4.4 Lallemand Inc.
- 6.4.5 Madras Fertilizers Limited
- 6.4.6 National Fertilizers Limited
- 6.4.7 Novozymes
- 6.4.8 Rizobacter
- 6.4.9 T Stanes and Company Limited
- 6.4.10 Vittia Group
7 KEY STRATEGIC QUESTIONS FOR AGRICULTURAL BIOLOGICALS CEOS
8 APPENDIX
- 8.1 Global Overview
- 8.1.1 Overview
- 8.1.2 Porter's Five Forces Framework
- 8.1.3 Global Value Chain Analysis
- 8.1.4 Market Dynamics (DROs)
- 8.2 Sources & References
- 8.3 List of Tables & Figures
- 8.4 Primary Insights
- 8.5 Data Pack
- 8.6 Glossary of Terms