


|
시장보고서
상품코드
1851862
거래 감시 시스템 : 시장 점유율 분석, 산업 동향, 통계, 성장 예측(2025-2030년)Trade Surveillance Systems - Market Share Analysis, Industry Trends & Statistics, Growth Forecasts (2025 - 2030) |
||||||
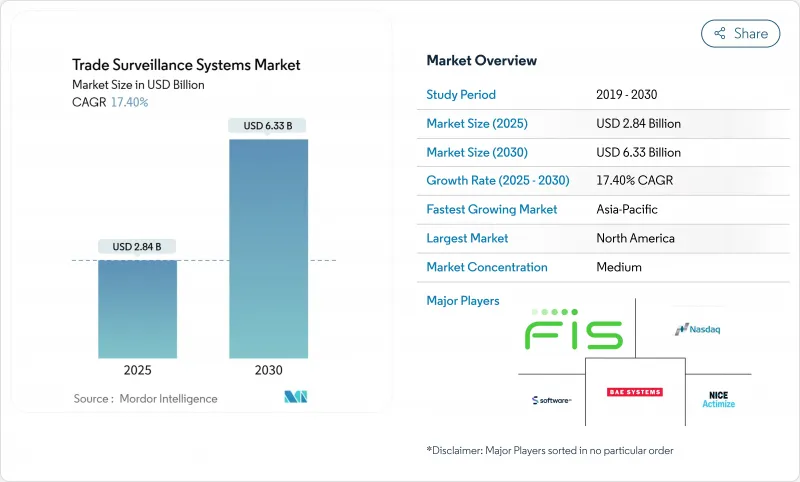
거래 감시 시스템 시장 규모는 2025년에 28억 4,000만 달러로 추정되며, 예측기간(2025-2030년)의 CAGR은 17.40%로, 2030년에는 63억 3,000만 달러에 달할 것으로 예상됩니다.

미국의 연결 감사 추적(CAT)과 유럽의 진화하는 MiFID II 프레임워크와 같은 보고 의무의 강화가 핵심 촉매가 되고 있습니다. 금융기관은 현재 초당 15만건 이상의 거래를 스크리닝하고 97.5%의 정확도로 의심스러운 패턴을 발견하는 거의 실시간 분석이 필요하며, 벤더는 고성능의 AI 구동 아키텍처를 지향하고 있습니다. 클라우드 도입은 선행 투자 요구사항을 줄이는 반면 하이브리드 모델은 데이터 주권에 대한 우려를 해결합니다. 암호화 자산과 토큰화 자산의 급성장으로 인해 복잡성이 커지고 있으며, 감시 플랫폼은 기존의 주식 및 파생 상품 이외의 분야로 확대되어야 합니다.
세계의 거래 감시 시스템 시장 동향과 인사이트
멀티 자산 전자거래 시장의 급속한 확대
고주파 거래와 알고리즘 전략이 미국 주식 거래량의 절반 이상을 차지하게 되어 레거시 룰셋에서는 커버할 수 없는 감시의 사각이 탄생하고 있습니다. 기업은 주식, 채권, 옵션, 상품에 걸친 주문장부를 상관시켜야 하며, 동시에 크로스 아비트 라지를 가능하게 하는 밀리초 단위의 레이턴시 갭을 고려해야 합니다. 런던의 딜러 모델에서 완전히 자동화된 주문 주도 거래소로의 전환은 유동성 향상이 얼마나 높은 시장 남용 위험과 공존하는지를 보여줍니다. 공급업체는 데이터 피드를 통합하고 단편화된 시장 전체에서 스푸핑 및 레이어링에 플래그를 지정하는 장소별 캘리브레이션을 통합하여 대응합니다.
CAT 및 기타 거래 후 투명성 의무화
CAT 시스템은 미국 브로커에게 모든 주식 및 선택적 이벤트를 하나의 스키마로 보고하도록 의무화하고 있습니다. 2025년 3월 개정을 통해 개인 정보 필드는 줄어들었고 고유 식별자는 유지되고 기업은 연간 1,200만 달러를 절약하면서 규제 당국에 충분한 정보를 제공할 수 있게 되었습니다. 유럽에서도 유사한 압력이 증가하고 있으며, MiFIR 3에서는 디지털 토큰 식별자와 새로운 만료 태그를 도입하여 보다 풍부한 페이로드를 처리하기 위한 업그레이드를 강요하고 있습니다. 따라서 금융 기관은 감시를 선택적 위험 도구가 아닌 기본 컴플라이언스 인프라로 취급합니다.
레거시 프론트, 미들, 백오피스 시스템과의 복잡한 통합
영국 금융기관의 거의 92%가 거래 파일을 하룻밤에 배치하는 메인프레임에 의존하고 있으며, 초 단위의 감시와는 호환되지 않습니다. 메시징 프로토콜, 필드 택소노미 및 클럭 싱크로나이제이션 브리징에는 수년에 걸쳐 로드맵이 필요하며 50개가 넘는 사내 팀이 참여하는 경우가 많습니다. 연결이 끊어지면 데이터 피드가 불완전해지고 경고를 놓치게 되므로 규제 당국이 데이터 무결성을 인증할 때까지 새롭고 오래된 플랫폼이 공존하는 병행 가동 기간을 강요합니다.
부문 분석
2024년 거래 감시 시스템 시장 점유율은 솔루션이 62.2%를 차지하고 주문, 집행 및 통신 데이터를 통합하는 엔드 투 엔드 플랫폼의 장점을 돋보이게 했습니다. 이 부문은 높은 스위칭 비용과 지속적인 규칙 업데이트를 통해 혜택을 누릴 수 있으며 공급업체는 지속적인 라이선스 수익을 얻을 수 있습니다. 솔루션과 관련된 거래 감시 시스템 시장 규모는 은행이 중요한 규제 기한 이전에 기업 라이선스를 업데이트하기 때문에 꾸준히 확대될 것으로 예측됩니다.
서비스는 규모가 작고 금융 기관이 모델 튜닝 및 규제 매핑을 아웃소싱함으로써 CAGR 18.2%를 나타낼 전망입니다. 매니지드 서비스 계약은 사내 인력 부족을 보완하고 24시간 체제로 각 지역을 커버합니다. 공급업체는 도입, 비헤이비어 모델 교정, 가동 후 테스트를 일괄적으로 계약하기 때문에 중견 브로커는 전문 쿼츠를 고용하는 것보다 비용 효율적이라고 생각합니다.
On-Premise 유형은 2024년에도 54.6%의 점유율을 유지했지만, 이는 데이터 주권에 대한 의무와 감사인이 방화벽 내에 있는 시스템을 선호한다는 것을 반영했습니다. 하지만 규제 당국이 암호화된 데이터가 승인된 관할 구역에 존재할 수 있음을 명확히 했기 때문에 클라우드 제품으로 인한 거래 감시 시스템 시장 규모는 2030년까지 연평균 복합 성장률(CAGR) 19.2%로 확대되어 가장 빠르게 확대될 것으로 예측됩니다.
클라우드 제공업체는 밤새 수백만 개의 시나리오를 다시 테스트할 수 있는 탄력적인 계산 능력을 제공합니다. 하이브리드 모델은 개인 식별 정보를 로컬 데이터센터에 저장하는 한편 비특정 거래 기록을 클라우드 클러스터로 전송하여 고급 분석을 수행하기 위해 지지를 받고 있습니다. 싱가포르와 캐나다에서의 테스트 성공은 암호화 키가 클라이언트 관리 상태로 유지되면 이러한 아키텍처가 규제 당국의 검사를 통과한다는 것을 보여줍니다.
거래 감시 시스템 시장은 구성요소(솔루션 및 서비스), 배포 형태(On-Premise 및 클라우드), 거래 유형(주식, 채권 등), 최종 사용자(셀사이드 기관, 바이사이드 기관 등), 조직 규모(Tier-1 세계 은행, Tier-2 및 중규모 기업 등) 및 지역별로 분류됩니다. 시장 예측은 금액(달러)으로 제공됩니다.
지역 분석
아시아태평양의 CAGR은 18.1%로 최고 속도를 기록해, 감독 기술의 팔로워로부터 프런트 러너에. 싱가포르 금융관리국은 AI 기반의 AML-CFT 모델을 시험적으로 도입하여 무역 감시의 컨트롤에 반영합니다. 홍콩은 허가받은 가상 자산 운용업체에 대한 감시 적용을 의무화하여 거래소와 프라임 브로커 지출을 증가 시켰습니다.
북미는 CAT와 2025년 중반에 발효할 예정인 공매도 규제가 원동력이 되어, 34.16%의 점유율로 최대의 공헌국이 되고 있습니다. 미국은 주요 주식 거래소와 옵션 거래소에 근접한 공급업체의 혜택을 누리고 캐나다는 교차 목록 거래량이 증가함에 따라 투자를 가속화하고 있습니다.
유럽에서는 MiFID II와 EMIR이 이미 엄격한 거래 보고를 도입하고 있어 성숙한 채용자 프로파일을 보유하고 있습니다. 미래 예정인 MiFIR 3에서는 디지털 토큰 식별자가 도입되어 규제 범위가 확대됩니다. 대륙의 은행은 사업 부문 간의 거래 식별자를 조정하기 위해 시스템을 업그레이드하고 영국 기업은 브렉짓 후 괴리를 관리하기 위해 병렬 프로세스를 실행하고 있습니다.
기타 혜택 :
- 엑셀 형식 시장 예측(ME) 시트
- 3개월의 애널리스트 지원
목차
제1장 서론
- 조사 전제조건과 시장 정의
- 조사 범위
제2장 조사 방법
제3장 주요 요약
제4장 시장 상황
- 시장 개요
- 시장 성장 촉진요인
- 세계 멀티 애셋 전자거래소의 급속한 확대
- 연결 감사 추적(CAT) 및 기타 거래 후 투명성 의무화
- AI/ML을 활용한 이상 감지로 오검지와 컴플라이언스 비용을 삭감
- 클라우드 네이티브 SaaS 딜리버리로 인한 총소유비용 감소
- 규제 대상 기관에 의한 암호화 및 디지털 자산 거래의 채용 확대
- 새로운 감시의 맹점을 낳는 실세계 자산의 토큰화
- 시장 성장 억제요인
- 레거시 프런트, 미들, 백오피스 시스템과의 높은 통합의 복잡성
- 무역 감시 데이터 사이언스의 인력 부족
- 세분화된 세계의 룰 세트로 인해 비용이 많이 드는 룰 맵핑
- 홀리스틱한 감시 데이터 풀링을 제한하는 프라이버시 규제 증가
- 업계 밸류체인 분석
- 규제 상황
- 기술 전망
- 업계의 매력 Porter's Five Forces 분석
- 공급기업의 협상력
- 구매자의 협상력
- 신규 참가업체의 위협
- 대체품의 위협
- 경쟁 기업 간 경쟁 관계
- 거시경제 요인이 시장에 미치는 영향
제5장 시장 규모와 성장 예측
- 구성 요소별
- 솔루션
- 서비스
- 배포 모드별
- On-Premise
- 클라우드
- 거래 유형별
- 주식
- 고정수익
- 파생상품
- 외환
- 원자재
- 디지털 자산
- 최종 사용자별
- 판매 측 기관
- 구매 측 기관
- 시장 플랫폼 및 거래소
- 규제 기관 및 자율규제기구
- 기업 규모별
- 글로벌 1급 은행
- 2급 및 중규모 기업
- 소규모 금융 기관 및 브로커 딜러
- 핀테크 및 암호화폐 거래소
- 지역별
- 북미
- 미국
- 캐나다
- 멕시코
- 남미
- 브라질
- 아르헨티나
- 칠레
- 기타 남미
- 유럽
- 독일
- 영국
- 프랑스
- 이탈리아
- 스페인
- 러시아
- 기타 유럽
- 아시아태평양
- 중국
- 인도
- 일본
- 한국
- 호주
- 싱가포르
- 말레이시아
- 기타 아시아태평양
- 중동 및 아프리카
- 중동
- 아랍에미리트(UAE)
- 사우디아라비아
- 튀르키예
- 기타 중동
- 아프리카
- 남아프리카
- 나이지리아
- 기타 아프리카
- 북미
제6장 경쟁 구도
- 시장 집중도
- 전략적 동향
- 시장 점유율 분석
- 기업 프로파일
- NICE Ltd.(Actimize)
- Nasdaq Inc.(SMARTS)
- BAE Systems Digital Intelligence
- Fidelity National Information Services Inc.(FIS)
- Software AG
- Eventus Systems Inc.
- ACA Group
- TradingHub Group Ltd.
- eflow Ltd.
- B-next Group GmbH
- Solidus Labs Inc.
- Aquis Technologies Ltd.
- Trillium Management LLC
- SIA SpA
- IBM Watson Financial RegTech
- S&P Global Market Intelligence(KYC/Surveillance)
- VoxSmart Ltd.
- OneMarketData LLC
- SteelEye Ltd.
- CranSoft(Scila AB)
- KX Systems(First Derivatives plc)
- ShieldFC Ltd.
- IPC Systems Inc.(Connexus)
- Trapets AB
- Corvil Analytics by Pico
- Digital Reasoning Systems Inc.
제7장 시장 기회와 앞으로의 동향
- 백스페이스와 미충족 수요(Unmet Needs) 평가
The Trade Surveillance Systems Market size is estimated at USD 2.84 billion in 2025, and is expected to reach USD 6.33 billion by 2030, at a CAGR of 17.40% during the forecast period (2025-2030).
Heightened reporting mandates such as the United States' Consolidated Audit Trail (CAT) and Europe's evolving MiFID II framework are the core catalysts. Institutions now need near-real-time analytics that screen more than 150,000 transactions per second and spot suspicious patterns with 97.5% accuracy, pushing vendors toward high-performance, AI-driven architectures. Cloud deployment lowers upfront capital requirements, while hybrid models address data-sovereignty concerns. Rapid growth in crypto and tokenized assets adds complexity, forcing surveillance platforms to expand beyond traditional equities and derivatives.
Global Trade Surveillance Systems Market Trends and Insights
Rapid Expansion of Multi-Asset Electronic Trading Venues
High-frequency and algorithmic strategies now drive more than half of US equity volumes, creating surveillance blind spots that legacy rule sets struggle to cover. Firms must correlate order books across equities, fixed income, options, and commodities while accounting for millisecond latency gaps that enable cross-venue arbitrage. The shift from dealer models to fully automated order-driven venues in London illustrates how liquidity gains coexist with higher market-abuse risk. Vendors respond by unifying data feeds and embedding venue-specific calibrations that flag spoofing and layering across fragmented markets.
Mandatory CAT and Other Post-Trade Transparency Mandates
The CAT regime obliges US brokers to report every equity and option event under one schema. A March 2025 amendment trimmed personal data fields yet preserved unique identifiers, saving firms USD 12 million yearly while keeping regulators fully informed. Similar pressure builds in Europe, where MiFIR 3 introduces digital-token identifiers and new effective-date tags, compelling upgrades to handle richer payloads. Institutions, therefore, treat surveillance as foundational compliance infrastructure rather than optional risk tooling.
High Integration Complexity with Legacy Front-, Middle- and Back-Office Systems
Nearly 92% of UK institutions still rely on mainframes that batch-process trade files overnight, a cadence incompatible with second-by-second surveillance. Bridging message protocols, field taxonomies, and clock synchronisation requires multi-year roadmaps, often involving 50-plus internal teams. Disconnects cause incomplete data feeds and missed alerts, forcing parallel run periods where old and new platforms coexist until regulators certify data integrity.
Other drivers and restraints analyzed in the detailed report include:
- AI/ML-Powered Anomaly Detection Reducing False Positives and Cost
- Cloud-Native SaaS Delivery Lowering Total Cost of Ownership
- Shortage of Trade-Surveillance Data-Science Talent
For complete list of drivers and restraints, kindly check the Table Of Contents.
Segment Analysis
Solutions held 62.2% of the trade surveillance systems market share in 2024, underscoring the primacy of end-to-end platforms that integrate order, execution, and communications data. The segment benefits from high switching costs and continual rule updates, positioning vendors for recurring licensing revenue. The trade surveillance systems market size attached to solutions is projected to lift steadily as banks renew enterprise licences before key regulatory deadlines.
Services, though smaller, grow at 18.2% CAGR as institutions outsource model tuning and regulatory mapping. Managed-service contracts fill in-house talent gaps and provide 24-hour coverage across regions. Providers bundle implementation, behavioural-model calibration, and post-go-live testing, a package that mid-tier brokers consider more cost-effective than hiring specialised quants.
On-premise deployments retained a 54.6% share in 2024, reflecting data-sovereignty obligations and auditor preference for systems housed within firewalls. Yet the trade surveillance systems market size attributed to cloud offerings is set to rise fastest, expanding at 19.2% CAGR through 2030 as regulators issue clarifications that encrypted data may reside in approved jurisdictions.
Cloud providers offer elastic compute for back-testing millions of scenarios overnight, an ability that on-premise grids struggle to replicate without oversizing. Hybrid models gain traction because they keep personally identifiable information in local data centres while diverting de-identified trade records to cloud clusters for heavy analytics. Successful pilots in Singapore and Canada demonstrate that such architectures pass regulatory inspection when encryption keys remain client-controlled.
Trade Surveillance Systems Market is Segmented by Component (Solutions and Services), Deployment Mode (On-Premise and Cloud), Trading Type (Equities, Fixed Income, and More), End-User (Sell-Side Institutions, Buy-Side Institutions, and More), Organisation Size (Tier-1 Global Banks, Tier-2 and Mid-Sized Firms, and More), and Geography. The Market Forecasts are Provided in Terms of Value (USD).
Geography Analysis
Asia-Pacific records the fastest regional CAGR of 18.1%, moving from follower to front-runner in supervisory technology. Monetary Authority of Singapore pilots AI-based AML-CFT models that feed into trade-surveillance controls, creating reference implementations that other regulators monitor closely. Hong Kong mandates surveillance coverage for licensed virtual-asset operators, lifting spending among exchanges and prime brokers.
North America remains the largest contributor with a 34.16% share, driven by CAT and planned short-sale flags that take effect mid-2025. The United States benefits from vendor proximity to major equity and options venues, while Canada accelerates investment as cross-listing volumes climb.
Europe holds a mature adopter profile where MiFID II and EMIR already embed strict transaction reporting. Upcoming MiFIR 3 changes introduce digital-token identifiers that widen the regulatory perimeter. Continental banks upgrade systems to reconcile trade identifiers across business lines, and UK firms run parallel processes to manage post-Brexit divergence.
- NICE Ltd. (Actimize)
- Nasdaq Inc. (SMARTS)
- BAE Systems Digital Intelligence
- Fidelity National Information Services Inc. (FIS)
- Software AG
- Eventus Systems Inc.
- ACA Group
- TradingHub Group Ltd.
- eflow Ltd.
- B-next Group GmbH
- Solidus Labs Inc.
- Aquis Technologies Ltd.
- Trillium Management LLC
- SIA S.p.A.
- IBM Watson Financial RegTech
- S&P Global Market Intelligence (KYC/Surveillance)
- VoxSmart Ltd.
- OneMarketData LLC
- SteelEye Ltd.
- CranSoft (Scila AB)
- KX Systems (First Derivatives plc)
- ShieldFC Ltd.
- IPC Systems Inc. (Connexus)
- Trapets AB
- Corvil Analytics by Pico
- Digital Reasoning Systems Inc.
Additional Benefits:
- The market estimate (ME) sheet in Excel format
- 3 months of analyst support
TABLE OF CONTENTS
1 INTRODUCTION
- 1.1 Study Assumptions and Market Definition
- 1.2 Scope of the Study
2 RESEARCH METHODOLOGY
3 EXECUTIVE SUMMARY
4 MARKET LANDSCAPE
- 4.1 Market Overview
- 4.2 Market Drivers
- 4.2.1 Rapid expansion of global multi-asset electronic trading venues
- 4.2.2 Mandatory consolidated audit trail (CAT) and other post-trade transparency mandates
- 4.2.3 AI/ML-powered anomaly detection reduces false positives and compliance costs
- 4.2.4 Cloud-native SaaS delivery lowering total cost of ownership
- 4.2.5 Growing adoption of crypto and digital-asset trading by regulated institutions
- 4.2.6 Tokenisation of real-world assets creating new surveillance blind spots
- 4.3 Market Restraints
- 4.3.1 High integration complexity with legacy front-, middle- and back-office systems
- 4.3.2 Shortage of trade-surveillance data-science talent
- 4.3.3 Fragmented global rule sets leading to costly rule-mapping
- 4.3.4 Rising privacy regulations limiting holistic surveillance data pooling
- 4.4 Industry Value Chain Analysis
- 4.5 Regulatory Landscape
- 4.6 Technological Outlook
- 4.7 Industry Attractiveness - Porter's Five Forces Analysis
- 4.7.1 Bargaining Power of Suppliers
- 4.7.2 Bargaining Power of Buyers
- 4.7.3 Threat of New Entrants
- 4.7.4 Threat of Substitutes
- 4.7.5 Intensity of Competitive Rivalry
- 4.8 Impact of Macroeconomic Factors on the Market
5 MARKET SIZE AND GROWTH FORECASTS (VALUES)
- 5.1 By Component
- 5.1.1 Solutions
- 5.1.2 Services
- 5.2 By Deployment Mode
- 5.2.1 On-Premise
- 5.2.2 Cloud
- 5.3 By Trading Type
- 5.3.1 Equities
- 5.3.2 Fixed Income
- 5.3.3 Derivatives
- 5.3.4 Foreign Exchange
- 5.3.5 Commodities
- 5.3.6 Digital Assets
- 5.4 By End-user
- 5.4.1 Sell-Side Institutions
- 5.4.2 Buy-Side Institutions
- 5.4.3 Market Venues and Exchanges
- 5.4.4 Regulators and SROs
- 5.5 By Organisation Size
- 5.5.1 Tier-1 Global Banks
- 5.5.2 Tier-2 and Mid-Sized Firms
- 5.5.3 Small FIs and Broker-Dealers
- 5.5.4 FinTech and Crypto Exchanges
- 5.6 By Geography
- 5.6.1 North America
- 5.6.1.1 United States
- 5.6.1.2 Canada
- 5.6.1.3 Mexico
- 5.6.2 South America
- 5.6.2.1 Brazil
- 5.6.2.2 Argentina
- 5.6.2.3 Chile
- 5.6.2.4 Rest of South America
- 5.6.3 Europe
- 5.6.3.1 Germany
- 5.6.3.2 United Kingdom
- 5.6.3.3 France
- 5.6.3.4 Italy
- 5.6.3.5 Spain
- 5.6.3.6 Russia
- 5.6.3.7 Rest of Europe
- 5.6.4 Asia-Pacific
- 5.6.4.1 China
- 5.6.4.2 India
- 5.6.4.3 Japan
- 5.6.4.4 South Korea
- 5.6.4.5 Australia
- 5.6.4.6 Singapore
- 5.6.4.7 Malaysia
- 5.6.4.8 Rest of Asia-Pacific
- 5.6.5 Middle East and Africa
- 5.6.5.1 Middle East
- 5.6.5.1.1 United Arab Emirates
- 5.6.5.1.2 Saudi Arabia
- 5.6.5.1.3 Turkey
- 5.6.5.1.4 Rest of Middle East
- 5.6.5.2 Africa
- 5.6.5.2.1 South Africa
- 5.6.5.2.2 Nigeria
- 5.6.5.2.3 Rest of Africa
- 5.6.1 North America
6 COMPETITIVE LANDSCAPE
- 6.1 Market Concentration
- 6.2 Strategic Moves
- 6.3 Market Share Analysis
- 6.4 Company Profiles (includes Global level Overview, Market level overview, Core Segments, Financials as available, Strategic Information, Market Rank/Share for key companies, Products and Services, and Recent Developments)
- 6.4.1 NICE Ltd. (Actimize)
- 6.4.2 Nasdaq Inc. (SMARTS)
- 6.4.3 BAE Systems Digital Intelligence
- 6.4.4 Fidelity National Information Services Inc. (FIS)
- 6.4.5 Software AG
- 6.4.6 Eventus Systems Inc.
- 6.4.7 ACA Group
- 6.4.8 TradingHub Group Ltd.
- 6.4.9 eflow Ltd.
- 6.4.10 B-next Group GmbH
- 6.4.11 Solidus Labs Inc.
- 6.4.12 Aquis Technologies Ltd.
- 6.4.13 Trillium Management LLC
- 6.4.14 SIA S.p.A.
- 6.4.15 IBM Watson Financial RegTech
- 6.4.16 S&P Global Market Intelligence (KYC/Surveillance)
- 6.4.17 VoxSmart Ltd.
- 6.4.18 OneMarketData LLC
- 6.4.19 SteelEye Ltd.
- 6.4.20 CranSoft (Scila AB)
- 6.4.21 KX Systems (First Derivatives plc)
- 6.4.22 ShieldFC Ltd.
- 6.4.23 IPC Systems Inc. (Connexus)
- 6.4.24 Trapets AB
- 6.4.25 Corvil Analytics by Pico
- 6.4.26 Digital Reasoning Systems Inc.
7 MARKET OPPORTUNITIES AND FUTURE TRENDS
- 7.1 White-Space and Unmet-Need Assessment
