
|
시장보고서
상품코드
2044233
LEO 위성 시장 : 점유율 분석, 업계 동향과 통계, 성장 예측(2026-2031년)LEO Satellite - Market Share Analysis, Industry Trends & Statistics, Growth Forecasts (2026 - 2031) |
||||||
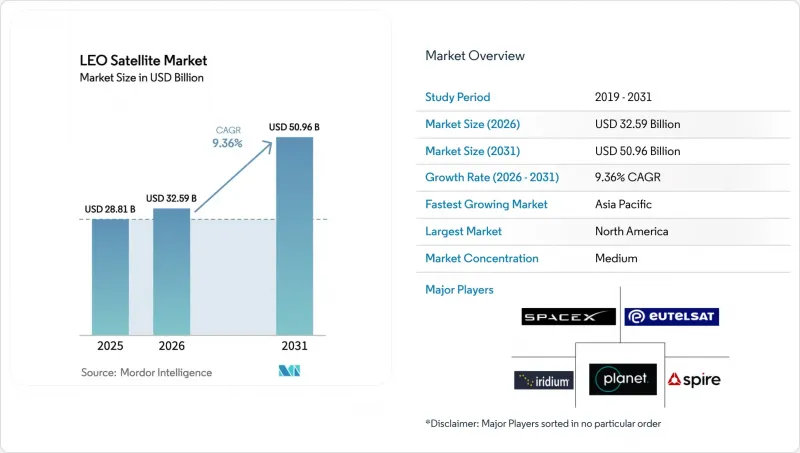
LEO 위성 시장 규모는 2025년 288억 1,000만 달러에서 2026년에는 325억 9,000만 달러로 확대되어 2026년부터 2031년까지 CAGR 9.36%로 성장을 지속하여, 2031년까지 509억 6,000만 달러에 이를 것으로 예측됩니다.
Constellation Broadband의 견조한 가입자 증가, 우주선 증설에 의존하는 새로운 방위 프로그램, 그리고 발사 비용의 감소가 주요 성장 동력이 되고 있습니다. 수직계열화 사업자들이 대중 시장용 통신 서비스로 수익화가 가능하다는 것을 입증하면서 경쟁이 심화되고 있으며, 이는 가격 하락을 촉진하고 보급을 가속화하고 있습니다. 궤도상 쓰레기에 대한 규제가 강화되고 있지만, 한편으로는 지속가능한 플랫폼과 궤도상 서비스에 대한 수요를 창출하고 있습니다. 공급망 현지화 및 적층 가공 기술로 인해 사이클 타임이 더욱 단축되어 신규 업체 시장 진입이 가속화되고 있으며, LEO 위성 시장 전체에서 수익원이 다양화되고 있습니다.
세계 LEO 위성 시장 동향과 인사이트
세계 광대역 연결에 대한 수요 증가
Constellation 사업자는 저지연 위성 인터넷이 지역 커뮤니티와 모바일 플랫폼에서 100Mbps 이상의 속도를 구현할 수 있음을 입증했습니다. 이러한 성공으로 해상, 항공 및 비상 대응 기관의 인프라 계획이 재구성되고 있습니다. 이는 지상 통신의 커버리지를 넘어서서 운용할 수 있게 되었기 때문입니다. 새롭게 확정된 3GPP의 비지상파 네트워크 사양을 통해 이동통신 사업자는 위성을 5G 코어에 통합하여 고가의 기지국을 설치하지 않고도 사용자당 수익을 확대할 수 있습니다. 휴대폰 제조업체들이 위성 메시징 기능을 사전 탑재함에 따라 그동안 위성 기기를 외면했던 소비자층에서도 보급이 가속화되고 있습니다. 각국 정부는 브로드밴드를 보편적 서비스 의무로 규정하는 디지털 포용성 프로그램의 일환으로 이를 지원하고 있습니다. 이러한 요인들이 복합적으로 작용하여 LEO 위성 시장 전체에서 대상 수요가 확대되고 서비스 보급률이 향상되고 있습니다.
내결함성 SATCOM에 대한 정부 및 방위비 지출 급증
군사 계획 담당자들은 LEO 계층이 분산되면 단일 우주선이 중요한 노드가 될 수 없기 때문에 생존성이 향상된다는 것을 알고 있습니다. 미국 우주개발국(SDA)의 트랜치 계약에 따라 기존 GEO 플랫폼보다 훨씬 낮은 단가로 안전한 통신 및 미사일 경보 네트워크를 위한 수백 개의 소형 위성이 도입되고 있습니다. 유럽 각국 정부는 자율적인 연결성을 확보하면서 국내 산업을 활성화하기 위해 EMISSARY, IRIS2와 같은 병행 프로그램에 자금을 지원하고 있습니다. 신속한 조달 모델에서는 몇 년마다 갱신할 수 있는 상용 버스(기판)를 선호하여 지속적인 생산 주문을 촉진하고 있습니다. 동맹국 간 상호 운용 가능한 페이로드의 표준이 통일됨에 따라 국경을 초월한 별자리 공유는 점점 더 활발해지고 있습니다. 이로 인한 지출 사이클은 LEO 위성 시장 전체 제조업체에 단기적인 호재로 작용할 것입니다.
높아지는 우주 파편 충돌 위험과 엄격해지는 폐기 규정
운영 중인 위성은 주요 고도대에 구형 우주선, 로켓 본체 잔해 및 파편이 쌓일수록 더 많은 물체를 피해야 합니다. 개정된 ITU 및 각국의 가이드라인에 따라 임무 종료 후 폐기 기한이 단축되어 사업자는 확실한 궤도 이탈을 위해 충분한 추진력을 탑재해야 합니다. 이러한 규제 대응은 질량과 비용을 증가시켜 페이로드의 수익률을 압박할 수 있습니다. 규제 당국은 부실 우주선에 대한 금전적 벌칙을 마련하고 있으며, 자본이 부족한 벤처기업에 대한 재정적 위험이 증가하고 있습니다. 보험료율은 충돌확률의 상승이 보험계리모델에 반영되어 이미 상승 추세에 있습니다. 드래그세일, 자율적 파편 포집과 같은 대응 기술은 아직 초기 단계에 있기 때문에 단기적으로 저궤도(LEO) 위성 시장 전체에 공급 능력의 제약이 발생할 수 있습니다.
부문 분석
2025년 기준, 통신 서비스는 LEO 위성 시장 점유율의 57.1%를 차지하며, 기술 실증에서 대중용 광대역으로의 상업적 전환을 입증했습니다. 가입자 수는 200만 가구를 넘어섰으며, 광섬유 수준의 저지연 통신을 즐길 수 있는 크루즈선, 항공기 등도 포함됩니다. 통신 분야의 LEO 위성 시장 규모는 다궤도 로밍과 디바이스 직접 메시징이 새로운 부문을 끌어들이면서 CAGR 10.3%로 확대될 것으로 예측됩니다. 새로운 위성군 발사와 함께 경쟁이 치열해졌지만, 누적된 처리량 수요로 인해 지방 회랑의 용량은 항상 가득 차 있는 상태입니다. 규모의 경제는 발사, 우주선, 지상 소프트웨어를 통합 관리하고 신속한 서비스 업데이트를 가능하게 하는 수직통합형 사업자에게 유리합니다.
지구관측은 작물 분석, 도시 계획, 기후 규제 대응을 위한 단주기 관측 영상에 힘입어 두 번째로 많이 사용되는 분야입니다. 정부는 재난 대응을 위해 실시간 광학 및 레이더 데이터를 통합하고, 보험사는 산업 자산의 고주파 모니터링에 비용을 투자하고 있습니다. 저궤도(LEO) 항법 보조 기술은 도심의 빌딩 숲이 즐비한 '도시의 협곡'에서도 위치 정확도를 1미터 이하로 향상시킵니다. 우주과학용 페이로드와 궤도상 제조는 현재로서는 틈새 시장이지만, 양자통신과 우주 태양광 발전을 위한 시험장 역할을 하고 있습니다. 이러한 기술이 성숙해짐에 따라 LEO 위성 시장에 다양한 수익원을 가져다 줄 것입니다.
2025년에는 10-100kg 위성이 LEO 위성 시장의 47.5%를 차지했습니다. 이는 표준 큐브샛 프레임에 더 큰 태양전지 어레이, 고이득 안테나, 추진 모듈을 장착할 수 있는 '스위트 스팟'입니다. 이 클래스는 한 번에 수십 대를 동시에 발사하는 공동 발사의 이점을 누리고 있으며, 다수의 페이로드가 발사 비용을 분담하고 있습니다. 10kg 미만 카테고리는 대학과 스타트업이 하드웨어 검증을 위한 선행 미션을 수행하면서 CAGR 8.6%로 성장을 주도하고 있습니다. Pocket-Qube 플랫폼은 예산이 한정된 개발도상국에도 보급되어 참여의 폭을 넓히고 있습니다.
100-500kg의 범위는 광대역 컨스텔레이션의 고처리량 노드를 담당하며, 대형 태양열 날개가 멀티빔 위상 배열에 전력을 공급합니다. 최대 1,000kg의 버스는 광링크, 디지털 채널화 장치 및 다중 호스트 페이로드를 탑재하여 높은 발사 비용을 막대한 가입자 수에 의해 상각되는 용량과 맞바꾸고 있습니다. 1,000kg이 넘는 프로젝트는 차세대 대형 로켓을 기다리고 있습니다. 이는 Kg당 비용 절감과 페어링의 제약 완화를 약속합니다. 패널 자동 접기, 3D 프린팅을 통한 스러스터 조립, 머신비전을 통한 품질 검사는 모든 질량 등급에 걸쳐 생산 라인을 효율화하여 LEO 위성 시장에서 대량 생산의 경제성을 강화합니다.
지역별 분석
2025년 북미는 전 세계 LEO 위성 시장의 68.6%를 차지했습니다. 연방통신위원회(FCC)의 유리한 라이선스 제도, 풍부한 벤처캐피털, 그리고 플로리다, 캘리포니아, 알래스카에 구축된 발사장이 엔드투엔드 생태계를 형성하고 있습니다. 미국 정부와의 서비스 계약은 보안 광대역 및 센서 페이로드 호스팅에 대한 초기 수요를 뒷받침하고 있습니다. 캐나다는 위상 배열 안테나와 소프트웨어 정의 지상 게이트웨이를 공급하고 있어 지역적 우위를 더욱 공고히 하고 있습니다. 출시, 제조, 서비스를 통합한 비즈니스 모델이 하드웨어와 가격 책정을 계속 개선함에 따라 이 모멘텀은 지속될 것입니다.
아시아태평양이 가장 빠르게 성장하고 있으며, 2031년까지 연평균 복합 성장률(CAGR)은 9.1%로 예측됩니다. 중국의 국가 챔피언 기업들은 국가 주도의 디지털 인프라 구축 정책에 따라 주요 위성 별자리들을 개발하고 있습니다. 인도는 발사 및 주파수 할당 규제를 완화하고 위성 생산 클러스터에 민간 투자를 유치하고 있습니다. 일본은 민간 재난구조와 국방태세를 겸비한 이중용도 연구개발에 자금을 투입하고 있으며, 한국과 호주는 지상부문 사이버 보안 및 광단말기 테스트베드를 전문으로 하고 있습니다. 위성군이 증가함에 따라 상호 간섭을 피하기 위한 주파수 대역 및 궤도 슬롯 신청에 대한 지역적 협력이 대두되고 있습니다.
유럽은 약 15%의 점유율을 차지하고 있으며, 전략적 자율성 달성을 목표로 하고 있습니다. 민관 파트너십인 IRIS2는 대륙 간 통신 경로를 확보하기 위해 위성 간 광통신 링크를 갖춘 최대 290개의 위성에 자금을 지원하고 있습니다. 각국의 기관은 녹색 추진 기술 연구를 촉진하는 '데브리제로 디자인' 보조금을 제공합니다. 아리안 6호의 첫 비행으로 유럽 고객들을 위한 발사 가격은 경쟁력 있는 수준으로 돌아갔지만, 발사 횟수는 여전히 미국보다 적은 상황입니다. 회원국 간 규제 조화는 생산 확대의 전제조건인 라이선싱 기간 단축을 목표로 하고 있습니다. 유럽은 산업 전반의 종합적인 역량을 바탕으로 LEO 위성 시장에서 지속 가능한 플랫폼 분야의 리더십을 확립할 수 있는 태세를 갖추고 있습니다.
세계 기타 지역에는 라틴아메리카, 중동 및 아프리카가 포함됩니다. 이들 지역에서는 통신 미개척 지역과 오지 산업 활동이 수요를 견인하고 있습니다. 통신사들은 저렴한 가격을 실현하기 위해 커뮤니티 게이트웨이와 종량제 데이터 모델을 도입하고 있습니다. 브라질과 아랍에미레이트의 국가 우주 기관은 국내 인재 파이프라인을 구축하기 위해 소형 위성 프로그램에 투자하고 있습니다. 아프리카는 지상국 호스팅 수입과 광섬유의 제약을 뛰어넘는 고처리량 백홀 서비스의 혜택을 누리고 있습니다. 이러한 추세와 함께 LEO 위성 시장의 세계 전개가 확대되고 있습니다.
기타 특전:
- 엑셀 형식 시장 예측(ME) 시트
- 3개월간 애널리스트 지원
자주 묻는 질문
목차
제1장 서론
제2장 조사 방법
제3장 주요 요약 및 주요 조사 결과
제4장 주요 업계 동향
제5장 시장 구도
제6장 시장 규모와 성장 예측
제7장 경쟁 구도
제8장 시장 기회와 향후 전망
JHS 26.06.11The LEO satellite market size is expected to grow from USD 28.81 billion in 2025 to USD 32.59 billion in 2026 and is forecast to reach USD 50.96 billion by 2031 at 9.36% CAGR over 2026-2031.

Solid subscriber growth for Constellation Broadband, new defense programs that rely on proliferated spacecraft, and declining launch costs are the dominant growth catalysts. Competition is intensifying as vertically-integrated operators prove they can monetize mass-market connectivity, which pushes prices down and accelerates adoption. Regulations are tightening on orbital debris, yet they also create demand for sustainable platforms and in-orbit services. Supply-chain localization and additive manufacturing further compress cycle times, letting newcomers enter faster and diversifying revenue streams across the LEO satellite market.
Global LEO Satellite Market Trends and Insights
Rising Demand for Global Broadband Connectivity
Constellation operators have demonstrated that low-latency satellite internet can achieve speeds exceeding 100 Mbps in rural communities and on mobile platforms. This success reshapes infrastructure plans for maritime, aviation, and emergency response agencies, as they can now operate beyond terrestrial coverage. Newly finalized 3GPP non-terrestrial network specifications enable mobile carriers to integrate satellites into 5G cores, extending revenue per user without costly tower deployments. As handset makers preload satellite messaging functions, uptake accelerates among consumers who previously ignored satellite gear. Governments support the rollout as part of digital-inclusion programs that treat broadband as a universal service obligation. These forces combine to widen addressable demand and lift service penetration across the LEO satellite market.
Surge in Government and Defense Spending on Resilient SATCOM
Military planners recognize that proliferated LEO layers add survivability because no single spacecraft becomes a critical node. The US Space Development Agency's tranche contracts seed hundreds of small satellites for secure communications and missile-warning networks at a unit price far below traditional GEO platforms. European ministries fund parallel programs such as EMISSARY and IRIS2 to secure autonomous connectivity while stimulating local industry. Rapid procurement models favor commercial-off-the-shelf buses that can be refreshed every few years, driving recurrent production orders. As allied nations harmonize standards for interoperable payloads, cross-border constellation sharing gains momentum. The resulting spending cycle grants near-term tailwinds to manufacturers across the LEO satellite market.
Escalating Space-Debris Collision Risk and Stricter Disposal Rules
Active satellites must dodge more objects as legacy spacecraft, rocket bodies, and fragments populate popular altitudes. Revised ITU and national guidelines shorten post-mission disposal deadlines, requiring operators to carry sufficient propulsion for reliable deorbiting. Compliance adds mass and cost, which can erode payload margins. Regulators are drafting monetary penalties that target non-performing spacecraft, raising financial exposure for under-capitalized ventures. Insurance premiums have already trended upward because actuarial models incorporate elevated collision probabilities. Mitigation technologies, such as drag sails and autonomous debris capture, remain in the early stages; therefore, capacity constraints may arise in the short term across the LEO satellite market.
Other drivers and restraints analyzed in the detailed report include:
- Falling Launch and Manufacturing Costs Due to Reusability
- Direct-to-Device (D2D) Standards Unlocking Mass-Market Handsets
- Spectrum-Sharing Conflicts with Terrestrial 5G/6G Incumbents
For complete list of drivers and restraints, kindly check the Table Of Contents.
Segment Analysis
Communication services accounted for 57.1% of the LEO satellite market share in 2025, validating the commercial pivot from technology demonstration to mass-market broadband. Subscriber growth surpasses 2 million households, as well as cruise ships and aircraft, that enjoy fiber-like latency. The LEO satellite market size for communication is forecast to expand at a 10.3% CAGR as multi-orbital roaming and direct-to-device messaging attract new segments. Competitive intensity rises as new fleets launch, yet cumulative throughput demand keeps capacity in rural corridors sold out. Scaling factors favor vertically-integrated players that control launch, spacecraft, and ground software, enabling rapid service updates.
Earth observation is the second-largest application, boosted by rapid-revisit imagery for crop analytics, urban planning, and climate compliance. Governments integrate real-time optical and radar feeds into disaster response, while insurers pay for high-frequency monitoring of industrial assets. Navigation augmentation in LEO enhances position accuracy to sub-meter levels in urban canyons. Space-science payloads and in-orbit manufacturing occupy a niche today but provide test beds for quantum communications and space-based solar power. As these technologies mature, they will add diverse revenue streams to the LEO satellite market.
Satellites weighing 10-100 kg captured 47.5% of the LEO satellite market in 2025, a sweet spot where standard CubeSat frames can accommodate larger solar arrays, high-gain antennas, and propulsion modules. The class benefits from rideshare launches that lift dozens of units at once, distributing launch overhead across many payloads. The sub-10 kg category leads growth at an 8.6% CAGR as universities and startups fly precursor missions to validate hardware. Pocket-Qube platforms reach developing nations with modest budgets, broadening participation.
The 100-500 kg range serves high-throughput nodes in broadband constellations, as larger solar wings feed multi-beam phased arrays. Buses weighing up to 1,000 kg carry optical links, digital channelizers, and multiple hosted payloads, trading higher launch costs for capacity that amortizes over vast subscriber pools. Projects above 1,000 kg await next-generation heavy lifters, which promise lower per-kilogram cost and relaxed fairing constraints. Automated panel folding, 3-D-printed thruster assemblies, and machine-vision quality checks streamline production lines across all mass classes, reinforcing volume economics in the LEO satellite market.
The LEO Satellite Market Report is Segmented by Application (Communication, Earth Observation, Navigation, Space Science and Tech-Demo, Others), Satellite Mass (Less Than 10 Kg, 10-100 Kg, 100-500 Kg, 500-1, 000 Kg, Greater Than 1, 000 Kg), End-User (Commercial, and More), Propulsion Technology (Electric, and More), and Geography (North America, and More). The Market Forecasts are Provided in Terms of Value (USD).
Geography Analysis
North America commanded 68.6% of the global LEO satellite market in 2025. Favorable Federal Communications Commission licensing, deep venture capital pools, and established launch pads in Florida, California, and Alaska create an end-to-end ecosystem. The US government service contracts underpin early demand for secure broadband and sensor payload hosting. Canada supplies phased-array antennas and software-defined ground gateways, further anchoring regional dominance. Momentum will persist as integrated launch-manufacturing-service models continue to iterate on hardware and pricing.
The Asia-Pacific region is the fastest-growing, with a 9.1% CAGR projected through 2031. National champions in China deploy prominent constellations under a state-led digital infrastructure mandate. India liberalized launch and frequency assignment rules, drawing private investment into satellite production clusters. Japan funds dual-use research and development that aligns civil disaster relief with defense postures, while South Korea and Australia specialize in ground-segment cybersecurity and optical terminal testbeds. Regional cooperation on spectrum and orbital-slot filings emerges to avoid mutual interference as fleets multiply.
Europe holds a roughly 15% share but is intent on achieving strategic autonomy. The IRIS2 public-private partnership funds up to 290 satellites equipped with optical inter-satellite links to secure continental routing. National agencies offer zero-debris design grants that promote green propulsion research. The Ariane 6 maiden flight restored competitive launch pricing for European customers, though volume remains lower than in the United States. Regulatory harmonization across member states aims to shorten licensing cycles, a prerequisite for scaling production - collective industrial depth positions Europe for leadership in sustainable platforms within the LEO satellite market.
The rest of the world includes Latin America, the Middle East, and Africa, where unserved connectivity zones and remote industrial operations drive demand. Operators deploy community gateways and pay-as-you-go data models to address affordability. National space agencies in Brazil and the United Arab Emirates invest in small-sat programs to build domestic talent pipelines. Africa benefits from ground-station hosting revenue and high-throughput backhaul services that leapfrog fiber limitations. These dynamics collectively expand the global footprint of the LEO satellite market.
- Space Exploration Technologies Corp.
- Eutelsat S.A.
- Planet Labs PBC
- Amazon Inc.
- Airbus SE
- Lockheed Martin Corporation
- Northrop Grumman Corporation
- Surrey Satellite Technology Limited
- GomSpace A/S
- NanoAvionics (Kongsberg Gruppen ASA)
- Thales Alenia Space (Thales and Leonardo S.p.A)
- Iridium Communications Inc.
- Spire Global, Inc.
- ICEYE
- Chang Guang Satellite Technology Co., Ltd. (CGSTL)
- Satellogic Inc.
Additional Benefits:
- The market estimate (ME) sheet in Excel format
- 3 months of analyst support
TABLE OF CONTENTS
1 INTRODUCTION
- 1.1 Study Assumptions and Market Definition
- 1.2 Scope of the Study
2 RESEARCH METHODOLOGY
3 EXECUTIVE SUMMARY AND KEY FINDINGS
4 KEY INDUSTRY TRENDS
- 4.1 Satellite Mass
- 4.2 Spending on Space Programs
5 MARKET LANDSCAPE
- 5.1 Market Overview
- 5.2 Market Drivers
- 5.2.1 Rising demand for global broadband connectivity
- 5.2.2 Surge in government and defence spending on resilient SATCOM
- 5.2.3 Falling launch and manufacturing costs due to reusability
- 5.2.4 Direct-to-device (D2D) standards unlocking mass-market handsets
- 5.2.5 Proliferation of edge/AI processing reducing down-link bandwidth
- 5.2.6 Rapid build-out of optical inter-satellite-link (OISL) mesh networks
- 5.3 Market Restraints
- 5.3.1 Escalating space-debris collision risk and stricter disposal rules
- 5.3.2 Spectrum-sharing conflicts with terrestrial 5G/6G incumbents
- 5.3.3 High terminal cost hindering adoption in low-income regions
- 5.3.4 Talent and specialized-component supply-chain shortages
- 5.4 Value Chain Analysis
- 5.5 Regulatory Landscape
- 5.6 Technological Outlook
- 5.7 Porter's Five Forces Analysis
- 5.7.1 Bargaining Power of Suppliers
- 5.7.2 Bargaining Power of Buyers
- 5.7.3 Threat of New Entrants
- 5.7.4 Threat of Substitutes
- 5.7.5 Intensity of Competitive Rivalry
6 MARKET SIZE AND GROWTH FORECASTS (VALUE)
- 6.1 By Application
- 6.1.1 Communication
- 6.1.2 Earth Observation
- 6.1.3 Navigation
- 6.1.4 Space Science and Tech-Demo
- 6.1.5 Others
- 6.2 By Satellite Mass
- 6.2.1 Less than 10 kg
- 6.2.2 10-100 kg
- 6.2.3 100-500 kg
- 6.2.4 500-1,000 kg
- 6.2.5 Greater than 1,000 kg
- 6.3 By End-User
- 6.3.1 Commercial
- 6.3.2 Government and Military
- 6.3.3 Other
- 6.4 By Propulsion Technology
- 6.4.1 Electric
- 6.4.2 Gas Based
- 6.4.3 Liquid Fuel
- 6.5 By Geography
- 6.5.1 North America
- 6.5.1.1 United States
- 6.5.1.2 Canada
- 6.5.2 Asia-Pacific
- 6.5.2.1 China
- 6.5.2.2 India
- 6.5.2.3 Japan
- 6.5.2.4 South Korea
- 6.5.2.5 Rest of the Asia-Pacific
- 6.5.3 Europe
- 6.5.3.1 France
- 6.5.3.2 Germany
- 6.5.3.3 United Kingdom
- 6.5.3.4 Rest of Europe
- 6.5.4 Rest of the World
- 6.5.4.1 Saudi Arabia
- 6.5.4.2 United Arab Emirates
- 6.5.4.3 Rest of the World
- 6.5.1 North America
7 COMPETITIVE LANDSCAPE
- 7.1 Market Concentration
- 7.2 Strategic Moves
- 7.3 Market Share Analysis
- 7.4 Company Profiles (includes Global Overview, Market Level Overview, Core Segments, Financials as Available, Strategic Information, Market Rank/Share for Key Companies, Products and Services, and Recent Developments)
- 7.4.1 Space Exploration Technologies Corp.
- 7.4.2 Eutelsat S.A.
- 7.4.3 Planet Labs PBC
- 7.4.4 Amazon Inc.
- 7.4.5 Airbus SE
- 7.4.6 Lockheed Martin Corporation
- 7.4.7 Northrop Grumman Corporation
- 7.4.8 Surrey Satellite Technology Limited
- 7.4.9 GomSpace A/S
- 7.4.10 NanoAvionics (Kongsberg Gruppen ASA)
- 7.4.11 Thales Alenia Space (Thales and Leonardo S.p.A)
- 7.4.12 Iridium Communications Inc.
- 7.4.13 Spire Global, Inc.
- 7.4.14 ICEYE
- 7.4.15 Chang Guang Satellite Technology Co., Ltd. (CGSTL)
- 7.4.16 Satellogic Inc.
8 MARKET OPPORTUNITIES AND FUTURE OUTLOOK
- 8.1 White-space and Unmet-need Assessment
