
|
시장보고서
상품코드
2072955
탄소 인식 애플리케이션 개발 플랫폼 시장 : 점유율 분석, 업계 동향과 통계, 성장 예측(2026-2031년)Carbon-Aware Application Development Platform - Market Share Analysis, Industry Trends & Statistics, Growth Forecasts (2026 - 2031) |
||||||
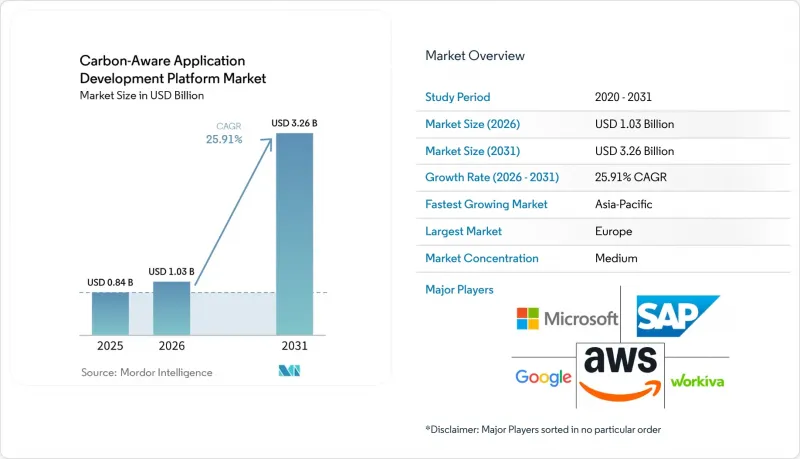
Mordor Intelligence에 의하면, 탄소 인식 애플리케이션 개발 플랫폼 시장 규모는 2025년에 8억 4,000만 달러, 2026년에 10억 3,000만 달러되어, 2031년까지 32억 6,000만 달러에 이를 것으로 예측되며, 2026년부터 2031년까지 CAGR 25.9%로 성장할 전망입니다.

본 보고서는 구성 요소(플랫폼 및 서비스), 도입 형태(클라우드, On-Premise, 하이브리드), 기업 규모(대기업, 중소기업), 용도(탄소 인식 개발 및 SDLC 관리 등), 최종 이용 산업(IT 및 통신, BFSI 등) 및 지역별로 분류되어 있습니다. 시장 전망은 금액(달러) 기준으로 제시되어 있습니다.
전 세계 탄소 인식 애플리케이션 개발 플랫폼 시장 동향 및 인사이트
탄소 배출을 최적화한 소프트웨어 운영에 대한 기업 수요 증가
탄소 배출을 최적화한 소프트웨어 운영에 대한 기업 수요가 증가하고 있습니다. 이는 지속가능성 목표가 더 이상 단순한 기업 메시지에 그치지 않고, 예산 및 운영상의 의사결정에도 영향을 미치게 되었기 때문입니다. FinOps Foundation의 보고서에 따르면, 2025년에는 유럽의 FinOps 사례 중 53%가 클라우드 탄소 지표를 보고하고 있으며, 이는 전년 대비 18포인트 증가한 수치인 반면, 북미는 29%에 그치고 있습니다. 이러한 격차는 탄소 인식 애플리케이션 개발 플랫폼 시장공급업체들에게 탄소 추적을 클라우드 관리의 표준 요소로 만드는 도구를 판매할 수 있는 분명한 기회가 되고 있습니다. 또한 기업들은 탄소 감축을 고려한 일정 수립을 통해, 단순히 비용 절감을 목적으로 한 효율화 프로그램만으로는 반드시 파악할 수 없는 유휴 용량이나 낭비를 밝혀낼 수 있다는 점도 인식하고 있습니다. ISO/IEC 21031:2024 '소프트웨어의 탄소 강도' 사양은 소프트웨어 배출량과 관련된 노력을 재현 가능하고 감사 가능한 점수로 변환하는 공식적인 방법을 구매자에게 제공함으로써, 재무 부서 및 법무 부서의 사내 승인을 용이하게 했습니다.
규제를 통한 감사 가능한 디지털 지속가능성 관리의 촉진
EU의 CSRD(기후 관련 재무 정보 공시 규정)에 따른 첫 번째 의무 보고 단계는 2025년에 대규모 상장 기업에 적용되었으며, ESRS E1에 기반한 온실가스 공시 및 제3자 보증이 요구되었습니다. 또한, 미국 증권거래위원회(SEC)도 2024년 3월에 기후 관련 정보 공시 규정을 채택하여, 2025년에 "대규모 가속 공시 기업(Large Accelerated Filers)"부터 시작하여, 상장기업을 대상으로 스코프 1 및 스코프 2에 대한 단계적 보고를 의무화했습니다. 이러한 규정에서는 소프트웨어 수준의 탄소 집약도 데이터 공개를 명시적으로 의무화하고 있지는 않지만, 감사인이 보고된 배출량 수치를 입증하기 위해 워크로드 수준의 증거를 요구하는 사례가 늘고 있습니다. 이러한 수요 증가에 따라, 탄소 인식 도구의 위상은 단순한 ESG에 대한 자발적 투자에서 기업이 보고한 수치를 정당화하기 위한 관리 수단으로 변화하고 있습니다. 탄소 인식 애플리케이션 개발 플랫폼 시장은 이러한 변화의 혜택을 누리고 있습니다. 왜냐하면 추적 가능한 데이터 수집, 보고 논리 및 증거의 이력이 조달 결정에 있어 점점 더 중요해지고 있기 때문입니다.
탄소 데이터 제공업체 간의 표준화 지연
탄소 데이터 제공업체 간의 표준화 부족은 탄소 인식 애플리케이션 개발 플랫폼 시장에서 여전히 가장 두드러진 장벽 중 하나입니다. Electricity Maps는 2025년 1월, 전 세계 65개 전력망에서 평균 흐름 추적 배출 계수와 한계 배출 계수 간의 통계적 상관관계가 극히 낮다는 사실을 보고했습니다. 이는 특정 신호에 대해 최적화된 워크로드가 다른 신호로 평가될 경우 성능이 저하될 가능성이 있음을 의미합니다. SCI 프레임워크는 소프트웨어 팀에 탄소 강도를 산출할 수 있는 수단을 제공했으나, 단일 전력망 배출량 지표를 규정하지 않았기 때문에 기업들은 사례별로 조사 방법을 결정할 수밖에 없었습니다. 규제 당국이나 표준화 기구가 그 격차를 해소할 때까지, 구매자는 감사 요건을 충족하기 위해 나중에 데이터 모델, 제어 체계 및 통합을 재구축해야 할 위험에 직면하게 될 것입니다.
부문별 분석
2025년, 플랫폼은 탄소 인식 애플리케이션 개발 플랫폼 시장에서 72.1%의 점유율을 차지하며, 부품 구성에서 수익의 주축이 되었습니다. 이 지표는 Carbon Aware 개발의 기반 계층을 구성하는 측정 엔진, 배출량 API, SCI 점수 산정 도구 및 CI/CD 보고서 플러그인에 대한 기업의 지출을 반영합니다. 도입이 가장 활발한 곳은 이미 온실가스 기준선 인벤토리를 완료했으며, 현재는 일상적인 활용을 위한 개발자용 도구가 필요한 기술 및 금융 서비스 기업들입니다. Green Software Foundation이 관리하는 "Carbon Aware SDK"는 상용 벤더들이 기업용 서비스를 제공하기 위해 패키지화한 통합 인터페이스의 폭을 보여줍니다.
서비스 분야는 2031년까지 연평균 성장률(CAGR) 26.5%를 나타낼 것으로 예측되며, 탄소 인식 애플리케이션 개발 플랫폼 시장에서 가장 빠르게 성장하는 구성 요소가 될 전망입니다. 이러한 경향은 사내의 탄소 관련 도구 활용 역량이 정착되기 전에 자문, 도입 및 관리형 운영이 급속히 확대되는 기업에서 흔히 볼 수 있는 구매 패턴을 반영하고 있습니다. 기업들은 여전히 범위 설정, 활동 데이터 매핑, 소프트웨어 제공 시스템과의 연동, 그리고 감사 시에 활용 가능한 보고서 관리 기능 구축에 있어 지원이 필요합니다. 플랫폼의 수익과 서비스 성장 간의 균형을 살펴보면, 소프트웨어만으로는 불충분하며, 탄소 인식 애플리케이션 개발 플랫폼 시장의 전반적인 채택이 확대됨에 따라 실행 지원의 중요성은 앞으로도 지속될 것으로 보입니다.
2025년, 클라우드는 탄소 인식 애플리케이션 개발 플랫폼 시장의 67.3%를 차지하며, 압도적인 차이로 주요 도입 모델이 되었습니다. 이러한 우위는 전력망의 탄소 강도 피드, 대시보드, 스케줄러와의 통합 등 가장 실용성이 높은 탄소 관련 정보에 대해 퍼블릭 클라우드 환경에서 가장 쉽게 접근할 수 있다는 사실에서 비롯됩니다. Microsoft Azure Carbon Optimization, AWS Sustainability Console 및 Google의 탄소 지능형 컴퓨팅 도구는 모두 엔지니어링 팀이 이미 워크로드를 관리하고 있는 곳 근처에 탄소 데이터를 배치하고 있습니다. 이러한 근접성 덕분에 팀은 배출량 및 비용 데이터를 동일한 운영 맥락에서 확인할 수 있으므로, 도입 장벽이 낮아집니다.
하이브리드 환경은 2031년까지 연평균 성장률(CAGR) 26.9%로 확대될 것으로 예상되며, 가장 빠르게 성장하는 도입 모델이 될 전망입니다. 은행, 유틸리티, 정부 등 규제 대상 부문에서는 여전히 주요 워크로드를 On-Premise에서 실행하고 있으며, 사설 인프라와 공용 인프라를 모두 아우르는 단일 보고 뷰가 필요합니다. 이러한 요구에 따라 구매자들은 기존 컴퓨팅 환경, 새로운 AI 환경, 클라우드 네이티브 텔레메트리 간을 연결하는 아키텍처로 눈을 돌리고 있습니다. On-Premise는 여전히 가장 작은 부문이지만, 직접적인 탄소 감사 의무나 컴퓨팅 주권 규정의 적용을 받는 기업들이 사내 AI 역량을 구축하는 데 있어 여전히 중요한 위치를 차지하고 있습니다.
지역별 분석
2025년, 유럽은 34.9%의 점유율을 차지하며 탄소 인식 애플리케이션 개발 플랫폼 시장에서 가장 큰 기여를 한 지역이 되었습니다. 해당 지역은 CSRD 및 ESRS E1 요건을 중심으로 구축된 견고한 보고 체계의 혜택을 누리고 있습니다. 이러한 규칙 덕분에 대상 기업의 온실가스 공시는 더욱 상세해지고 감사하기 쉬워졌으며, 업무량 수준의 증거와 추적 가능한 보고 논리의 가치가 높아졌습니다. 또한, 독일은 2025년의 "그린 코딩" 워크숍 시리즈를 통해 개발자들의 역량 향상을 지원했습니다. 그 후, 그린 소프트웨어 재단은 SCI 프레임워크를 CSRD의 지원 요구 사항에 맞추어 조정함으로써, 조달 팀에 소프트웨어 공학 실무와 공식 보고 요건 간의 명확한 가교 역할을 제공했습니다.
북미가 탄소 인식 애플리케이션 개발 플랫폼 시장 지역에서 두 번째로 큰 점유율을 차지한 이유는 해당 지역이 강력한 AI 인프라에 대한 투자와 활발한 기후 변화 정보 공개 환경을 모두 갖추고 있기 때문입니다. 미국 증권거래위원회(SEC)의 단계적 공시 체계로 인해 더 신뢰할 수 있는 배출량 증빙 자료에 대한 필요성이 높아진 반면, 대형 기술 기업과 금융 서비스 기업들은 이미 탄소 배출을 고려한 도구를 운영할 수 있는 규모를 갖추고 있었습니다. 캐나다와 멕시코는 여전히 초기 단계 시장이지만, 미국 기업들과공급업체 제휴를 통해 도입 기반이 확대되고 있습니다. 브라질을 필두로 한 남미 지역은 여전히 규모는 작지만, 공급망의 탈탄소화와 보고 의무의 중요성이 커짐에 따라 초기 수요가 점차 나타나고 있습니다.
아시아태평양은 2031년까지 연평균 성장률(CAGR) 27.9%를 기록하며 성장할 것으로 예상되며, 가장 빠르게 성장하는 지역이 될 전망입니다. 일본이 주요 성장 거점으로 자리매김한 것은 경제산업성(METI)이 2025년 6월에 처음으로 “Watt-Bit Collaboration”보고서를 공개한 데 더해, 개정된 에너지절약법의 체계가 2026년부터 해당 데이터센터에 적용되기 시작하기 때문입니다. 중국도 2025년 8월, 클라우드 서비스 고객을 대상으로 한 탄소 배출량 산정에 관한 기술 기준을 마련하고, 산정 및 공시를 위한 국내 모델을 확립함으로써 더욱 탄력을 받고 있습니다. 중동 및 아프리카는 여전히 초기 단계 시장이지만, 탄소 중립을 향한 노력과 투자자 주도형 ESG 요건이 디지털 인프라 조달에 영향을 미치기 시작함에 따라 장기적인 잠재력은 점차 커지고 있습니다.
기타 혜택:
- 엑셀 형식 시장 예측(ME) 시트
- 3개월간의 애널리스트 지원
자주 묻는 질문
목차
제1장 서론
제2장 조사 방법
제3장 주요 요약
제4장 시장 구도
제5장 시장 규모와 성장 예측
제6장 경쟁 구도
제7장 시장 기회와 향후 전망
JHS 26.07.03According to Mordor Intelligence, the carbon-Aware application development platform market size is projected to be USD 0.84 billion in 2025, USD 1.03 billion in 2026, and reach USD 3.26 billion by 2031, growing at a CAGR of 25.9% from 2026 to 2031.
This report is Segmented by Component (Platform and Services), Deployment Mode (Cloud, On-Premises, and Hybrid), Enterprise Size (Large Enterprises, and Small and Medium Enterprises), Application (Carbon-Aware Development and SDLC Management, and More), End-Use Industry (IT and Telecom, BFSI, and More), and Geography. The Market Forecasts are Provided in Terms of Value (USD).
Global Carbon-Aware Application Development Platform Market Trends and Insights
Rising Enterprise Demand for Carbon-Optimized Software Execution
Enterprise demand for carbon-optimized software execution is rising because sustainability targets now affect budgets and operating decisions, not just corporate messaging. The FinOps Foundation reported that 53% of European FinOps practices were reporting cloud carbon metrics in 2025, up 18 percentage points year over year, while North America remained at 29%. That gap gives vendors in the Carbon-Aware Application Development Platform Market a clear opening to sell tools that turn carbon tracking into a standard part of cloud management. Enterprises are also finding that carbon-aware scheduling can expose idle capacity and waste that cost-only rightsizing programs do not always catch. The ISO/IEC 21031:2024 Software Carbon Intensity specification provided buyers with a formal way to convert software emissions work into repeatable, auditable scores, making internal approval easier for finance and legal teams.
Regulatory Push for Auditable Digital Sustainability Controls
The first mandatory reporting phase of the EU CSRD applied in 2025 to large listed companies and required greenhouse gas disclosure under ESRS E1 with third-party assurance. The U.S. Securities and Exchange Commission also adopted climate disclosure rules in March 2024 with phased Scope 1 and Scope 2 reporting for public companies beginning with Large Accelerated Filers in 2025. Even though these rules do not expressly require software-level carbon-intensity data, auditors are increasingly requesting workload-level evidence to support reported emissions values. That demand shifts carbon-aware tooling from a voluntary ESG purchase into a control layer that helps enterprises defend reported numbers. The Carbon-Aware Application Development Platform Market is benefiting from that shift, as traceable data collection, reporting logic, and evidence trails are becoming increasingly important in procurement decisions.
Limited Standardization Across Carbon Data Providers
Limited standardization across carbon data providers remains one of the clearest barriers in the Carbon-Aware Application Development Platform Market. Electricity Maps reported in January 2025 that average flow-traced and marginal emissions factors showed very low statistical correlation across 65 global grids. That means a workload optimized for one signal can perform worse when evaluated under another. The SCI framework provided software teams with a way to calculate carbon intensity, but it did not prescribe a single grid emissions signal, leaving enterprises to decide on methodology on a case-by-case basis. Until regulators or standards bodies close that gap, buyers face the risk of having to rework data models, controls, and integrations later to meet audit expectations.
Other drivers and restraints analyzed in the detailed report include:
- Growth of AI and High-Density Compute Workloads
- FinOps and GreenOps Convergence in Cloud Operations
- High Integration Complexity with Legacy DevOps and Cloud Stacks
For complete list of drivers and restraints, kindly check the Table Of Contents.
Segment Analysis
Platform held a 72.1% share of the Carbon-Aware Application Development Platform Market in 2025, making it the revenue anchor for the component mix. That lead reflects enterprise spending on measurement engines, emissions APIs, SCI scoring tools, and CI/CD reporting plugins that form the base layer for carbon-aware development. Adoption has moved furthest in technology and financial services organizations that have already completed baseline greenhouse gas inventories and now need developer tooling for routine use. The Carbon Aware SDK, maintained by the Green Software Foundation, shows the breadth of the integration surface that commercial vendors are packaging for enterprise deployment.
Services are forecast to grow at a 26.5% CAGR through 2031, making it the fastest-growing component of the Carbon-Aware Application Development Platform Market. That pattern reflects a familiar enterprise buying path where advisory, implementation, and managed operations rise quickly before in-house carbon tooling skills become common. Enterprises still need help setting boundaries, mapping activity data, connecting software delivery systems, and building reporting controls that stand up in audit settings. The balance between platform revenue and services growth suggests that software alone is not enough, and that execution support will remain important as adoption broadens across the Carbon-Aware Application Development Platform Market.
Cloud held 67.3% of the Carbon-Aware Application Development Platform market in 2025, making it the dominant deployment model by a wide margin. The lead came from the fact that the most usable carbon signals, such as grid carbon intensity feeds, dashboards, and scheduler integrations, are easiest to access in public cloud environments. Microsoft Azure Carbon Optimization, the AWS Sustainability Console, and Google's carbon-intelligent computing tools all place carbon data close to where engineering teams already manage workloads. That proximity lowers adoption friction because teams can view emissions and cost data in the same operating context.
Hybrid is projected to expand at a 26.9% CAGR through 2031, making it the fastest-growing deployment mode. Regulated sectors such as banking, utilities, and government still run major workloads on-premises and need a single reporting view across both private and public infrastructure. That need is pushing buyers toward architectures that bridge legacy compute, new AI environments, and cloud-native telemetry. On-premises remains the smallest segment, but it remains relevant for enterprises that build private AI capacity under direct carbon audit obligations or compute sovereignty rules.
Complete Report Scope:
- By Component
- Platform
- Services
- By Deployment Mode
- Cloud
- On-Premises
- Hybrid
- By Enterprise Size
- Large Enterprises
- Small and Medium Enterprises
- By Application
- Carbon-Aware Development and SDLC Management
- Carbon-Aware Workload Optimization
- Carbon Measurement, Monitoring and Forecasting
- Governance, Reporting and Compliance
- Decision Intelligence and Automation
- By End-Use Industry
- IT and Telecom
- BFSI
- Industrial Manufacturing
- Energy and Utilities
- Oil and Gas
- Retail and E-Commerce
- Food and Beverage Manufacturing
- Transportation and Logistics
- Construction and Infrastructure
- Government and Public Sector
- Other End-User Industries
- By Geography
- North America
- United States
- Canada
- Mexico
- South America
- Brazil
- Rest of South America
- Europe
- Germany
- United Kingdom
- France
- Italy
- Spain
- Russia
- Rest of Europe
- Asia-Pacific
- China
- India
- Japan
- South Korea
- Australia
- Rest of Asia-Pacific
- Middle East
- Turkey
- Saudi Arabia
- United Arab Emirates
- Rest of Middle East
- Africa
- South Africa
- Nigeria
- Rest of Africa
- North America
Geography Analysis
Europe held a 34.9% share in 2025, making it the largest regional contributor to the Carbon-Aware Application Development Platform Market. The region benefits from a strong reporting framework built around the CSRD and ESRS E1 requirements. Those rules made greenhouse gas disclosure more detailed and more auditable for in-scope companies, which raised the value of workload-level evidence and traceable reporting logic. Germany also supported developer capacity building through its 2025 Green Coding workshop series. The Green Software Foundation later mapped the SCI framework to CSRD support needs, providing procurement teams with a clearer bridge between software engineering practices and formal reporting expectations.
North America held the second-largest share in the Carbon-Aware Application Development Platform Market because the region combines strong AI infrastructure investment with an active climate disclosure environment. The U.S. Securities and Exchange Commission's phased disclosure framework increased the need for better emissions evidence, while large technology and financial services firms already had the scale to operationalize carbon-aware tooling. Canada and Mexico remain earlier-stage markets, but supplier linkages with U.S. enterprises are widening the adoption base. South America, led by Brazil, is still smaller, yet early demand is emerging as supply chain decarbonization and reporting obligations become more important.
Asia-Pacific is forecast to grow at a 27.9% CAGR through 2031, making it the fastest-growing region. Japan is a major growth center because METI published the first Watt-Bit Collaboration report in June 2025, and the country's updated Energy Conservation Act framework will begin applying to qualifying data centers in 2026. China also added momentum through its August 2025 technical standard for cloud service customer carbon emission accounting, which created a domestic model for calculation and disclosure. The Middle East and Africa remain early-stage markets, but long-term potential is improving as net-zero commitments and investor-led ESG requirements begin to shape digital infrastructure procurement.
- Electricity Maps ApS
- WattTime, Inc.
- Normative.io Ltd
- Cycloid SAS
- Workiva Inc.
- SAP SE
- Microsoft Corporation
- Amazon Web Services, Inc.
- Google LLC
- IBM Corporation
- Salesforce, Inc.
- ServiceNow, Inc.
- Oracle Corporation
- Schneider Electric SE
- ENGIE SA
- Siemens AG
- Dassault Systemes SE
- Accenture plc
- Capgemini SE
- HCL Technologies Limited
- Tata Consultancy Services Limited
Additional Benefits:
- The market estimate (ME) sheet in Excel format
- 3 months of analyst support
TABLE OF CONTENTS
1 INTRODUCTION
- 1.1 Study Assumptions and Market Definition
- 1.2 Scope of the Study
2 RESEARCH METHODOLOGY
3 EXECUTIVE SUMMARY
4 MARKET LANDSCAPE
- 4.1 Market Overview
- 4.2 Market Drivers
- 4.2.1 Rising Enterprise Demand for Carbon-Optimized Software Execution
- 4.2.2 Regulatory Push for Auditable Digital Sustainability Controls
- 4.2.3 Growth of AI and High-Density Compute Workloads
- 4.2.4 FinOps and GreenOps Convergence in Cloud Operations
- 4.2.5 Shift Toward Real-Time Carbon Intensity APIs and Scheduling
- 4.2.6 Expansion of ESG-Linked Procurement and Product Development Standards
- 4.3 Market Restraints
- 4.3.1 Limited Standardization Across Carbon Data Providers
- 4.3.2 High Integration Complexity With Legacy DevOps and Cloud Stacks
- 4.3.3 Data Quality Gaps in Workload-Level Emissions Measurement
- 4.3.4 Budget Scrutiny for Non-Core Sustainability Software Spend
- 4.4 Industry Value-Chain Analysis
- 4.5 Regulatory Landscape
- 4.6 Technological Outlook
- 4.7 Impact of Macroeconomic Factors on the Market
- 4.8 Porter's Five Forces Analysis
- 4.8.1 Bargaining Power of Buyers
- 4.8.2 Bargaining Power of Suppliers
- 4.8.3 Threat of New Entrants
- 4.8.4 Threat of Substitutes
- 4.8.5 Intensity of Competitive Rivalry
5 MARKET SIZE AND GROWTH FORECASTS (VALUE)
- 5.1 By Component
- 5.1.1 Platform
- 5.1.2 Services
- 5.2 By Deployment Mode
- 5.2.1 Cloud
- 5.2.2 On-Premises
- 5.2.3 Hybrid
- 5.3 By Enterprise Size
- 5.3.1 Large Enterprises
- 5.3.2 Small and Medium Enterprises
- 5.4 By Application
- 5.4.1 Carbon-Aware Development and SDLC Management
- 5.4.2 Carbon-Aware Workload Optimization
- 5.4.3 Carbon Measurement, Monitoring and Forecasting
- 5.4.4 Governance, Reporting and Compliance
- 5.4.5 Decision Intelligence and Automation
- 5.5 By End-Use Industry
- 5.5.1 IT and Telecom
- 5.5.2 BFSI
- 5.5.3 Industrial Manufacturing
- 5.5.4 Energy and Utilities
- 5.5.5 Oil and Gas
- 5.5.6 Retail and E-Commerce
- 5.5.7 Food and Beverage Manufacturing
- 5.5.8 Transportation and Logistics
- 5.5.9 Construction and Infrastructure
- 5.5.10 Government and Public Sector
- 5.5.11 Other End-User Industries
- 5.6 By Geography
- 5.6.1 North America
- 5.6.1.1 United States
- 5.6.1.2 Canada
- 5.6.1.3 Mexico
- 5.6.2 South America
- 5.6.2.1 Brazil
- 5.6.2.2 Rest of South America
- 5.6.3 Europe
- 5.6.3.1 Germany
- 5.6.3.2 United Kingdom
- 5.6.3.3 France
- 5.6.3.4 Italy
- 5.6.3.5 Spain
- 5.6.3.6 Russia
- 5.6.3.7 Rest of Europe
- 5.6.4 Asia-Pacific
- 5.6.4.1 China
- 5.6.4.2 India
- 5.6.4.3 Japan
- 5.6.4.4 South Korea
- 5.6.4.5 Australia
- 5.6.4.6 Rest of Asia-Pacific
- 5.6.5 Middle East
- 5.6.5.1 Turkey
- 5.6.5.2 Saudi Arabia
- 5.6.5.3 United Arab Emirates
- 5.6.5.4 Rest of Middle East
- 5.6.6 Africa
- 5.6.6.1 South Africa
- 5.6.6.2 Nigeria
- 5.6.6.3 Rest of Africa
- 5.6.1 North America
6 COMPETITIVE LANDSCAPE
- 6.1 Market Concentration
- 6.2 Strategic Moves
- 6.3 Market Share Analysis
- 6.4 Company Profiles (includes Global Level Overview, Market Level Overview, Core Segments, Financials as available, Strategic Information, Market Rank/Share, Products and Services, Recent Developments)
- 6.4.1 Electricity Maps ApS
- 6.4.2 WattTime, Inc.
- 6.4.3 Normative.io Ltd
- 6.4.4 Cycloid SAS
- 6.4.5 Workiva Inc.
- 6.4.6 SAP SE
- 6.4.7 Microsoft Corporation
- 6.4.8 Amazon Web Services, Inc.
- 6.4.9 Google LLC
- 6.4.10 IBM Corporation
- 6.4.11 Salesforce, Inc.
- 6.4.12 ServiceNow, Inc.
- 6.4.13 Oracle Corporation
- 6.4.14 Schneider Electric SE
- 6.4.15 ENGIE SA
- 6.4.16 Siemens AG
- 6.4.17 Dassault Systemes SE
- 6.4.18 Accenture plc
- 6.4.19 Capgemini SE
- 6.4.20 HCL Technologies Limited
- 6.4.21 Tata Consultancy Services Limited
7 MARKET OPPORTUNITIES AND FUTURE OUTLOOK
- 7.1 White-Space and Unmet-Need Assessment

