

|
시장보고서
상품코드
2073382
기업용 네트워크 스위치 : 시장 점유율 분석, 업계 동향 및 통계, 성장 예측(2026-2031년)Enterprise Network Switch - Market Share Analysis, Industry Trends & Statistics, Growth Forecasts (2026 - 2031) |
||||||
 Mordor Intelligence
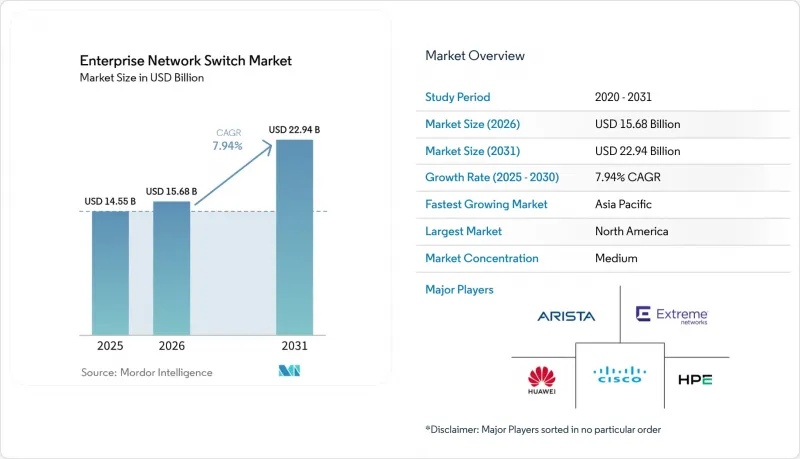
Mordor Intelligence에 의하면, 기업용 네트워크 스위치 시장 규모는 2025년에 145억 5,000만 달러로 평가되었습니다. 2026년에 156억 8,000만 달러에 달하고, 2031년까지 229억 4,000만 달러에 이를 것으로 예측되며, 2026년부터 2031년에 걸쳐 CAGR 7.94%로 성장할 전망입니다.
본 보고서는 스위치 유형(고정 구성 스위치 및 모듈형 스위치), 포트 속도(1 GbE 이하, 2.5/5GbE 멀티기가, 기타), 최종 사용자의 기업 규모(대기업 및 중소기업), 최종 사용자의 산업 분야(IT 및 통신, 은행, 금융서비스 및 보험(BFSI), 헬스케어 및 생명과학, 제조, 기타), 그리고 지역별로 분류되어 있습니다. 시장 전망은 금액(달러) 기준으로 제시되어 있습니다.
세계의 기업용 네트워크 스위치 시장 동향 및 인사이트
클라우드 데이터센터 확장이 급증하고 있습니다.
각 하이퍼스케일러 기업들은 2024년부터 2026년에 걸쳐 누적 6,900억 달러 규모의 설비 투자를 계획하고 있으며, 스위칭 인프라는 이 지출의 10% 가까이를 꾸준히 차지하고 있습니다. 통신 사업자들은 전력 공급 지연에 직면해 있어, 400 GbE 및 800 GbE 패브릭을 사용하여 랙당 대역폭을 두 배로 늘릴 수밖에 없는 상황에 놓여 있습니다. 이러한 추세는 마이크로소프트가 발표한 800억 달러 규모의 건설 수주 잔고에 의해 뒷받침되고 있습니다. 구글은 2026년 중으로 신규 가용성 구역에 네이티브 800 GbE 스위치를 도입하여 스위치 대수를 40% 줄일 계획입니다. 이에 대해 Arista Networks는 이러한 업데이트 주기를 선점하기 위해 2025년 말에 51.2 Tbps 섀시 스위치를 출시했습니다. 고밀도화에 대한 수요 증가로 인해, 전면적인 시스템 갱신(포크리프트 업그레이드) 없이도 라인 카드를 교체할 수 있는 모듈형 스위치에 대한 추가 주문이 늘어나고 있으며, 이는 모듈형 스위치의 연평균 성장률(CAGR) 상승을 뒷받침하고 있습니다.
기업 내 IoT 기기 도입 확대
2025년 말까지 산업용 센서, 의료용 원격 측정 장치, 스마트 빌딩용 컨트롤러 등 기업에서 연결된 기기의 총 수는 150억 대를 넘어섰습니다. 의료시설만 해도, 엄격한 가상 LAN(VLAN) 분리가 요구되는 10억 대 이상의 네트워크 연결형 의료기기가 가동되고 있습니다. 인더스트리 4.0 이니셔티브를 추진하는 제조업체들은 2024년에 최종 확정된 IEEE 802.1 프로파일에 따라 인증받은 TSN(Time-Sensitive Networking) 지원 스위치를 도입하기 시작했습니다. 소매 체인점이나 캠퍼스에서는 포트당 60W를 초과하는 멀티 기가 업링크가 필요한 Wi-Fi 6E 및 Wi-Fi 7 액세스 포인트를 지원하기 위해 엣지 스위치 업그레이드가 진행되고 있습니다. 이처럼 디바이스 수가 급증함에 따라 공격 대상 영역이 확대되고, 하드웨어 가속을 통한 액세스 제어 목록(ACL) 및 클라우드 관리를 통한 온보딩 기능을 갖춘 스위치에 대한 투자가 촉진되며, 이러한 촉진요인의 장기적인 영향력을 뒷받침하고 있습니다.
막대한 설비 투자가 필요합니다.
400 GbE 업링크를 갖춘 모듈형 섀시를 완전히 구성할 경우, 광 모듈을 제외하더라도 15만 달러를 초과할 수 있으며, 이 비용은 많은 중견 기업의 연간 IT 예산의 15%-25%에 해당합니다. 각 벤더사는 “Cisco Plus"이나 “HPE GreenLake"와 같은 하드웨어-어-서비스(HaaS) 모델로 이에 대응하고 있지만, 월정액 구독제라 하더라도 여전히 수년에 걸친 계약이 요구되고 있습니다. 남미 지역공급업체 대출 한도 제한과 유럽의 금융 긴축 정책으로 인해, 이러한 제약은 2028년까지 뚜렷하게 지속될 전망입니다.
부문별 분석
2025년에는 고정형 모델이 기업용 네트워크 스위치 시장에서 82.64%의 점유율을 유지했으나, 모듈형 유닛은 2031년까지 연평균 성장률(CAGR) 9.26%를 나타낼 것으로 전망됩니다. 통신 사업자들이 장비 전체를 교체하는 것보다 섀시 내 라인 카드 업그레이드를 중시함에 따라, 데이터센터 및 캠퍼스 코어 계층에서 모듈형 스위치가 기업용 네트워크 스위치 시장에서 점유율을 확대했습니다. Cisco Catalyst 9600과 같은 섀시를 활용하면, 2024년에 이를 구매한 기업은 새로운 카드를 교체하기만 해도 10 GbE에서 100 GbE로 전환할 수 있어, 자산의 수명을 연장하고 전자 폐기물을 줄일 수 있습니다. 또한, 각 하이퍼스케일러 기업들도 CLOS 패브릭 내에서 수백 대의 리프 스위치를 상호 연결하기 위해 51.2 Tbps 및 102.4 Tbps 모듈형 스파인에 의존하고 있습니다.
브랜치 계층이나 액세스 계층에서는 24포트 또는 48포트의 포트 밀도, 통합형 PoE(Power-over-Ethernet), 500달러 미만의 보급형 모델이 소규모 사이트의 경제성에 부합하기 때문에 고정형 스위치가 여전히 주류를 이루고 있습니다. Cisco Meraki, Aruba Instant On, NETGEAR Insight의 클라우드 기반 관리형 제품은 명령줄 조작의 복잡성을 해소하여 중소기업이 몇 시간 만에 네트워크를 구축할 수 있도록 해줍니다. 이러한 양극화는 구매자들의 우선순위가 서로 다르다는 점을 여실히 보여주고 있습니다. 데이터센터에는 확장성과 라인 레이트의 유연성이 요구되는 반면, 소규모 환경에서는 플러그 앤 플레이 방식의 간편성이 중시되고 있습니다.
이미 가장 빠르게 성장하고 있는 부문인 멀티기가 카테고리는 2031년까지 연평균 성장률(CAGR) 11.48%를 나타낼 것으로 예측되지만, 2025년 시점에서도 1 GbE 이하 제품이 매출의 41.72%를 차지했습니다. IEEE 802.11be 표준으로 인증된 Wi-Fi 7은 이론상 46Gbps의 처리량을 실현하여 1 GbE 업링크를 포화시키고, 2.5GbE 및 5GbE 포트에 대한 수요를 견인하고 있습니다. 시스코 시스템즈에 따르면, Catalyst 9300 출하 대수의 40%에 멀티기가 모듈이 탑재되어 있어, 기업들이 더 빠른 액세스 계층으로 전환하는 움직임이 가속화되고 있음을 알 수 있습니다.
네트워크 스택의 상위 계층에서는 서버 업그레이드와 스토리지 영역 네트워크(SAN)의 교체를 계기로, 2025년에 100 GbE 출하량이 처음으로 10 GbE를 넘어섰습니다. 400 GbE 및 초기 단계의 800 GbE는 인공지능(AI) 클러스터에서 점차 자리 잡고 있으며, 화이트박스 벤더들은 비용 절감을 위해 이러한 포트에 ‘클라우드 기반 개방형 네트워킹을 위한 소프트웨어(SON2)"를 함께 제공합니다. 따라서 액세스 계층과 코어 계층 사이에서는 기존 배선을 멀티기가비트 수준으로 업그레이드하는 추세와, 데이터 집약적 워크로드에 초고속 네트워크를 도입하는 추세라는 양극화된 시장 동향이 나타나고 있습니다.
지역별 분석
북미는 2025년에 매출의 36.44%를 차지하며, 하이퍼스케일러들이 고밀도 패브릭을 주도하고 연방 정부의 제로 트러스트 의무화로 인해 세분화 도입이 확대된 가운데, 여전히 최대 구매 지역으로 자리매김하고 있습니다. 마이크로소프트의 800억 달러 규모의 미수주 잔고는 포트 수 증가를 포트 밀도 최적화로 전환하는 데 있어 그리드 공급의 병목 현상을 여실히 드러내고 있습니다. 캐나다에서는 은행업 및 의료 분야의 세분화 프로그램을 통해 완만한 성장이 예상되지만, 많은 중견 기업의 교체 주기는 현재 6년을 초과하고 있습니다.
아시아태평양은 2031년까지 연평균 성장률(CAGR) 9.52%를 나타낼 것으로 예측되며, 이는 다른 모든 지역을 상회할 전망입니다. 인도의 국가 인프라 계획에 따라 디지털 인프라에 1조 3,000억 달러가 배정되었으며, 2선 도시에서의 메트로 이더넷 및 스마트 시티 관련 계약이 촉진되고 있습니다. 중국의 “이중 순환" 정책으로 인해 수요는 국내 공급업체로 이동하고 있지만, 첨단 ASIC에 대한 수출 규제로 인해 최첨단 반도체에 대한 접근이 제한되고 있습니다. 일본에서는 2027년까지 공장에 IP를 전면적으로 보급하는 것을 목표로 하는 ‘2025년 로드맵"가 시간 의존성이 높은 네트워크 투자를 뒷받침하고 있는 반면, 호주와 한국에서는 캐리어급 이더넷 스위치를 활용한 5G 백홀 확장이 진행되고 있습니다.
유럽에서는 에너지 비용의 급등과 거시경제의 불확실성으로 인해 장비 교체 주기가 5년에서 7년으로 길어지고 있지만, 네트워크 및 정보 보안 지침 2(NIS II)와 같은 규제 체계로 인해 은행 및 의료 분야에서는 보안을 이유로 한 장비 교체가 계속되고 있습니다. 남미, 중동 및 아프리카는 기업용 네트워크 스위치 시장에서 여전히 발전 단계에 있지만, 해당 지역 특유의 성장 요인이 존재합니다. 브라질의 즉시 결제 시스템 ‘Pix"에는 저지연 코어 스위치가 필요하며, 사우디아라비아의 “비전 2030"의 스마트시티 예산은 NEOM과 리야드에서 캠퍼스 규모의 장비 도입에 사용되고 있습니다.
기타 혜택 :
- 엑셀 형식 시장 예측(ME) 시트
- 3개월간의 애널리스트 지원
자주 묻는 질문
목차
제1장 서론
제2장 조사 방법
제3장 개요
제4장 시장 구도
제5장 시장 규모 및 성장 예측
제6장 경쟁 구도
제7장 시장 기회 및 향후 전망
KTH 26.07.08According to Mordor Intelligence, the enterprise network switch market size is expected to be USD 14.55 billion in 2025, USD 15.68 billion in 2026, and reach USD 22.94 billion by 2031, growing at a CAGR of 7.94% from 2026 to 2031.
This report is Segmented by Switch Type (Fixed Configuration Switches, and Modular Switches), Port Speed (1 GbE and Below, 2. 5/5 GbE Multi-Gig, and More), End-User Enterprise Size (Large Enterprises, and SMEs), End-User Industry (IT and Telecom, BFSI, Healthcare and Life Sciences, Manufacturing, and More), and Geography. The Market Forecasts are Provided in Terms of Value (USD).
Global Enterprise Network Switch Market Trends and Insights
Surge in Cloud Data Center Expansions
Hyperscalers booked cumulative capital expenditure of USD 690 billion across 2024-2026, and switching infrastructure consistently captures close to 10% of that outlay. Operators face grid-supply delays that push them to double bandwidth per rack unit using 400 GbE and 800 GbE fabrics, a trend underlined by Microsoft's disclosed USD 80 billion construction backlog. Google plans to install native 800 GbE switches in new availability zones during 2026 to cut switch count by 40%. Arista Networks, in turn, released 51.2 Tbps chassis switches in late 2025 to win these refresh cycles. The density imperative drives incremental orders for modular switches that allow line-card swaps without forklift upgrades, reinforcing the uptick in modular CAGR.
Increasing Enterprise Adoption of IoT Devices
Enterprise connected-device counts exceeded 15 billion units by end-2025, spanning industrial sensors, medical telemetry, and smart-building controllers. Healthcare facilities alone operate more than 1 billion networked medical devices that demand strict virtual LAN isolation. Manufacturers rolling out Industry 4.0 initiatives turned to time-sensitive networking switches certified under the IEEE 802.1 profile finalized in 2024. Retail chains and campuses are upgrading edge switches to support WiFi 6E and WiFi 7 access points that require multi-gig uplinks exceeding 60 W per port. This sprawling device footprint inflates attack surfaces, which prompts investment in switches with hardware-accelerated access-control lists and cloud-managed onboarding, fueling the driver's long-term influence.
High Capital Expenditure Requirements
A fully populated modular chassis with 400 GbE uplinks can exceed USD 150 000 before optics, a cost that translates to 15%-25% of annual information-technology budgets for many mid-market firms. Vendors are countering with hardware-as-a-service models such as Cisco Plus and HPE GreenLake, yet monthly subscriptions still force multi-year commitments. Limited vendor financing in South America and tighter monetary policy in Europe keep this restraint prominent through 2028.
Other drivers and restraints analyzed in the detailed report include:
- Migration to Higher Port Speeds (25 / 40 / 100 GbE)
- Growing Demand for Network Security Segmentation
- Semiconductor Supply Chain Constraints
For complete list of drivers and restraints, kindly check the Table Of Contents.
Segment Analysis
Fixed models kept an 82.64% enterprise network switch market share in 2025, but modular units are forecast to post a 9.26% CAGR to 2031. Modular switches captured a rising slice of the enterprise network switch market in data center and campus-core layers as operators valued in-chassis line-card upgrades over forklift replacements. Chassis such as Cisco Catalyst 9600 allow a 2024 buyer to migrate from 10 GbE to 100 GbE simply by sliding new cards, extending asset life, and curbing electronic waste. Hyperscalers also rely on 51.2 Tbps and 102.4 Tbps modular spines to interconnect hundreds of leaf switches in Clos fabrics.
Fixed switches remain dominant at the branch and access layers because 24 or 48-port density, integrated power-over-Ethernet, and sub-USD 500 entry points match small site economics. Cloud-managed variants from Cisco Meraki, Aruba Instant On, and NETGEAR Insight remove command-line complexity, letting small and medium-sized enterprises spin up networks in hours. The duality underscores divergent buyer priorities: data centers need scale and line-rate flexibility, while smaller footprints favor plug-and-play simplicity.
The multi-gig category, already the fastest-growing segment, is set for an 11.48% CAGR through 2031, while 1 GbE and below still accounted for 41.72% of revenue in 2025. WiFi 7, certified under IEEE 802.11be, delivers a theoretical throughput of 46 Gbps, saturating 1 GbE uplinks and driving demand for 2.5 GbE and 5 GbE ports. Cisco Systems reported that 40% of Catalyst 9300 shipments now include multi-gig modules, underscoring the accelerating enterprise transition toward higher-speed access layers.
Higher in the stack, 100 GbE shipments surpassed 10 GbE for the first time in 2025, propelled by server upgrades and storage-area network refreshes. 400 GbE and early 800 GbE are taking hold in artificial-intelligence clusters, and white-box vendors are bundling Software for Open Networking in the Cloud on these ports to trim cost. Between access and core layers, the market therefore features a barbell of multi-gig upgrades on existing cabling and ultra-high-speed rollouts in data-intensive workloads.
Complete Report Scope:
- By Switch Type
- Fixed Configuration Switches
- Modular Switches
- By Port Speed
- 1 GbE and Below
- 2.5/5 GbE Multi-Gig
- 10 GbE
- 25/40 GbE
- 100 GbE
- 400 GbE and Above
- By End-user Enterprise Size
- Large Enterprises
- SMEs
- By End-User Industry
- IT and Telecom
- BFSI
- Healthcare and Lifesciences
- Manufacturing
- Government and Defense
- Education
- Retail and E-commerce
- Other End-User Industries
- By Geography
- North America
- United States
- Canada
- Mexico
- South America
- Brazil
- Argentina
- Rest of South America
- Europe
- Germany
- United Kingdom
- France
- Italy
- Spain
- Russia
- Rest of Europe
- Asia-Pacific
- China
- Japan
- India
- South Korea
- Australia and New Zealand
- Rest of Asia-Pacific
- Middle East
- Saudi Arabia
- United Arab Emirates
- Turkey
- Rest of Middle East
- Africa
- South Africa
- Nigeria
- Rest of Africa
- North America
Geography Analysis
North America accounted for 36.44% revenue in 2025 and remains the largest buyer as hyperscalers push high-density fabrics and federal zero-trust mandates widen segmentation rollouts. Microsoft's USD 80 billion backlog highlights grid-supply bottlenecks that convert port-count growth into port-density optimization. Canada delivers moderate upside through banking and healthcare segmentation programs, though many mid-market refreshes now extend past six years.
Asia-Pacific is projected to register a 9.52% CAGR through 2031, outpacing all other regions. India's National Infrastructure Pipeline earmarked USD 1.3 trillion for digital infrastructure and seeded metro Ethernet and smart-city contracts in second-tier cities. China's dual-circulation policy diverts demand to domestic vendors, but advanced ASIC export restrictions constrain access to cutting-edge silicon. Japan's 2025 roadmap to achieve full Internet Protocol penetration in factories by 2027 propels time-sensitive networking investments, while Australia and South Korea expand 5G backhaul that rides on carrier-grade Ethernet switches.
Europe faces energy-cost inflation and macroeconomic uncertainty that stretches refresh cycles from 5 to 7 years, yet regulatory frameworks such as the Network and Information Security Directive 2 sustain security-driven replacements in banking and healthcare. South America and the Middle East and Africa remain nascent slices of the enterprise network switch market, but localized catalysts exist. Brazil's Pix instant-payment rails require low-latency core switches, and Saudi Arabia's Vision 2030 smart-city budgets fund campus-scale equipment in NEOM and Riyadh.
- Cisco Systems, Inc.
- Huawei Technologies Co., Ltd.
- Hewlett Packard Enterprise Company
- Arista Networks, Inc.
- Extreme Networks, Inc.
- Dell Technologies Inc.
- Nokia Corporation
- ZTE Corporation
- NETGEAR, Inc.
- TP-Link Technologies Co., Ltd.
- D-Link Corporation
- Allied Telesis Holdings K.K.
- Alcatel-Lucent Enterprise International SAS
- Edgecore Networks Corporation
- H3C Technologies Co., Ltd.
- Fortinet, Inc.
- MikroTikls SIA
- Broadcom Inc.
- Grandstream Networks, Inc.
- Ubiquiti Inc.
Additional Benefits:
- The market estimate (ME) sheet in Excel format
- 3 months of analyst support
TABLE OF CONTENTS
1 INTRODUCTON
- 1.1 Study Assumptions and Market Definition
- 1.2 Scope of the Study
2 RESEARCH METHODOLOGY
3 EXECUTVE SUMMARY
4 MARKET LANDSCAPE
- 4.1 Market Overview
- 4.2 Market Drivers
- 4.2.1 Surge in Cloud Data Center Expansions
- 4.2.2 Increasing Enterprise Adoption of IoT Devices
- 4.2.3 Migration to Higher Port Speeds (25/40/100 GbE)
- 4.2.4 Growing Demand for Network Security Segmentation
- 4.2.5 Integration of Network Telemetry and A-Driven Switch ASCs
- 4.2.6 Open-Source NOS Accelerating White-Box Switch Adoption
- 4.3 Market Restraints
- 4.3.1 High Capital Expenditure Requirements
- 4.3.2 Semiconductor Supply Chain Constraints
- 4.3.3 Flattening Enterprise Campus Refresh Cycles From W-F 7 Efficiencies
- 4.3.4 Geo-political Export Restrictions on Advanced Switch Chipsets
- 4.4 Impact of Macroeconomic Factors on the Market
- 4.5 Industry Value / Supply-Chain Analysis
- 4.6 Regulatory Landscape
- 4.7 Technological Outlook
- 4.8 Porter's Five Forces Analysis
- 4.8.1 Bargaining Power of Buyers
- 4.8.2 Bargaining Power of Suppliers
- 4.8.3 Threat of New Entrants
- 4.8.4 Threat of Substitutes
- 4.8.5 Intensity of Competitive Rivalry
5 MARKET SIZE AND GROWTH FORECASTS (VALUE)
- 5.1 By Switch Type
- 5.1.1 Fixed Configuration Switches
- 5.1.2 Modular Switches
- 5.2 By Port Speed
- 5.2.1 1 GbE and Below
- 5.2.2 2.5/5 GbE Multi-Gig
- 5.2.3 10 GbE
- 5.2.4 25/40 GbE
- 5.2.5 100 GbE
- 5.2.6 400 GbE and Above
- 5.3 By End-user Enterprise Size
- 5.3.1 Large Enterprises
- 5.3.2 SMEs
- 5.4 By End-User Industry
- 5.4.1 IT and Telecom
- 5.4.2 BFSI
- 5.4.3 Healthcare and Lifesciences
- 5.4.4 Manufacturing
- 5.4.5 Government and Defense
- 5.4.6 Education
- 5.4.7 Retail and E-commerce
- 5.4.8 Other End-User Industries
- 5.5 By Geography
- 5.5.1 North America
- 5.5.1.1 United States
- 5.5.1.2 Canada
- 5.5.1.3 Mexico
- 5.5.2 South America
- 5.5.2.1 Brazil
- 5.5.2.2 Argentina
- 5.5.2.3 Rest of South America
- 5.5.3 Europe
- 5.5.3.1 Germany
- 5.5.3.2 United Kingdom
- 5.5.3.3 France
- 5.5.3.4 Italy
- 5.5.3.5 Spain
- 5.5.3.6 Russia
- 5.5.3.7 Rest of Europe
- 5.5.4 Asia-Pacific
- 5.5.4.1 China
- 5.5.4.2 Japan
- 5.5.4.3 India
- 5.5.4.4 South Korea
- 5.5.4.5 Australia and New Zealand
- 5.5.4.6 Rest of Asia-Pacific
- 5.5.5 Middle East
- 5.5.5.1 Saudi Arabia
- 5.5.5.2 United Arab Emirates
- 5.5.5.3 Turkey
- 5.5.5.4 Rest of Middle East
- 5.5.6 Africa
- 5.5.6.1 South Africa
- 5.5.6.2 Nigeria
- 5.5.6.3 Rest of Africa
- 5.5.1 North America
6 COMPETITIVE LANDSCAPE
- 6.1 Market Concentration
- 6.2 Strategic Moves
- 6.3 Market Share Analysis
- 6.4 Company Profiles (includes Global Level Overview, Market Level Overview, Core Segments, Financials as available, Strategic Information, Market Rank/Share, Products and Services, Recent Developments)
- 6.4.1 Cisco Systems, Inc.
- 6.4.2 Huawei Technologies Co., Ltd.
- 6.4.3 Hewlett Packard Enterprise Company
- 6.4.4 Arista Networks, Inc.
- 6.4.5 Extreme Networks, Inc.
- 6.4.6 Dell Technologies Inc.
- 6.4.7 Nokia Corporation
- 6.4.8 ZTE Corporation
- 6.4.9 NETGEAR, Inc.
- 6.4.10 TP-Link Technologies Co., Ltd.
- 6.4.11 D-Link Corporation
- 6.4.12 Allied Telesis Holdings K.K.
- 6.4.13 Alcatel-Lucent Enterprise International SAS
- 6.4.14 Edgecore Networks Corporation
- 6.4.15 H3C Technologies Co., Ltd.
- 6.4.16 Fortinet, Inc.
- 6.4.17 MikroTikls SIA
- 6.4.18 Broadcom Inc.
- 6.4.19 Grandstream Networks, Inc.
- 6.4.20 Ubiquiti Inc.
7 MARKET OPPORTUNITIES AND FUTURE OUTLOOK
- 7.1 White-Space and Unmet-Need Assessment


