

|
시장보고서
상품코드
2098589
사이버 복원력 및 비즈니스 연속성 : 시장 점유율 분석, 업계 동향 및 통계, 성장 예측(2026-2031년)Cyber Resilience and Business Continuity - Market Share Analysis, Industry Trends & Statistics, Growth Forecasts (2026 - 2031) |
||||||
 Mordor Intelligence
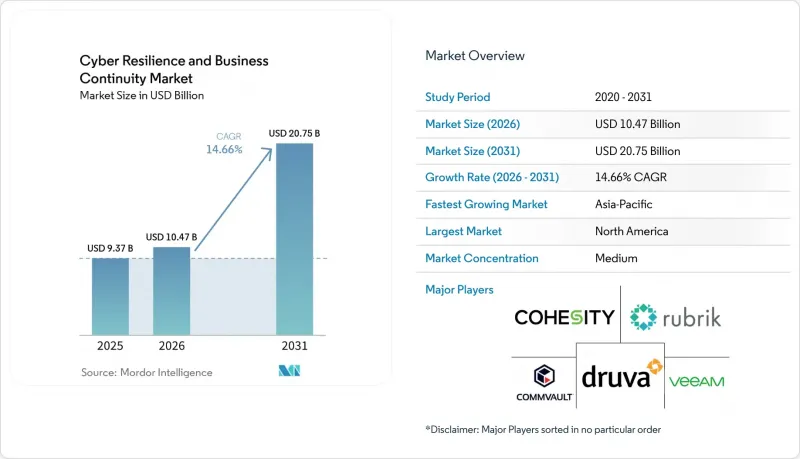
Mordor Intelligence에 의하면, 사이버 복원력 및 비즈니스 연속성 시장 규모는 2025년에 93억 7,000만 달러로 평가되었습니다. 2026년 104억 7,000만 달러, 2031년 207억 5,000만 달러에 이를 것으로 예측되며, 2026년부터 2031년에 걸쳐 CAGR 14.66%로 성장할 전망입니다.
본 보고서는 구성 요소(소프트웨어, 서비스), 도입 방식(클라우드, On-Premise, 하이브리드), 기업 규모(대기업, 중소기업), 용도(사업 연속성 관리 등), 최종 사용자 산업(은행, 금융서비스 및 보험(BFSI), 헬스케어 및 생명과학 등) 및 지역별로 분류되어 있습니다. 시장 전망은 금액(달러) 기준으로 제시되어 있습니다.
세계의 사이버 복원력 및 비즈니스 연속성 시장 동향과 인사이트
랜섬웨어 복구 예산 배분 증가
많은 조직이 복구 체계를 단순한 기술적 부가 기능이 아닌 재무적 안전 조치로 인식하게 됨에 따라, 사이버 복원력 및 비즈니스 연속성 시장은 랜섬웨어 복구 예산으로부터 직접적인 지원을 받고 있습니다. IBM 보고서에 따르면, 2025년 랜섬웨어 또는 협박 사고의 평균 총 비용은 508만 달러에 달했으며, 이는 이사회에 가동 중단, 시정 조치 및 규제 위험에 대한 명확한 기준점을 제공합니다. Veeam의 조사에 따르면, 94%의 조직이 랜섬웨어 복구 예산을 증액하고 있으며, 이는 예산 계획이 대비 태세와 복구 능력으로 얼마나 빠르게 전환되고 있는지를 보여줍니다. 또한 Sophos의 조사에 따르면, 백업이 침해되지 않은 조직의 경우 복구 비용 중앙값이 37만 5,000달러로 제한된 반면, 백업이 침해된 경우에는 300만 달러에 달한 것으로 나타나, 이를 통해 보다 견고한 백업 아키텍처와 격리 대책 도입에 대한 경제적 근거가 명확해졌습니다. 사이버 복원력 및 비즈니스 연속성 시장도 혜택을 보고 있습니다. 위협 행위자들이 공격 체인의 초기 단계에서 백업 저장소를 표적으로 삼게 되면서, 불변 스토리지, 깨끗한 복구 지점, 그리고 복구 검증은 단순한 백업 용량보다 더 중요해졌기 때문입니다. 이러한 추세로 인해 구매자의 기대도 변화하고 있습니다. 조직들은 현재, 깨끗한 실험실 환경이 아닌 적대적인 상황에서도 복구 자원이 공격을 견뎌내고 업무를 복구할 수 있다는 증거를 요구하고 있습니다.
검증된 복구 및 사업 연속성 계획에 대한 규제적 압력
또한, 검증된 복구 계획이 더 많은 산업 및 지역에서 규정 준수 요건으로 자리 잡고 있음에 따라, 사이버 복원력 및 사업 연속성 시장도 확대되고 있습니다. 유럽연합(EU)의 디지털 운영 복원력 법(Digital Operational Resilience Act)은 2025년 1월 17일부터 금융 기관에 대해 시행되며, 문서화된 ICT 사업 연속성 정책, 검증된 재해 복구 계획, 그리고 대규모 장애 발생 후 신속한 사고 통보를 의무화하고 있습니다. NIS2 지침은 중요 부문 전반에 걸쳐 유사한 의무를 확대하고 있으며, 많은 조직이 정적인 사업 연속성 문서에 그치지 않고 증거, 테스트 기록 및 부서 간 협력을 지원하는 시스템으로의 전환을 요구받고 있습니다. SANS는 2026년 보고서에서 95%의 조직이 ' 규제 프레임워크가 사이버 보안 인력 배치 결정에 영향을 미치고 있다'고 응답했다고 보고했으며, 이는 2025년의 40%에서 증가한 수치로, 규정 준수 압박이 채용과 플랫폼 투자 모두에 영향을 미치고 있음을 보여줍니다. 그 결과, 사이버 복원력 및 비즈니스 연속성 시장에서는 규제 대상 산업에서 조달 주기가 단축되고 있습니다. 이는 구매자가 단순한 정책적 의도가 아닌, 검증된 준비 태세를 입증할 수 있는 시스템을 필요로 하기 때문입니다. 또한, 이러한 추세는 특히 금융 서비스, 의료, 중요 인프라 분야에서 운영 워크플로우를 확립된 기준 및 감독 당국의 기대에 부합시킬 수 있는 벤더에게 유리하게 작용하고 있습니다.
레거시 및 최신 보안 스택에 걸친 고도의 통합 복잡성
많은 기업이 레거시 도구, 클라우드 시스템, 전문 보안 제품을 광범위하게 병용하고 있기 때문에 사이버 복원력 및 비즈니스 연속성 시장은 여전히 통합의 복잡성으로 인한 과제에 직면해 있습니다. IBM과 Palo Alto Networks는 2025년 초, 각 조직이 평균 29개 벤더가 제공하는 83개의 보안 솔루션을 관리하고 있음을 밝혔습니다. 이는 실제 사고 발생 시 많은 복구 팀이 대처해야 하는 분산된 시스템의 규모를 여실히 보여줍니다. Versa Networks는 2026년에 73%의 조직에서 통합의 복잡성으로 인해 중요한 프로젝트가 지연되거나 좌절되었으며, 35%는 네트워크 도구와 보안 도구 간의 격차로 인한 보안 침해를 보고했다고 발표했습니다. 사이버 복원력 및 비즈니스 연속성 시장에서 이 점은 매우 중요합니다. 복구의 성패는 백업 시스템, ID 관리 도구, 사고 대응 워크플로우, 통신 플랫폼 및 프로덕션 환경 간의 원활한 데이터 흐름에 달려 있기 때문입니다. 통합 작업은 BFSI(은행 및 금융 및 보험)나 의료, 기타 레거시 시스템이 다수 존재하는 산업에서 도입을 지연시키는 요인이 되는 경우가 많습니다. 이러한 업계에서는 기존 시스템을 교체할 경우 운영상 및 감사상의 문제가 발생할 가능성이 있기 때문입니다. 조직이 자동화 및 AI 도구를 더욱 도입함에 따라, 신뢰할 수 있는 상호 운용성에 대한 필요성은 더욱 커지고 있습니다. 위기 상황에서 연결에 실패하면 복구 프로세스 전체가 중단될 우려가 있기 때문입니다.
부문 분석
2025년 사이버 복원력 및 비즈니스 연속성 시장에서 소프트웨어가 59.72%를 차지했습니다. 이는 구매자들이 복구 오케스트레이션, 보고, 규정 준수 추적을 단일 운영 계층으로 통합하는 플랫폼을 계속해서 선호하고 있음을 보여줍니다. 조직들이 도구 과다 현상을 줄이고, 복잡한 사고 발생 시 복구 조치의 조정을 용이하게 하려고 노력함에 따라 이러한 추세는 더욱 강화되고 있습니다. 소프트웨어 중심의 구매 경향은 제품의 성숙도도 반영하고 있습니다. 이는 현재의 많은 플랫폼이 이전의 백업 제품보다 더 효과적으로 정책 설정, 깨끗한 복구 지점 식별 및 장애 조치 순서를 자동화하고 있기 때문입니다. 2025년에도 소프트웨어 분야의 사이버 복원력 및 비즈니스 연속성 시장은 여전히 핵심 수익 기반으로 남아 있었지만, 구매자들이 설계, 테스트, 일상 운영에 있어 외부 지원을 요구하게 됨에 따라 서비스 분야는 2026년부터 2031년까지 연평균 성장률(CAGR) 15.71%로 확대될 것으로 예측됩니다. 이러한 조합은 고객이 소프트웨어 및 서비스 중 하나를 엄격하게 선택하고 있는 것은 아니라는 점을 보여줍니다. 많은 고객이 사내 자원이 제한적인 경우, 강력한 플랫폼과 관리형 제공을 결합한 솔루션을 원하기 때문입니다.
서비스가 성장세를 보이고 있는 이유는 중견 기업, 공공 부문 사용자 및 소규모 IT 팀이 사내에서 지속적으로 유지할 수 없는 복구 관련 전문 지식을 필요로 하는 경우가 많기 때문입니다. 따라서 사이버 복원력 및 비즈니스 연속성 시장에서는 정기적인 플랫폼 수익에 자문 지원, 관리형 백업, 복구 실행 지원을 결합한 벤더들이 성공을 거두고 있습니다. Veeam이 2026년 5월에 DataAI Command Platform을 출시한 것은 소프트웨어 벤더들이 복원력, AI 거버넌스, 데이터 신뢰성 인프라를 단일 솔루션으로 통합함으로써 그 역할을 확대하고 있음을 보여줍니다. Acronis, Arcserve, Datto, Unitrends는 여전히 이 부문의 서로 다른 분야를 담당하고 있지만, 구매자의 관심은 제한적인 기능 목록보다는 검증 가능한 복구 성과로 이동하고 있습니다. 장기적으로는 대기업의 복잡성과 채널 주도형 중견 기업 대상 제공을 모두, 고객층별로 개별 운영 모델을 구축하지 않고도 지원할 수 있는 벤더가 가장 견고한 입지를 유지할 가능성이 높습니다.
2025년에는 사이버 복원력 및 비즈니스 연속성 시장에서 클라우드 기반 도입이 52.84%를 차지했으며, 이는 프로비저닝 가속화, 인프라 오버헤드 감소, 그리고 구독 기반 도입에 대한 강력한 수요를 반영합니다. 클라우드 도입에서 사이버 복원력 및 비즈니스 연속성 시장 점유율 확대는 많은 조직이 복구 범위를 확대하면서도 초기 단계의 대규모 하드웨어 도입 주기를 피하기를 선호했다는 사실에 힘입었습니다. 그러나 많은 조직이 규제 대상 워크로드나 비즈니스에 중요한 시스템에 대해 단일 환경에 의존할 수 없기 때문에 하이브리드 도입은 2031년까지 연평균 성장률(CAGR) 15.82%를 나타낼 것으로 예측됩니다. 의료, 금융 서비스, 중요 인프라 분야의 사용자들은 종종 On-Premise 저장소, 프라이빗 환경, 퍼블릭 클라우드를 복구 대상으로 동시에 아우르는 아키텍처를 필요로 합니다. 따라서 데이터 저장 위치 관리와 유연한 복구 실행을 모두 필요로 하는 구매자에게 하이브리드 모델은 실용적인 선택지가 되고 있습니다.
사이버 복원력 및 비즈니스 연속성 시장에서 하이브리드 도입이 증가하는 이유는 진정한 과제가 데이터의 저장 위치가 아니라 연결된 환경 전체에서 비즈니스 서비스를 얼마나 신속하게 복구할 수 있는지에 있기 때문입니다. 에어갭이 적용된 산업 환경, 국방 관련 업무, 또는 장기 데이터 보존 규정을 가진 조직은 여전히 On-Premise 자산을 유지하고 있지만, 이를 클라우드 기반 복구 오케스트레이션에 연결하는 경향이 강해지고 있습니다. 이러한 맥락에서 Disaster Recovery as a Service(DRaaS)의 중요성은 더욱 커지고 있습니다. 이는 데이터센터를 완전히 복제하는 비용을 들이지 않고도 조직에 보조 복구 환경을 제공하기 때문입니다. Zerto가 중시하는 지속적인 데이터 보호와 매우 낮은 복구 시점 목표(RPO)는 특히 큰 데이터 유출을 용납할 수 없는 지연 시간에 민감한 용도에서 이러한 요구를 충족시킵니다. Spanning 2025의 조사 결과에서 드러난, 인식된 복구 속도와 실제 복구 속도의 격차 또한 도입 방식의 선택만으로는 준비가 완료되었다고 말할 수 없음을 강조하고 있습니다. 왜냐하면 검증된 오케스트레이션과 리허설이 여전히 필수적이기 때문입니다. 그 결과, 구매자들은 단순히 클라우드 선호도뿐만 아니라 검증된 복구 성능이라는 관점에서 도입 모델을 평가하기 시작했습니다.
지역별 분석
2025년, 북미는 사이버 복원력 및 비즈니스 연속성 시장의 31.07%를 차지하며, 다른 지역을 크게 앞지르고 최대 지역 부문이 되었습니다. 미국은 여전히 주요 지출 거점으로 남아 있습니다. 이는 대기업들이 정보 공개 규정, 보험사의 면밀한 검토, 주주들의 압력 등 복합적인 요인에 직면해 있어, 다운타임이나 사이버 복구를 단순한 IT 문제로만 취급하기 어려워졌기 때문입니다. 또한, 이 지역의 사이버 복원력 및 비즈니스 연속성 시장은 BFSI(은행 및 금융 및 보험), 의료, 정부 부문의 견조한 수요 덕분에 혜택을 보고 있습니다. 이러한 분야에서는 비즈니스 연속성 프로그램이 이미 운영 모델이나 규정 준수 프로세스에 통합되어 있기 때문입니다. Splunk는 2026년 보고서에서 전 세계 2,000개 기업이 예기치 못한 가동 중단으로 인해 연간 평균 3억 달러의 손실을 입었으며, 중대한 사고 발생 후에는 평균 3.4%의 주가 하락이 관찰되었다고 보고했습니다. 이는 해당 지역에서 복원력 예산이 이사회 차원에서 주목받는 이유를 설명하는 요인 중 하나입니다. 캐나다와 멕시코도 지역 내 수요를 뒷받침하고 있으며, 특히 국경을 넘는 사업 리스크와 미국과의 규제 조화가 더욱 강력한 사업 연속성 관리를 촉진하고 있습니다.
유럽은 사이버 복원력 및 사업 연속성 분야에서 여전히 2위 지역 시장이며, 그 수요 동향은 증거 제시, 테스트 및 공식적인 사고 대응을 의무화하는 규제에 의해 점점 더 형성되고 있습니다. 2025년 1월부터 시행된 DORA는 문서화된 ICT 사업 연속성 계획, 검증된 복구 절차, 기한이 정해진 장애 보고를 요구하는 금융 기관의 지출 동향을 계속해서 좌우하고 있습니다. NIS2는 중요 부문 전반에 걸쳐 유사한 의무를 확대하고 있으며, 조직으로 하여금 수작업으로 작성된 사업 연속성 문서를 조정, 증거 수집 및 감독을 지원하는 도구로 대체하도록 요구하고 있습니다. 독일, 영국, 프랑스, 이탈리아, 스페인은 규제 대상인 대규모 부문과 더 강력한 법 집행에 대한 기대, 그리고 더욱 성숙한 공급업체 생태계를 모두 갖추고 있어 여전히 중요한 국내 시장으로 남아 있습니다.
아시아태평양은 연평균 성장률(CAGR) 17.12%를 나타낼 것으로 예측되며, 클라우드 도입, 랜섬웨어 피해 증가, 대기업 및 중견 기업의 디지털 업무 보호 수요 증가에 힘입어 사이버 복원력 및 사업 연속성 시장에서 가장 빠르게 성장하는 지역 부문입니다. 일본의 국내 사이버 보안 시장 규모는 1조 9,471억 엔에 달했습니다. 이는 2025년 평균 환율(1달러=149.9엔)로 환산하면 129억 9,000만 달러에 해당하며, 이러한 성장의 한 요인으로는 기업들이 사이버 보안을 사업 연속성 계획의 기반으로 삼고 있다는 점을 들 수 있습니다. Marsh의 보고서에 따르면, 일본의 랜섬웨어 공격은 2025년 상반기에 2024년 대비 40% 증가했으며, 사이버 보험 청구 건수는 2022년부터 2024년까지 57% 증가했습니다. 이는 사업 중단 위험이 지출 결정에 얼마나 신속하게 반영되고 있는지를 보여줍니다. 인도, 한국, 중국, 호주는 각각 클라우드 확대, 규정 준수 기대, 데이터 관리 요건과 같은 고유한 요인들이 결합되어 지역별 성장에 기여하고 있습니다. 남미는 금융 서비스 및 소매업의 대기업을 주축으로 여전히 신흥 기회 시장으로 남아 있지만, 예산 제약과 레거시 시스템 통합에 관한 과제로 인해 해당 지역 일부에서는 도입 속도가 둔화되고 있습니다. 중동 및 아프리카 역시 소규모 기반에서 성장을 이어가고 있으며, 사우디아라비아와 아랍에미리트(UAE)는 핵심 인프라의 복원력 강화에 투자하고 있는 반면, 남아프리카공화국은 아프리카 수요의 상당 부분을 차지하고 있습니다.
기타 혜택 :
- 엑셀 형식 시장 예측(ME) 시트
- 3개월간의 애널리스트 지원
자주 묻는 질문
목차
제1장 서론
제2장 조사 방법
제3장 주요 요약
제4장 시장 구도
제5장 시장 규모 및 성장 예측
제6장 경쟁 구도
제7장 시장 기회 및 향후 전망
KTH 26.08.10According to Mordor Intelligence, the cyber resilience and business continuity market size is projected to be USD 9.37 billion in 2025, USD 10.47 billion in 2026, and reach USD 20.75 billion by 2031, growing at a CAGR of 14.66% from 2026 to 2031.
This report is Segmented by Component (Software and Services), Deployment (Cloud, On-Premises, and Hybrid), Enterprise Size (Large Enterprises, and Small and Medium Enterprises), Application (Business Continuity Management, and More), End-User Industry (BFSI, Healthcare and Life Sciences, and More), and Geography. The Market Forecasts are Provided in Terms of Value (USD).
Global Cyber Resilience and Business Continuity Market Trends and Insights
Rising Ransomware Recovery Budget Allocation
The cyber resilience and business continuity market is gaining direct support from ransomware recovery budgets because many organizations now treat recovery readiness as a financial safeguard rather than a technical add-on. IBM reported that the average all-in cost of a ransomware or extortion incident reached USD 5.08 million in 2025, providing boards with a clear reference point for downtime, remediation, and regulatory exposure. Veeam found that 94% of organizations increased their ransomware recovery budgets, indicating how quickly budget planning has shifted toward preparedness and restoration capabilities. Sophos also showed that organizations with uncompromised backups reduced median recovery costs to USD 375,000, compared with USD 3 million when backups were compromised, which sharpened the economic case for stronger backup architecture and isolation practices. The cyber resilience and business continuity market is also benefiting, as threat actors now target backup repositories early in the attack chain, making immutable storage, clean recovery points, and recovery verification more important than backup volume alone. This pattern is changing buyer expectations, as organizations now want proof that recovery assets can withstand an attack and restore operations under hostile conditions rather than in a clean-lab environment.
Regulatory Pressure for Tested Recovery and Continuity Plans
The cyber resilience and business continuity market is also rising as tested recovery plans are becoming a compliance requirement across more sectors and regions. The European Union Digital Operational Resilience Act became enforceable for financial entities on January 17, 2025, and it requires documented ICT business continuity policies, tested disaster recovery plans, and rapid incident notification after major disruptions. The NIS2 Directive is expanding similar obligations across critical sectors, pushing many organizations to move beyond static continuity documents into systems that support evidence, testing records, and cross-functional coordination. SANS reported in 2026 that 95% of organizations said regulatory frameworks now shape cybersecurity staffing decisions, up from 40% in 2025, indicating that compliance pressure is influencing both hiring and platform investment. The cyber resilience and business continuity market is therefore seeing shorter procurement cycles in regulated industries, as buyers need systems that can demonstrate tested readiness rather than just policy intent. This also favors vendors that can align operational workflows with established standards and supervisory expectations, especially in financial services, healthcare, and critical infrastructure.
High Integration Complexity Across Legacy and Modern Security Stacks
The cyber resilience and business continuity market still faces friction due to integration complexity, as many enterprises operate large mixes of legacy tools, cloud systems, and specialized security products. IBM and Palo Alto Networks found in early 2025 that organizations managed an average of 83 security solutions from 29 vendors, underscoring the scale of the fragmentation many recovery teams must navigate during a live incident. Versa Networks reported in 2026 that 73% of organizations had a critical project delayed or derailed by integration complexity, and 35% reported a security breach linked to gaps between networking and security tools. In the cyber resilience and business continuity market, this matters because recovery success depends on clean data flows between backup systems, identity tools, incident workflows, communications platforms, and production environments. Integration work often slows deployments in BFSI, healthcare, and other legacy-heavy sectors, where replacing incumbent systems can raise operational and audit concerns. As organizations add more automation and AI tooling, the need for reliable interoperability becomes even more important, because a failed connection during a crisis can disrupt the entire restoration sequence.
Other drivers and restraints analyzed in the detailed report include:
- Cloud And SaaS Dependency Requiring Continuous Recovery Readiness
- Board-Level Focus on Operational Downtime Losses
- Shortage of Skilled Resilience, Recovery, and Incident Response Talent
For complete list of drivers and restraints, kindly check the Table Of Contents.
Segment Analysis
Software accounted for 59.72% of the cyber resilience and business continuity market in 2025, indicating that buyers continue to favor platforms that bring recovery orchestration, reporting, and compliance tracking into a single operating layer. This preference has strengthened as organizations seek to reduce tool sprawl and make recovery actions easier to coordinate during complex incidents. Software-led buying also reflects product maturity, because many current platforms automate policy setup, clean recovery point identification, and failover sequencing more effectively than earlier backup products. The cyber resilience and business continuity market for software remained the core revenue base in 2025, while services are projected to expand at a 15.71% CAGR from 2026 to 2031 as buyers seek outside help with design, testing, and day-to-day operations. That combination shows that customers are not strictly choosing between software and services, because many want a strong platform paired with managed delivery where internal capacity is limited.
Services are gaining momentum because mid-market companies, public-sector users, and lean IT teams often need recovery expertise they cannot maintain in-house continuously. The cyber resilience and business continuity market is therefore rewarding vendors that combine recurring platform revenue with advisory support, managed backup, and execution support for recovery. Veeam's May 2026 launch of the DataAI Command Platform demonstrated how software vendors are broadening their role by integrating resilience, AI governance, and data trust infrastructure into a single offering. Acronis, Arcserve, Datto, and Unitrends still address distinct parts of this segment, but buyer attention is shifting toward verifiable recovery outcomes rather than narrow feature lists. Over time, the strongest positions are likely to remain with vendors that can support both the complexity of large enterprises and channel-driven mid-market delivery without creating separate operating models for each customer tier.
Cloud-based deployment accounted for 52.84% of the cyber resilience and business continuity market in 2025, reflecting strong demand for faster provisioning, lower infrastructure overhead, and subscription-led adoption. The cyber resilience and business continuity market share in cloud deployments also benefited from the fact that many organizations preferred to avoid large upfront hardware cycles while still improving recovery coverage. Even so, hybrid deployment is projected to grow at a 15.82% CAGR through 2031, as many organizations cannot rely on a single environment for regulated workloads and business-critical systems. Healthcare, financial services, and critical infrastructure users often need architectures that span on-premises vaults, private environments, and public cloud restoration targets simultaneously. This makes hybrid models a practical choice for buyers who need both data residency control and flexible recovery execution.
The cyber resilience and business continuity market is seeing hybrid adoption rise because the real issue is not where data sits, but how quickly business services can return across connected environments. Organizations with air-gapped industrial settings, defense-linked operations, or long data retention rules still maintain on-premises assets, but increasingly connect them to cloud-based recovery orchestration. Disaster Recovery as a Service has become more relevant in this context because it provides organizations with a secondary recovery environment without the cost of a fully duplicated data center. Zerto's focus on continuous data protection and very low recovery point objectives fits this need, especially for latency-sensitive applications that cannot tolerate large data loss windows. The Spanning 2025 findings on the gap between perceived and actual recovery speed also underline that deployment choice alone does not create readiness, because tested orchestration and rehearsal remain essential. As a result, buyers are beginning to evaluate deployment models through the lens of verified recovery performance rather than cloud preference alone.
Complete Report Scope:
- By Component
- Software
- Services
- By Deployment
- Cloud
- On-Premises
- Hybrid
- By Enterprise Size
- Large Enterprises
- Small and Medium Enterprises
- By Application
- Business Continuity Management
- Disaster Recovery and Cyber Recovery
- Incident Management
- Crisis Communication and Emergency Notification
- Operational Resilience Management
- Risk and Resilience Management
- Compliance and Governance Management
- Business Impact Analysis and Recovery Planning
- By End-user Industry
- BFSI
- Healthcare and Life Sciences
- Information Technology and Telecom
- Retail and E-commerce
- Industrial Manufacturing
- Government and Public Sector
- Other End-user Industries
- By Geography
- North America
- United States
- Canada
- Mexico
- South America
- Brazil
- Argentina
- Rest of South America
- Europe
- Germany
- United Kingdom
- France
- Italy
- Spain
- Russia
- Rest of Europe
- Asia-Pacific
- China
- India
- Japan
- South Korea
- Australia
- Rest of Asia-Pacific
- Middle East and Africa
- Middle East
- Saudi Arabia
- United Arab Emirates
- Rest of Middle East
- Africa
- South Africa
- Nigeria
- Rest of Africa
- Middle East
- North America
Geography Analysis
North America held 31.07% of the cyber resilience and business continuity market in 2025, making it the largest regional segment by a wide margin. The United States remained the main spending center because large enterprises face a mix of disclosure rules, insurance scrutiny, and shareholder pressure that makes downtime and cyber recovery hard to treat as a narrow IT issue. The cyber resilience and business continuity market in the region also benefits from strong demand in BFSI, healthcare, and government, where continuity programs are already embedded in operating models and compliance processes. Splunk reported in 2026 that Global 2000 companies lost an average of USD 300 million annually to unplanned downtime and saw an average 3.4% stock price decline after a material incident, which helps explain why resilience budgets receive board-level attention in this region. Canada and Mexico add to regional demand, especially where cross-border business exposure and regulatory alignment with the United States encourage stronger continuity controls.
Europe remained the second-largest regional market for cyber resilience and business continuity, and its demand profile is increasingly shaped by rules requiring evidence, testing, and formal incident handling. DORA has been in force since January 2025 and continues to shape spending by financial entities that need documented ICT continuity plans, tested recovery procedures, and time-bound disruption reporting. NIS2 is expanding similar obligations across critical sectors, pushing organizations to replace manual continuity documentation with tools that support coordination, evidence capture, and oversight. Germany, the United Kingdom, France, Italy, and Spain remain important national markets because they combine large regulated sectors with stronger enforcement expectations and more mature supplier ecosystems.
Asia-Pacific, projected to grow at a 17.12% CAGR, is the fastest-growing regional segment in the cyber resilience and business continuity market, driven by cloud adoption, rising ransomware incidents, and a greater need to protect digital operations across large enterprises and mid-market organizations. Japan's domestic cybersecurity market reached JPY 1.9471 trillion, which was equivalent to USD 12.99 billion at the 2025 average exchange rate of JPY 149.9 per USD, and this growth was tied in part to enterprises treating cybersecurity as a foundation for business continuity planning. Marsh reported that ransomware attacks in Japan rose 40% in the first half of 2025 compared with 2024, and that cyber insurance claims in Japan rose 57% from 2022 to 2024, indicating how quickly disruption risk is translating into spending decisions. India, South Korea, China, and Australia each contribute to regional growth through their own mix of cloud expansion, compliance expectations, and data control requirements. South America remains an emerging opportunity, led by larger enterprises in financial services and retail, but budget constraints and legacy integration issues continue to slow adoption in parts of the region. The Middle East and Africa are also growing from a smaller base, with Saudi Arabia and the UAE investing in critical infrastructure resilience, while South Africa anchors a significant share of African demand.
- Cohesity, Inc.
- Rubrik, Inc.
- Commvault Systems, Inc.
- Veeam Software Group GmbH
- Druva Inc.
- Zerto Ltd.
- Acronis International GmbH
- Arcserve LLC
- Datto, Inc.
- Unitrends, Inc.
- Recovery Point Systems, Inc.
- Semperis, Inc.
- Everbridge, Inc.
- Riskonnect, Inc.
- Fusion Risk Management, Inc.
- Quantivate, LLC
- Castellan Solutions, Inc.
- LogicManager, Inc.
- ServiceNow
- Onspring Technologies, LLC
Additional Benefits:
- The market estimate (ME) sheet in Excel format
- 3 months of analyst support
TABLE OF CONTENTS
1 INTRODUCTION
- 1.1 Study Assumptions and Market Definition
- 1.2 Scope of the Study
2 RESEARCH METHODOLOGY
3 EXECUTIVE SUMMARY
4 MARKET LANDSCAPE
- 4.1 Market Overview
- 4.2 Market Drivers
- 4.2.1 Rising Ransomware Recovery Budget Allocation
- 4.2.2 Regulatory Pressure for Tested Recovery And Continuity Plans
- 4.2.3 Cloud and SaaS Dependency Requiring Continuous Recovery Readiness
- 4.2.4 Board-Level Focus On Operational Downtime Losses
- 4.2.5 Cyber Insurance Underwriting Requirements For Resilience Controls
- 4.2.6 AI-Enabled Incident Orchestration And Response Automation
- 4.3 Market Restraints
- 4.3.1 High Integration Complexity Across Legacy And Modern Security Stacks
- 4.3.2 Shortage Of Skilled Resilience, Recovery, And Incident Response Talent
- 4.3.3 Budget Friction In Mid-Market And SME Adoption
- 4.3.4 Limited Recovery Testing Discipline In Low-Maturity Organizations
- 4.4 Industry Value-Chain Analysis
- 4.5 Regulatory Landscape
- 4.6 Technological Outlook
- 4.7 Porter's Five Forces Analysis
- 4.7.1 Bargaining Power of Buyers
- 4.7.2 Bargaining Power of Suppliers
- 4.7.3 Threat of New Entrants
- 4.7.4 Threat of Substitutes
- 4.7.5 Intensity of Competitive Rivalry
5 MARKET SIZE AND GROWTH FORECASTS (VALUE)
- 5.1 By Component
- 5.1.1 Software
- 5.1.2 Services
- 5.2 By Deployment
- 5.2.1 Cloud
- 5.2.2 On-Premises
- 5.2.3 Hybrid
- 5.3 By Enterprise Size
- 5.3.1 Large Enterprises
- 5.3.2 Small and Medium Enterprises
- 5.4 By Application
- 5.4.1 Business Continuity Management
- 5.4.2 Disaster Recovery and Cyber Recovery
- 5.4.3 Incident Management
- 5.4.4 Crisis Communication and Emergency Notification
- 5.4.5 Operational Resilience Management
- 5.4.6 Risk and Resilience Management
- 5.4.7 Compliance and Governance Management
- 5.4.8 Business Impact Analysis and Recovery Planning
- 5.5 By End-user Industry
- 5.5.1 BFSI
- 5.5.2 Healthcare and Life Sciences
- 5.5.3 Information Technology and Telecom
- 5.5.4 Retail and E-commerce
- 5.5.5 Industrial Manufacturing
- 5.5.6 Government and Public Sector
- 5.5.7 Other End-user Industries
- 5.6 By Geography
- 5.6.1 North America
- 5.6.1.1 United States
- 5.6.1.2 Canada
- 5.6.1.3 Mexico
- 5.6.2 South America
- 5.6.2.1 Brazil
- 5.6.2.2 Argentina
- 5.6.2.3 Rest of South America
- 5.6.3 Europe
- 5.6.3.1 Germany
- 5.6.3.2 United Kingdom
- 5.6.3.3 France
- 5.6.3.4 Italy
- 5.6.3.5 Spain
- 5.6.3.6 Russia
- 5.6.3.7 Rest of Europe
- 5.6.4 Asia-Pacific
- 5.6.4.1 China
- 5.6.4.2 India
- 5.6.4.3 Japan
- 5.6.4.4 South Korea
- 5.6.4.5 Australia
- 5.6.4.6 Rest of Asia-Pacific
- 5.6.5 Middle East and Africa
- 5.6.5.1 Middle East
- 5.6.5.1.1 Saudi Arabia
- 5.6.5.1.2 United Arab Emirates
- 5.6.5.1.3 Rest of Middle East
- 5.6.5.2 Africa
- 5.6.5.2.1 South Africa
- 5.6.5.2.2 Nigeria
- 5.6.5.2.3 Rest of Africa
- 5.6.5.1 Middle East
- 5.6.1 North America
6 COMPETITIVE LANDSCAPE
- 6.1 Market Concentration
- 6.2 Strategic Moves
- 6.3 Market Share Analysis
- 6.4 Company Profiles (includes Global Level Overview, Market Level Overview, Core Segments, Financials as available, Strategic Information, Market Rank/Share, Products and Services, Recent Developments)
- 6.4.1 Cohesity, Inc.
- 6.4.2 Rubrik, Inc.
- 6.4.3 Commvault Systems, Inc.
- 6.4.4 Veeam Software Group GmbH
- 6.4.5 Druva Inc.
- 6.4.6 Zerto Ltd.
- 6.4.7 Acronis International GmbH
- 6.4.8 Arcserve LLC
- 6.4.9 Datto, Inc.
- 6.4.10 Unitrends, Inc.
- 6.4.11 Recovery Point Systems, Inc.
- 6.4.12 Semperis, Inc.
- 6.4.13 Everbridge, Inc.
- 6.4.14 Riskonnect, Inc.
- 6.4.15 Fusion Risk Management, Inc.
- 6.4.16 Quantivate, LLC
- 6.4.17 Castellan Solutions, Inc.
- 6.4.18 LogicManager, Inc.
- 6.4.19 ServiceNow
- 6.4.20 Onspring Technologies, LLC
7 MARKET OPPORTUNITIES AND FUTURE OUTLOOK
- 7.1 White-Space and Unmet-Need Assessment


