

|
시장보고서
상품코드
2099066
피지컬 AI 시장 : 점유율 분석, 업계 동향 및 통계, 성장 예측(2026-2031년)Physical AI - Market Share Analysis, Industry Trends & Statistics, Growth Forecasts (2026 - 2031) |
||||||
 Mordor Intelligence
Mordor Intelligence에 의하면, 피지컬 AI 시장 규모는 2025년 50억 6,000만 달러, 2026년 71억 1,000만 달러에서 2031년까지 348억 9,000만 달러로 확대되어 2026년부터 2031년까지 연평균 복합 성장률(CAGR)은 37.46%를 나타낼 것으로 예측됩니다.
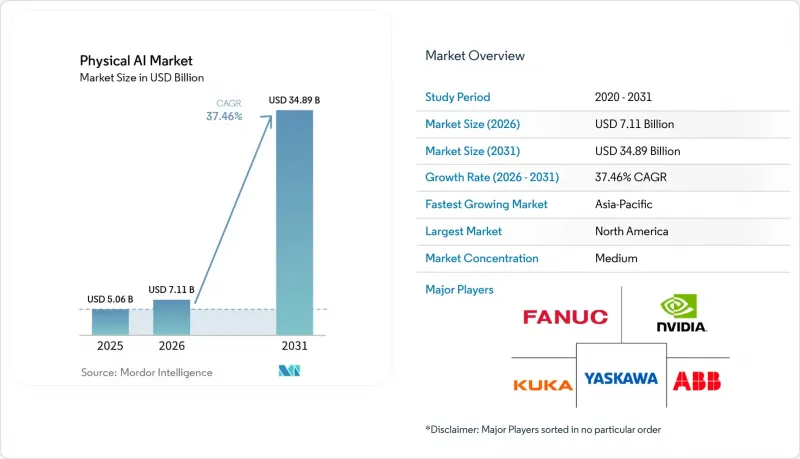
본 보고서는 구성 요소(하드웨어, 소프트웨어, 서비스), 로봇 유형(산업용 로봇, 업무용 서비스 로봇, 개인·가정용 서비스 로봇 등), 도입 형태(온디바이스, 클라우드 기반, 하이브리드), 최종 사용자 산업(물류·공급망, 제조, 의료, 자동차, 농업 등), 지역별로 분류되어 있습니다. 시장 전망은 금액(달러) 기준으로 제시되어 있습니다.
전 세계 피지컬 AI 시장 동향과 인사이트
물류 및 제조 분야에서의 실세계 자동화 수요 증가
2025년, 미국의 산업용 로봇 도입 대수는 전년 대비 11% 증가한 3만 8,000대에 달했으며, 이는 자동차 업계의 경기 사이클과 무관하게 구매자들이 여전히 자동화 역량을 지속적으로 확충하고 있음을 보여줍니다. 식품 업계만 해도 30% 증가한 3,000대의 도입을 기록했으며, 그동안 자동화 보급률이 낮았던 분야에서도 도입이 가속화되고 있음을 알 수 있습니다. 피지컬 AI 시장에서 이 점은 중요합니다. 왜냐하면 수요가 더 이상 고정식 공장용 로봇에만 국한되지 않고, 이동형 시스템, 로봇 팔, 그리고 적응성이 더 높은 제어 계층을 결합한 혼합 플릿으로 확대되고 있기 때문입니다. 사업자가 개별 하드웨어 구매가 아닌 워크플로우 전체의 통합을 추구하게 되면, 소프트웨어를 통한 조정 및 플릿 관리가 구매 결정에 있어 더 중요한 요소가 됩니다. 이러한 변화는 피지컬 AI 시장을 뒷받침합니다. 새로운 도입 사례마다 서로 다른 유형의 기계 간에 작동하는 지각, 계획, 제어 소프트웨어에 대한 의존도를 높이고 있기 때문입니다.
저지연 로봇 의사결정을 위한 엣지 AI 추론의 성숙도
Jetson AGX Thor의 일반 공급 개시는 즉각적인 로컬 추론이 필요한 로봇을 위한 임베디드 연산 능력이 얼마나 빠르게 향상되고 있는지를 보여줍니다. NVIDIA에 따르면, 이 플랫폼은 2,070 FP4 테라플롭스의 성능을 발휘하며, 이전 세대 모델에 비해 AI 연산 능력이 7.5배 향상되어 기계 수준에서 실시간 멀티모달 처리를 지원합니다. Boston Dynamics는 이 플랫폼을 Atlas에 통합했으며, Agility Robotics도 6세대 Digit에 이를 채택했습니다. 이는 실리콘 선택이 단순한 교체 가능한 구성 요소가 아니라 전략적인 설계 결정 사항으로 자리 잡고 있음을 보여줍니다. 피지컬 AI 시장에서 설계 단계에서 선정된 엣지 프로세서는 대부분의 경우 운영 기간 내내 그대로 사용되므로, 이를 통해 벤더와의 장기적인 관계가 형성됩니다. 그 결과, 시간적 제약이 있는 의사 결정을 로컬에서 실행하는 하드웨어와, 업데이트, 오케스트레이션, 모델 개선을 통해 가치를 지속적으로 높이는 소프트웨어 계층 사이에 더욱 명확한 구분이 생겨나고 있습니다.
높은 시스템 통합 비용과 긴 시운전 주기
로봇 하드웨어의 경제성은 향상되고 있지만, 프로젝트 전체에는 일반적으로 금형, 안전 시스템, 통합 작업비, 인프라 업데이트 및 교육이 포함되기 때문에 높은 도입 비용이 여전히 피지컬 AI 시장의 걸림돌이 되고 있습니다. 조사에 따르면, 운영자가 대규모 재현성을 평가하기 시작하기 전부터 중급 수준의 협업 로봇 셀 도입 비용은 5만-9만 달러에 달할 전망입니다. 시간당 100-140달러의 통합 작업비, 10,000-25,000달러의 추가 안전 대책비, 12,000-20,000달러의 교육 비용과 같은 요소들이 도입이 여전히 단순한 제품 구매가 아니라 시스템 프로젝트처럼 느껴지는 이유를 보여줍니다. 공장 내 시험 단계를 무사히 통과했다가 현장 인수 검사 시 문제가 발견되면 사태는 더욱 심각해집니다. 지연이 발생할 때마다 생산 라인 가동이나 가동 개시 일정에 차질이 생길 가능성이 있기 때문입니다. 이 때문에 특히 구매자가 단일 거점에서 다중 거점으로의 확장을 앞두고 예측 가능한 가치 실현까지의 기간을 요구할 경우, 피지컬 AI 시장의 확대는 최종 수요만으로는 예상되는 만큼 신속하게 진행되지 않고 있습니다.
부문 분석
2025년에는 하드웨어가 52.42%의 점유율을 차지하며 피지컬 AI 시장에서 가장 큰 비중을 차지했습니다. 이는 모든 도입이 여전히 연산 모듈, 액추에이터, 센서, 그리고 로봇 본체 자체에서 시작되기 때문입니다. 이미 구축된 하드웨어 기반은 어떤 모델을 로컬에서 실행할 수 있는지, 시스템이 얼마나 신속하게 응답할 수 있는지, 그리고 기능 향상에 따라 어느 정도의 재설계가 필요한지를 결정짓는 중요한 요소가 됩니다. 2025년 시점에서도 구성 요소 수준에서 피지컬 AI 시장 규모는 여전히 하드웨어에 치우쳐 있으며, 이는 소프트웨어 상뿐만 아니라 실제 환경에서 작동해야 하는 로봇의 자본 집약적인 특성을 반영합니다. 보스턴 다이내믹스는 'Atlas'에 NVIDIA Jetson AGX Thor를 통합했으며, 애저리티 로보틱스도 6세대 'Digit'에 동일한 플랫폼을 채택했습니다. 이는 초기 단계의 하드웨어 결정이 장기적인 공급업체와의 관계를 어떻게 형성하는지를 보여줍니다. 이러한 설계상의 선택은 유지보수성, 전력 소비, 열적 한계, 업그레이드 경로에도 영향을 미칩니다. 즉, 하드웨어가 여전히 스택의 다른 부분에서 작동의 경계를 결정하고 있는 것입니다.
소프트웨어 시장은 2031년까지 연평균 성장률(CAGR) 40.43%를 나타낼 것으로 예측되며, 이는 피지컬 AI 시장의 장기적인 가치 상당 부분이 어디로 이동할지를 시사합니다. 이러한 변화는 물리적 자산을 대체하지 않으면서도 도입된 기계 전체의 성능을 향상시키는 월드 파운데이션 모델, 시뮬레이션 프레임워크, 그리고 차량 관리 도구와 밀접하게 연관되어 있습니다. NVIDIA는 GTC 2026에서 GR00T N1.7의 조기 상용 액세스를 시작하며, 소프트웨어 라이선싱을 단순한 하드웨어 판매에 포함된 기능이 아닌 진정한 수익원으로 자리매김하고 있습니다. 서비스가 여전히 중요한 이유는 플릿이 여러 거점에 분산되고 서로 다른 OEM의 기계가 포함됨에 따라 통합, 시운전, 교육, 최적화가 더욱 복잡해지기 때문입니다. 따라서 피지컬 AI 업계는 하드웨어가 문을 열어주는 한편, 업데이트와 오케스트레이션을 통해 성능이 향상됨에 따라 소프트웨어 및 서비스 계층이 지속적인 가치에서 더 큰 비중을 차지하는 구조로 전환되고 있습니다.
2025년 기준으로 산업용 로봇은 58.23%의 점유율을 차지하고 있으며, 이는 자동차, 전자, 반도체 분야에서 이미 가동 중인 대규모 도입 실적을 반영한 것입니다. 이러한 위상은 피지컬 AI 시장에 견고한 기반을 마련해 주었습니다. 구매자들은 시스템 전체를 교체하는 대신, 검증된 하드웨어에 더 스마트한 지각 및 제어 계층을 추가할 수 있었기 때문입니다. 또한, 확립된 도입 실적이 있다는 것은 처리량, 품질, 인력의 유연성이 중요한 광범위한 생산 환경에서 AI의 점진적인 업그레이드조차도 영향을 미칠 수 있음을 의미했습니다. 동시에, 창고나 주문 처리 센터에서는 이동성, 조작성, 상황에 따른 대응 능력을 겸비한 기계가 요구됨에 따라 산업용 로봇과 서비스 로봇의 경계가 모호해지고 있습니다. 창고 통로에서 작동하는 기계는 산업용 암과 서비스 로봇의 특징을 모두 갖출 가능성이 있어, 이는 공급업체의 제품 카테고리 정의 방식에도 변화를 가져오고 있습니다.
업무용 서비스 로봇은 2031년까지 연평균 성장률(CAGR) 39.72%를 나타낼 것으로 예측되며, 피지컬 AI 시장에서 가장 빠르게 성장하는 로봇 유형이 될 전망입니다. 이러한 성장을 주도하는 것은 물류, 의료, 소매 분야에서의 응용입니다. 이러한 분야에서는 레이아웃 변경이나 물체 이동, 과거에는 인간의 판단이 필요했던 작업에 대응할 수 있는 로봇이 요구되고 있습니다. 또한 휴머노이드와 이동형 매니퓰레이터 플랫폼이 서로 다른 재질의 물체를 다루는 분야로도 진출하고 있다는 점이 지적되고 있으며, 이것이 범용 시스템에 있어 전문 서비스 로봇이 선호되는 상용화 진입 지점이 되는 이유를 설명해 줍니다. 이 카테고리에 대한 자금 집중은 일부 거래 관련 정보원에 기반한 수치가 정보원의 신뢰성 확보 관점에서 본고에서는 제외된 점과 더불어, 공급업체와 투자자들이 제한적인 시범 사업을 넘어선 폭넓은 이용 사례를 기대하고 있다는 관점을 뒷받침하고 있습니다. 따라서 피지컬 AI 업계는 성숙한 산업 기반과, 고정된 공장 작업을 훨씬 뛰어넘어 적용 가능한 이용 사례의 범위를 확대하고 있는 더욱 빠르게 발전하는 서비스 로봇 분야와의 균형을 맞추고 있다고 할 수 있습니다.
지역별 분석
2025년, 북미는 31.82%의 점유율을 차지하며 피지컬 AI의 최대 지역 시장이 되었습니다. 이러한 선두 위상은 AI 인프라 공급업체의 집중, 견조한 상용 도입 부문, 그리고 자율화에 대한 지출을 지속적으로 뒷받침하는 방위 환경을 반영한 것입니다. 2025년 미국의 산업용 로봇 도입 대수는 11% 증가한 3만 8,000대에 달하여, 소프트웨어 관련 화제에 그치지 않는 해당 지역의 광범위한 자동화 추세를 뒷받침하고 있습니다. 또한, 자동화 진흥 협회(Association for Advancing Automation)는 연방 로봇국 설립 및 국가 로봇 전략 수립을 추진하고 있으며, 이는 정책 논의가 도입 지원, 조달 방침의 통합, 안전 기준의 업데이트 방향으로 나아가고 있음을 보여줍니다. 캐나다와 멕시코는 자동차 및 전자기기 생산을 통해 해당 지역의 기반을 강화하고 있으며, 국경을 초월한 도입 모델이 초기 도입국에서 더 광범위한 공급망으로 확대됨에 따라 그 혜택을 누리게 될 것입니다.
아시아태평양은 2031년까지 연평균 성장률(CAGR) 43.04%를 나타낼 것으로 예측되며, 피지컬 AI 시장에서 가장 빠르게 성장하는 지역이 될 전망입니다. 이 지역은 제조 규모, 로봇 밀도, 정책 지원을 모두 갖추고 있어 공급업체에 현지 수요와 생산의 깊이를 모두 제공합니다. 이 분석에서는 이러한 가속화의 요인으로 2026년부터 2030년까지의 중국 ‘제15차 5개년 계획’과 2026년 한국의 제조업 근로자 1만 명당 1,220대의 로봇 밀도를 꼽으며, 이러한 성장이 일시적인 것이 아니라 구조적인 것임을 시사하고 있습니다. 또한, 중국에서는 2024년에 29만 5,000대의 산업용 로봇이 도입되어 같은 해 세계 시장 점유율의 54%를 차지했으며, 이는 향후 AI의 다층화를 뒷받침할 이 지역의 로봇 기반 규모를 보여줍니다. 피지컬 AI 시장에서 이는 아시아태평양이 단순한 수요의 중심일 뿐만 아니라, 공급의 경제성, 부품 생태계, 도입 속도를 점점 더 주도하고 있음을 의미합니다.
유럽, 남미, 중동 및 아프리카에서는 피지컬 AI 시장의 도입 경로가 더욱 다양해지고 있으며, 그 성과는 산업 구조, 투자 환경, 규격의 성숙도와 밀접하게 연관되어 있습니다. 독일에서는 2024년에 27만 8,900대의 가동 중인 산업용 로봇이 있으며, 이는 EU 공장용 로봇 총수의 40%를 차지하지만, 한편 2025년에는 로봇 공학 및 자동화 분야의 매출이 10% 감소할 것으로 예측되며, 이후 회복세를 보일 것이라는 전망도 제시되었습니다. 유럽에서는 선진적인 환경에서도 신뢰성과 규격이 상용화 결정에 여전히 큰 영향을 미치고 있어 보다 신중한 태도가 나타나고 있습니다. 반면, 남미 및 중동 및 아프리카는 여전히 초기 단계의 기회로, 물류 자동화 및 검사용 로봇이 피지컬 AI의 보다 광범위한 도입을 위한 주요 진입점이 되고 있습니다.
기타 혜택:
- 엑셀 형식 시장 예측(ME) 시트
- 3개월간의 애널리스트 지원
자주 묻는 질문
목차
제1장 서론
제2장 조사 방법
제3장 주요 요약
제4장 시장 구도
제5장 시장 규모와 성장 예측
제6장 경쟁 구도
제7장 시장 기회와 향후 전망
JHS 26.08.05According to Mordor Intelligence, the physical AI market size is projected to expand from USD 5.06 billion in 2025 and USD 7.11 billion in 2026 to USD 34.89 billion by 2031, registering a CAGR of 37.46% between 2026 to 2031.
This report is Segmented by Component (Hardware, Software, and Services), Robot Type (Industrial Robots, Professional Service Robots, Personal and Household Service Robots, and More), Deployment (On-Device, Cloud-Based, and Hybrid), End-User Verticals (Logistics and Supply Chain, Manufacturing, Healthcare, Automotive, Agriculture, and More), and Geography. The Market Forecasts are Provided in Terms of Value (USD).
Global Physical AI Market Trends and Insights
Rising Demand for Real-World Automation in Logistics and Manufacturing
Industrial robot installations in the United States rose 11% year over year to 38,000 units in 2025, showing that buyers were still adding automation capacity even outside a purely automotive cycle. The food industry alone posted a 30% increase to 3,000 installations, which showed that sectors with lower historical automation density were also moving faster. In the physical AI market, that matters because demand is no longer tied only to fixed factory robots; it is now spreading into mixed fleets that combine mobile systems, robot arms, and more adaptive control layers. Once operators pursue full workflow orchestration instead of isolated hardware purchases, software coordination and fleet management become more central to buying decisions. That shift supports the physical AI market because each new deployment increasingly depends on perception, planning, and control software that can work across different machine types.
Edge AI Inference Maturity for Low-Latency Robot Decision-Making
The release of the Jetson AGX Thor into general availability shows how quickly embedded compute capabilities are improving for robots that need immediate local reasoning. NVIDIA stated that the platform delivers 2,070 FP4 teraflops and 7.5 times the AI compute of its predecessor, which supports real-time multimodal processing at the machine level. Boston Dynamics is integrating the platform into Atlas, and Agility Robotics has adopted it for the sixth generation of Digit, which shows how silicon choices are becoming strategic design decisions rather than replaceable components. In the physical AI market, this creates long-term vendor relationships because edge processors selected during design often remain in place throughout an operating life. The result is a more defined split between hardware that executes time-critical decisions locally and software layers that continue to gain value through updates, orchestration, and model improvements.
High System Integration Cost and Long Commissioning Cycles
High deployment costs still slow the physical AI market even as robot hardware economics improve, because the full project typically includes tooling, safety systems, integration labor, infrastructure updates, and training. The input placed a mid-range collaborative robot cell at USD 50,000 to USD 90,000 before operators even begin to judge repeatability at scale. Integration labor of USD 100 to USD 140 per hour, added safety spending of USD 10,000 to USD 25,000, and training expense of USD 12,000 to USD 20,000 show why installation still feels like a system project rather than a product purchase. The problem becomes more serious when issues escape factory testing and appear during site acceptance, because every delay can disrupt line output or go-live schedules. This keeps the physical AI market from moving as fast as end demand alone would suggest, especially when buyers want a predictable time-to-value before expanding from one site to many.
Other drivers and restraints analyzed in the detailed report include:
- Human-Robot Collaboration in High-Variability Workflows
- Labor Scarcity in Unstructured Physical Work Environments
- Certification, Liability, and Functional Safety Complexity
For complete list of drivers and restraints, kindly check the Table Of Contents.
Segment Analysis
Hardware held a 52.42% share in 2025, giving it the largest position in the physical AI market, as every deployment still starts with compute modules, actuators, sensors, and the robot body itself. The installed hardware base matters because it determines which models can run locally, how quickly a system can respond, and how much redesign is needed as capabilities improve. The physical AI market size at the component level still leaned toward hardware in 2025, reflecting the capital-intensive nature of robots that must operate in real environments rather than solely in software. Boston Dynamics integrated NVIDIA Jetson AGX Thor into Atlas, and Agility Robotics adopted the same platform for the sixth generation of Digit, demonstrating how early hardware decisions shape long-term supplier relationships. These design choices also affect serviceability, power consumption, thermal limits, and upgrade paths, meaning hardware still sets the operating boundaries for the rest of the stack.
Software is projected to grow at a 40.43% CAGR through 2031, indicating where more of the long-run value in the physical AI market is likely to shift. The shift is tied to world foundation models, simulation frameworks, and fleet management tools that improve performance across deployed machines without replacing physical assets. NVIDIA released GR00T N1.7 in early commercial access at GTC 2026, pointing to software licensing as a real revenue stream rather than only a feature embedded inside hardware sales. Services remain important because integration, commissioning, training, and optimization become more complex as fleets spread across sites and include machines from different OEMs. The physical AI industry is therefore moving toward a structure where hardware opens the door, but software and service layers capture more of the recurring value as performance improves through updates and orchestration.
Industrial robots held a 58.23% share in 2025, reflecting the large installed base already operating in automotive, electronics, and semiconductor settings. That position gave the physical AI market a strong foundation, as buyers could add smarter perception and control layers to proven hardware rather than replace entire systems. The established installed base also meant that even incremental AI upgrades could influence a wide set of production environments where throughput, quality, and labor flexibility matter. At the same time, the line between industrial and service robots is becoming less rigid, as warehouses and fulfillment sites now need machines that combine mobility, manipulation, and situational response. This is changing how suppliers define product categories, because a machine working in a warehouse aisle may now share traits with both an industrial arm and a service robot.
Professional service robots are projected to grow at a 39.72% CAGR through 2031, making them the fastest-growing robot type in the physical AI market. Growth is being driven by logistics, healthcare, and retail applications where operators want robots that can handle changing layouts, moving objects, and tasks that once required human judgment. The input also noted that humanoid and mobile manipulator platforms are moving into mixed-material handling, which explains why professional service robots have become a favored commercial entry point for general-purpose systems. Funding concentration around this category reinforces the view that suppliers and investors expect broader use beyond narrow pilots, even though the source-backed figures for some transactions were excluded here for source hygiene reasons. The physical AI industry is therefore balancing a mature industrial base with a faster-moving service robot segment that is expanding the addressable use case range well beyond fixed factory work.
Complete Report Scope:
- By Component
- Hardware
- Software
- Services
- By Robot Type
- Industrial Robots
- Professional Service Robots
- Personal and Household Service Robots
- Other Robot Types
- By Deployment
- On-Device
- Cloud-Based
- Hybrid
- By End-User Verticals
- Logistics and Supply Chain
- Manufacturing
- Healthcare
- Defense and Security
- Automotive
- Agriculture
- Other End-User Verticals
- By Geography
- North America
- United States
- Rest of North America
- Europe
- Germany
- France
- Rest of Europe
- Asia-Pacific
- China
- Japan
- South Korea
- India
- Rest of Asia-Pacific
- South America
- Middle East and Africa
- North America
Geography Analysis
North America held a 31.82% share in 2025, making it the largest regional market for physical AI. That lead reflected the concentration of AI infrastructure suppliers, strong commercial deployment sectors, and a defense environment that continues to support autonomy spending. U.S. industrial robot installations rose 11% to 38,000 units in 2025, reinforcing the region's broad automation momentum beyond software headlines. The Association for Advancing Automation has also pushed for a Federal Robotics Office and a national robotics strategy, indicating that policy discussions are moving toward deployment support, procurement alignment, and updated safety standards. Canada and Mexico add to the regional base through automotive and electronics production, and they benefit when cross-border deployment models spread from early adopters into broader supply chains.
Asia-Pacific is projected to grow at a 43.04% CAGR through 2031, making it the fastest-growing region in the physical AI market. The region combines manufacturing scale, robotics density, and policy support in a way that gives suppliers both local demand and production depth. The input linked this acceleration to China's 15th Five-Year Plan for 2026 to 2030 and to South Korea's robot density of 1,220 units per 10,000 manufacturing workers in 2026, which framed growth as structural rather than temporary. China also recorded 295,000 industrial robot installations in 2024 and held a 54% global share in that year, showing the scale of the regional robot base supporting future AI layering. For the physical AI market, this means Asia-Pacific is not only a demand center, it is also increasingly shaping supply economics, component ecosystems, and deployment speed.
Europe, South America, and Middle East and Africa show more varied adoption paths in the physical AI market, with performance tied to industrial structure, investment conditions, and standards maturity. Germany had 278,900 active industrial robots in 2024, or 40% of the EU factory robot base, yet the input also pointed to a projected 10% robotics and automation revenue decline in 2025 before a later recovery. Europe appears more deliberate because reliability and standards still weigh heavily on commercial rollout decisions in advanced settings. South America and Middle East and Africa remain earlier-stage opportunities, where logistics automation and inspection robotics are acting as the main entry points for wider physical AI adoption.
- NVIDIA Corporation
- ABB Ltd
- FANUC Corporation
- Yaskawa Electric Corporation
- KUKA AG
- Boston Dynamics, Inc.
- Agility Robotics, Inc.
- Figure AI, Inc.
- NEURA Robotics GmbH
- Universal Robots A/S
- Teradyne, Inc.
- OMRON Corporation
- Dexterity, Inc.
- Covariant, Inc.
- Siemens AG
Additional Benefits:
- The market estimate (ME) sheet in Excel format
- 3 months of analyst support
TABLE OF CONTENTS
1 INTRODUCTION
- 1.1 Study Assumptions and Market Definition
- 1.2 Scope of the Study
2 RESEARCH METHODOLOGY
3 EXECUTIVE SUMMARY
4 MARKET LANDSCAPE
- 4.1 Market Overview
- 4.2 Impact of Macroeconomic Factors on the Market
- 4.3 Market Drivers
- 4.3.1 Rising Demand for Real-World Automation in Logistics and Manufacturing
- 4.3.2 Edge AI Inference Maturity for Low-Latency Robot Decision-Making
- 4.3.3 Human-Robot Collaboration in High-Variability Workflows
- 4.3.4 Sim-to-Real Digital Twin Pipelines Lower Deployment Risk
- 4.3.5 Safety-Critical Autonomy Demand in Defense and Security
- 4.3.6 Labor Scarcity in Unstructured Physical Work Environments
- 4.4 Market Restraints
- 4.4.1 High System Integration Cost and Long Commissioning Cycles
- 4.4.2 Certification, Liability, and Functional Safety Complexity
- 4.4.3 Interoperability Gaps Across Heterogeneous Robot Fleets
- 4.4.4 Edge Case Reliability Limits in Unstructured Environments
- 4.5 Industry Value Chain Analysis
- 4.6 Technological Outlook
- 4.6.1 Autonomy Level of Systems
- 4.6.2 Computer Vision
- 4.6.3 Machine Learning and Deep Learning
- 4.6.4 Natural Language Processing
- 4.6.5 Reinforcement Learning and Control Systems
- 4.7 Porter's Five Forces Analysis
- 4.7.1 Bargaining Power of Suppliers
- 4.7.2 Bargaining Power of Buyers
- 4.7.3 Threat of New Entrants
- 4.7.4 Threat of Substitutes
- 4.7.5 Industry Rivalry
5 MARKET SIZE AND GROWTH FORECASTS (VALUE)
- 5.1 By Component
- 5.1.1 Hardware
- 5.1.2 Software
- 5.1.3 Services
- 5.2 By Robot Type
- 5.2.1 Industrial Robots
- 5.2.2 Professional Service Robots
- 5.2.3 Personal and Household Service Robots
- 5.2.4 Other Robot Types
- 5.3 By Deployment
- 5.3.1 On-Device
- 5.3.2 Cloud-Based
- 5.3.3 Hybrid
- 5.4 By End-User Verticals
- 5.4.1 Logistics and Supply Chain
- 5.4.2 Manufacturing
- 5.4.3 Healthcare
- 5.4.4 Defense and Security
- 5.4.5 Automotive
- 5.4.6 Agriculture
- 5.4.7 Other End-User Verticals
- 5.5 By Geography
- 5.5.1 North America
- 5.5.1.1 United States
- 5.5.1.2 Rest of North America
- 5.5.2 Europe
- 5.5.2.1 Germany
- 5.5.2.2 France
- 5.5.2.3 Rest of Europe
- 5.5.3 Asia-Pacific
- 5.5.3.1 China
- 5.5.3.2 Japan
- 5.5.3.3 South Korea
- 5.5.3.4 India
- 5.5.3.5 Rest of Asia-Pacific
- 5.5.4 South America
- 5.5.5 Middle East and Africa
- 5.5.1 North America
6 COMPETITIVE LANDSCAPE
- 6.1 Market Concentration
- 6.2 Strategic Moves
- 6.3 Market Share Analysis
- 6.4 Company Profiles (includes Global Level Overview, Market Level Overview, Core Segments, Financials as available, Strategic Information, Market Rank/Share, Products and Services, Recent Developments)
- 6.4.1 NVIDIA Corporation
- 6.4.2 ABB Ltd
- 6.4.3 FANUC Corporation
- 6.4.4 Yaskawa Electric Corporation
- 6.4.5 KUKA AG
- 6.4.6 Boston Dynamics, Inc.
- 6.4.7 Agility Robotics, Inc.
- 6.4.8 Figure AI, Inc.
- 6.4.9 NEURA Robotics GmbH
- 6.4.10 Universal Robots A/S
- 6.4.11 Teradyne, Inc.
- 6.4.12 OMRON Corporation
- 6.4.13 Dexterity, Inc.
- 6.4.14 Covariant, Inc.
- 6.4.15 Siemens AG
7 MARKET OPPORTUNITIES AND FUTURE OUTLOOK
- 7.1 White-Space and Unmet-Need Assessment


