
|
시장보고서
상품코드
2099895
스포츠 OTT 시장 : 시장 점유율 분석, 업계 동향 및 통계, 성장 예측(2026-2031년)Sports OTT - Market Share Analysis, Industry Trends & Statistics, Growth Forecasts (2026 - 2031) |
||||||
 Mordor Intelligence
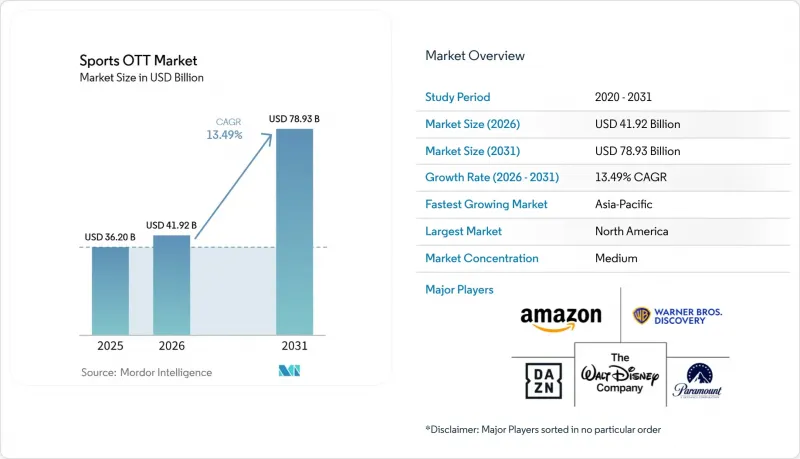
Mordor Intelligence에 의하면, 스포츠 OTT 시장 규모는 2025년에 362억 달러로 평가되었고, 2026년 419억 2,000만 달러에서 2031년까지 789억 3,000만 달러에 이를 것으로 예측되며, 예측 기간(2026-2031년) CAGR은 13.49%를 나타낼 전망입니다.
본 보고서는 수익화 모델별(SVOD, AVOD, TVOD, 하이브리드, 프리미엄), 기기 유형별(스마트폰·태블릿, 스마트 TV, 노트북·데스크톱 PC 등), 스트리밍 유형별(라이브 스트리밍, 온디맨드 스트리밍 등), 스포츠 종목별(미식축구·축구, 크리켓, 농구, 야구, 테니스, 모터스포츠, e스포츠 등) 및 지역별로 분류되어 있습니다. 시장 전망은 금액(달러) 기준으로 제시되어 있습니다.
세계의 스포츠 OTT 시장 동향 및 인사이트
OTT 플랫폼을 통한 독점 스포츠 중계권 확보 증가
프리미엄 라이브 스트리밍 서비스는 팬들이 매월 요금을 지불하는 가장 명확한 이유로 계속 남아 있기 때문에 독점 중계권은 현재 스포츠 OTT 시장에서 가입자 확보의 핵심 요소로 자리 잡고 있습니다. 아마존 프라임 비디오는 2025년 10월, 11년간의 NBA 계약에 따른 첫 시즌을 시작하며, 스트리밍 라인업에 정규 시즌 경기 66경기를 추가함으로써 농구 컨텐츠를 대폭 확충했습니다. 이어 파라마운트 스카이댄스와 TKO 그룹은 7년간 77억 달러 규모의 UFC 중계권 계약을 체결하며 새로운 기준을 세웠습니다. 이 계약에 따라 2026년부터 파라마운트+는 모든 UFC 주요 이벤트 및 ‘파이트 나이트’의 미국 내 독점 디지털 스트리밍 플랫폼이 되었습니다. 또한, ESPN의 각 플랫폼은 2025년 8월에 체결된 계약에 따라 2026년부터 ‘레슬매니아’를 포함한 모든 WWE 프리미엄 라이브 이벤트의 미국 내 독점 스트리밍 플랫폼이 되었습니다. 이러한 움직임을 종합해 보면, 스포츠 OTT 시장에서는 단순히 비독점적인 스포츠 컨텐츠를 늘리는 플랫폼보다, 꼭 봐야 할 이벤트의 스트리밍 권리를 확보한 플랫폼이 더 높이 평가된다는 사실이 드러납니다.
구독과 광고 모델을 모두 결합한 하이브리드형 수익 모델의 확대
스포츠 OTT 시장에서 하이브리드형 수익 모델이 기세를 더하고 있습니다. 이는 사업자들이 정기적인 구독 수익과 광범위한 광고 도달 범위 모두를 점점 더 필요로 하고 있기 때문입니다. 파라마운트+는 UFC의 넘버링 이벤트 및 ‘파이트 나이트’ 전 경기를 별도의 페이퍼뷰(PPV) 계층을 유지하는 대신 구독 플랜에 통합함으로써, 프리미엄 격투 스포츠에 대한 접근성을 확대했습니다. 또한, 세계복싱평의회(WBC)는 2025년 5월, DAZN과 프리미어 복싱 챔피언스(PBC)가 획기적인 합의에 도달했다고 발표했습니다. 이에 따라 주목도가 높은 ‘파이트 나이트’는 DAZN을 통해 계속 방송되는 한편, 프리미엄 페이퍼뷰(PPV) 이벤트는 프라임 비디오를 통해 시청할 수 있게 되었습니다. 디즈니는 2025년 8월 ESPN의 직접 투 컨슈머(DTC) 서비스를 시작할 때, 라이브 스포츠 네트워크와 강화된 디지털 접근성을 중심으로 한 폭넓은 월정액 패키지를 제공함으로써 이 접근 방식의 새로운 형태를 제시했습니다. 정기 이용료, 이벤트 업셀, 그리고 더 넓은 시청자층에 대한 도달을 결합함으로써, 스포츠 OTT 시장은 프리미엄 계층의 가구와 가격에 민감한 시청자 모두를 만족시킬 수 있게 되었습니다.
계속 치솟는 프리미엄 스포츠 중계권 비용
프리미엄 스포츠 중계권 비용은 급격히 상승하고 있어, 스포츠 OTT 시장의 수익성을 압박하고 있으며, 지속적으로 경쟁할 수 있는 플랫폼의 수를 줄이고 있습니다. 파라마운트 스카이댄스의 7년간 77억 달러 규모의 UFC 계약이나 아마존의 11년간 NBA 계약은 최상위급 스포츠에 대한 재정적 부담이 얼마나 커지고 있는지를 보여줍니다. 이러한 계약은 스포츠 관련 지출을 더 광범위한 미디어, 커머스 또는 생태계의 수익으로 분산시킬 수 있는 기업에 유리하게 작용합니다. 반면, 소규모 서비스 사업자에게는 손실을 흡수하거나 계약 갱신 시 과도한 비용을 지불할 여지가 거의 없습니다. 권리 보유자가 동일한 계약 기간 내에 더 광범위한 디지털 도달 범위, 더 높은 제작 품질, 그리고 더 유연한 배포를 요구할 경우, 그 압박은 더욱 커집니다. 그 결과, 스포츠 OTT 시장에서는 스포츠 컨텐츠에 대한 순수한 열의뿐만 아니라, 규모의 크기, 재무 건전성, 그리고 크로스 플랫폼 수익화가 점점 더 중요시되고 있습니다.
부문 분석
2025년 기준, SVOD는 스포츠 OTT 시장에서 42.13%의 점유율을 차지한 반면, AVOD는 2031년까지 연평균 성장률(CAGR) 14.18%를 나타낼 것으로 예측됩니다. 이러한 선두 위상은 독점적인 생중계 권리가 제공하는 강력한 견인력 덕분이며, 이를 통해 구독형 플랫폼은 시즌 전체나 주요 토너먼트를 통해 열성적인 시청자를 확실하게 확보할 수 있는 가장 확실한 수단을 여전히 장악하고 있습니다. 아마존, ESPN, 파라마운트+는 주목도가 높은 중계권 패키지를 일회성 이벤트 구매에 국한하지 않고, 보다 광범위한 디지털 구독 서비스에 통합함으로써 이 전략을 강화했습니다. 또한, 스포츠 OTT 시장은 스포츠 구독자들이 중요한 경기나 플레이오프 기간 동안 지속적으로 서비스를 이용하는 경향이 있다는 사실로부터도 혜택을 받고 있으며, 이로 인해 프리미엄 중계권은 일반적인 엔터테인먼트 컨텐츠 라이브러리의 대부분보다 구독자 유지에 있어 더 지속적인 역할을 수행하고 있습니다.
AVOD가 더 빠르게 성장하고 있는 이유는 진입 장벽을 낮추어, 처음부터 월간 프리미엄 요금을 지불하는 것을 주저하는 시청자에게도 스포츠 OTT 시장이 접근할 수 있게 되었기 때문입니다. 파라마운트+는 UFC의 넘버드 이벤트를 기본 구독 플랜에 포함시켰지만, DAZN과 프리미어 복싱 챔피언스는 구독을 통한 접근과 프라임 비디오를 통한 엄선된 프리미엄 이벤트 판매를 결합한 혼합형 구조를 유지하고 있습니다. 이러한 혼합 모델을 통해 사업자는 스포츠 OTT 시장에서 더 광범위한 사용자 기반을 바탕으로 시청자 수 확대, 광고 매출, 그리고 이벤트 단위의 수익 창출 간 균형을 맞출 여지가 넓어집니다. Stats Perform의 2026년 조사에 따르면, 스포츠 미디어 경영진의 AI 도입이 더욱 확대되고 있는 것으로 나타났으며, 이는 구독, 광고 및 혼합 수익화 모델 전반에 걸쳐 사용자 발굴 및 유지율 향상에 기여하고 있습니다.
2025년 기준, 스포츠 OTT 시장에서 스마트 TV의 점유율은 40.62%를 차지한 반면, 스마트폰 및 태블릿은 2031년까지 연평균 성장률(CAGR) 14.42%로 확대될 것으로 예측됩니다. 이러한 추세는 풀매치나 주요 이벤트, 가족이 함께 공유하는 장시간 시청에서 여전히 대형 스크린이 프리미엄 시청 환경으로서의 역할을 담당하고 있음을 보여줍니다. 디즈니는 2025년 8월 ESPN의 DTC 서비스와 강화된 버전의 앱을 출시하면서, 권리 확대와 커넥티드 TV에 대한 접근 용이성을 연계했습니다. 프리미엄 스포츠는 더 높은 화질, 풍부한 음향, 그리고 더 안정적인 공유 시청 경험의 혜택을 지속적으로 누리고 있기 때문에 스포츠 OTT 시장은 계속해서 거실 스크린을 중심으로 확대되고 있습니다.
스마트폰 및 태블릿의 보급이 가속화되고 있는 것은 팬들이 더 이상 예정된 TV 방송 시간대뿐만 아니라 하루 종일 라이브 스트리밍, 짧은 클립, 점수 중심의 시청을 기대하게 되었기 때문입니다. 스포츠 비디오 그룹(Sports Video Group)은 2026년 봄, 모바일 기기와 태블릿이 미국 스포츠 팬들 사이에서 두 번째로 많이 이용되는 시청 카테고리가 되었다고 보고했으며, 응답자의 54%가 스마트폰을 통한 세로 화면 라이브 스트리밍에 관심을 보였습니다. NBA가 새롭게 개편한 앱 역시 리그와 플랫폼이 TV와 마찬가지로 모바일 기기에서도 컨텐츠 발견, 하이라이트, 재시청을 촉진하고 있다는 더 광범위한 추세를 보여줍니다. 노트북, 데스크톱 PC, 게임기, 셋톱박스도 여전히 중요하지만, 스포츠 OTT 시장에서는 제품 설계의 초점이 커넥티드 TV 화면이나 스마트폰 화면으로 꾸준히 이동하고 있습니다.
지역별 분석
2025년, 북미는 스포츠 OTT 시장 점유율의 34.21%를 차지했습니다. 이 지역이 선두 자리를 유지할 수 있었던 것은 각 가구가 이미 프리미엄 스포츠 컨텐츠에 대한 유료 이용에 익숙해져 있었을 뿐만 아니라, 주요 사업자들이 해당 지출을 디지털 번들로 전환했기 때문입니다. 디즈니는 2025년 8월, 월 29.99달러에 ESPN의 새로운 DTC(Direct-to-Consumer) 서비스를 시작하며 12개의 ESPN 리니어 네트워크를 제공했습니다. 이러한 움직임으로 ESPN은 디지털 스포츠의 주요 플랫폼으로서의 역할을 더욱 확대했습니다. 또한 아마존도 2025년 10월 첫 NBA 독점 중계 시즌을 시작하며, 미국 내 프리미엄 농구 시청자를 둘러싼 경쟁을 격화시켰습니다. 그 결과, 북미 스포츠 OTT 시장은 더 광범위한 중계권 포트폴리오, 더 강력한 번들 상품, 그리고 더 견고한 재무 기반을 갖춘 소수의 사업자로 집중되는 방향으로 움직이고 있습니다.
아시아태평양은 2031년까지 연평균 성장률(CAGR) 15.73%로 확대될 것으로 예측되며, 스포츠 OTT 시장에서 가장 빠르게 성장하는 지역 시장이 될 전망입니다. 크리켓, 모바일 광대역, 대규모 디지털 배포가 동시에 확대되고 있어 인도는 계속해서 주요 성장 동력으로 자리 잡고 있습니다. 이러한 지역적 추세는 모바일 시청으로의 전환 가속화, 저가 진입, 그리고 성숙한 구독 가구를 넘어 대규모 시청자에게 도달할 수 있는 유연한 수익화 모델로의 전환과도 부합합니다. 그 결과, 아시아태평양의 스포츠 OTT 시장은 프리미엄 생중계 권리와 매우 광범위한 디지털 도달 범위를 어떻게 결합할 것인가라는 측면에서 전 세계의 사고방식을 점점 더 형성하고 있습니다.
2025년에도 유럽은 스포츠 OTT 시장에서 여전히 높은 가치를 지닌 영역으로 남아 있었으나, 중계권 구조와 플랫폼의 영향력은 국가별로 여전히 편차를 보였습니다. DAZN은 2025년 8월, 독일 분데스리가 콘퍼런스의 토요일 오후 중계권을 일요일 경기 포트폴리오에 더해 확보했다고 발표했습니다. 이는 국내 축구 중계권 협상에서 스트리밍 플랫폼이 더욱 중요한 역할을 하고 있음을 뒷받침하는 사례입니다. 남미, 중동 및 아프리카 역시 스트리밍으로의 전환을 가속화하고 있지만, 그 보급 양상은 단일한 지역 횡단적 모델이라기보다는 주요 축구 중계권, 커넥티드 TV의 성장, 그리고 모바일 접속의 보급 상황에 따라 더 명확하게 형성되고 있습니다. 이러한 지역들을 종합적으로 살펴보면, 스포츠 OTT 시장은 서로 다른 경로를 통해 확대되고 있으며, 성숙한 국가들은 프리미엄 번들에, 신흥 시장은 접근성, 기기 보급 범위 및 광고 수익을 통한 시청에 중점을 두고 있음을 알 수 있습니다.
기타 혜택 :
- 엑셀 형식 시장 예측(ME) 시트
- 3개월간의 애널리스트 지원
자주 묻는 질문
목차
제1장 서론
제2장 조사 방법
제3장 주요 요약
제4장 시장 구도
제5장 시장 규모 및 성장 예측
제6장 경쟁 구도
제7장 시장 기회 및 향후 전망
AJY 26.08.11According to Mordor Intelligence, the sports OTT market size was valued at USD 36.20 billion in 2025 and estimated to grow from USD 41.92 billion in 2026 to reach USD 78.93 billion by 2031, at a CAGR of 13.49% during the forecast period (2026-2031).
This report is Segmented by Monetization Model (SVOD, AVOD, TVOD, Hybrid, and Freemium), Device Type (Smartphones and Tablets, Smart TVs, Laptops and Desktops, and More), Streaming Type (Live Streaming, On-Demand Streaming, and More), Sport Type (Football and Soccer, Cricket, Basketball, Baseball, Tennis, Motorsport, Esports, and More), and Geography. The Market Forecasts are Provided in Terms of Value (USD).
Global Sports OTT Market Trends and Insights
Rising Exclusive Sports Rights Acquisitions by OTT Platforms
Exclusive rights are now central to subscriber acquisition in the sports OTT market because premium live windows remain the clearest reason for fans to pay every month. Amazon Prime Video launched its first season under the 11-year NBA agreement in October 2025, adding 66 regular-season games to its streaming lineup and materially deepening its basketball offering. Paramount Skydance and TKO Group then set a new benchmark with a 7-year, USD 7.7 billion UFC rights agreement, under which Paramount+ became the exclusive US digital home for all UFC numbered events and Fight Nights from 2026. ESPN platforms also became the exclusive US domestic home for all WWE Premium Live Events, including WrestleMania, beginning in 2026 under the August 2025 agreement. Taken together, these moves show that the sports OTT market rewards platforms that secure access to must-watch events rather than those that simply add more nonexclusive sports content.
Growth of Hybrid Monetization Across Subscription and Advertising Models
Hybrid monetization is gaining ground in the sports OTT market because operators increasingly need both recurring subscription income and broad advertising reach. Paramount+ folded all UFC numbered events and Fight Nights into the subscription offer rather than preserving a separate pay-per-view layer, thereby widening access to premium combat sports. The World Boxing Council also announced in May 2025 that DAZN and Premier Boxing Champions had reached a landmark agreement that kept marquee fight nights on DAZN while leaving premium pay-per-view events available through Prime Video. Disney added another version of this approach when it launched ESPN's direct-to-consumer service in August 2025 with a broad monthly package built around live sports networks and enhanced digital access. This mix of recurring fees, event upsell, and wider audience reach is helping the sports OTT market serve both premium households and viewers who are more price-sensitive.
High and Rising Costs of Premium Sports Rights
Premium rights costs are rising fast enough to tighten the economics of the sports OTT market and to narrow the field of platforms that can compete consistently. Paramount Skydance's 7-year, USD 7.7 billion UFC agreement and Amazon's 11-year NBA deal show how large the financial commitments for top-tier sports have become. These deals favor companies that can spread sports spending across broader media, commerce, or ecosystem revenues, while smaller services have much less room to absorb losses or overpay for renewals. The pressure is even greater when rights holders want wider digital reach, stronger production quality, and more flexible distribution from the same contract cycle. As a result, the sports OTT market is increasingly rewarding scale, balance-sheet strength, and cross-platform monetization rather than pure appetite for sports content alone.
Other drivers and restraints analyzed in the detailed report include:
- Increasing Mobile-First Sports Consumption and Second Screen Viewing
- Expansion of Low-Latency and Interactive Streaming Capabilities
- Piracy and Unauthorized Restreaming of Live Sports Events
For complete list of drivers and restraints, kindly check the Table Of Contents.
Segment Analysis
SVOD held 42.13% share of the sports OTT market in 2025, while AVOD is projected to grow at a 14.18% CAGR through 2031. The lead came from the strong pull of exclusive live rights, which still gives subscription platforms the clearest way to lock in committed viewers across full seasons and major tournaments. Amazon, ESPN, and Paramount+ each reinforced this logic by tying headline rights packages to broader digital subscriptions instead of limiting access to stand-alone event purchases. The sports OTT market also benefits from the fact that sports subscribers tend to remain active through key matches and playoffs, which gives premium rights a more durable retention role than most general entertainment libraries.
AVOD is rising faster because it lowers the entry barrier and allows the sports OTT market to reach viewers who may not commit to premium monthly fees from the start. Paramount+ moved UFC numbered events into the base subscription offer, while DAZN and Premier Boxing Champions maintained a mixed structure combining subscription access with selective premium-event sales through Prime Video. That blend gives operators more room to balance audience growth, advertising sales, and event-level monetization across a broader user base in the sports OTT market. Stats Perform's 2026 survey also showed wider AI adoption by sports media executives, which supports better discovery and retention across subscription, advertising, and mixed monetization structures.
Smart TVs accounted for 40.62% share of the sports OTT market in 2025, while Smartphones and Tablets are projected to advance at a 14.42% CAGR through 2031. That lead shows that the largest screen still carries the premium viewing role for full matches, tentpole events, and longer sessions shared across households. Disney linked rights expansion with easier connected-TV access when it launched ESPN's direct-to-consumer service and enhanced app in August 2025. The sports OTT market continues to build around the living-room screen because premium sports still benefits from better picture quality, fuller sound, and a more stable shared viewing experience.
Smartphones and tablets are moving faster because fans now expect live access, short clips, and score-driven viewing throughout the day rather than only during planned television sessions. Sports Video Group said in Spring 2026 that mobile and tablet devices had become the second-most-used viewing category among US sports fans, while 54% of respondents showed interest in vertical live streams on phones. The NBA's reworked app also points to a wider pattern in which leagues and platforms are shaping discovery, highlights, and repeat engagement across handheld devices as much as on television. Laptops, desktops, consoles, and set-top boxes still matter, but the sports OTT market is steadily centering product design on the connected-TV screen and the smartphone screen.
Complete Report Scope:
- By Monetization Model
- SVOD
- AVOD
- TVOD
- Hybrid
- Freemium
- By Device Type
- Smartphones and Tablets
- Smart TVs
- Laptops and Desktops
- Other Device Types
- By Streaming Type
- Live Streaming
- On-demand Streaming
- Other Streaming Types
- By Sport Type
- Football and Soccer
- Cricket
- Basketball
- Baseball
- Tennis
- Motorsport
- Esports
- Other Sports Types
- By Geography
- North America
- United States
- Canada
- Mexico
- South America
- Brazil
- Argentina
- Chile
- Rest of South America
- Europe
- Germany
- United Kingdom
- France
- Italy
- Spain
- Rest of Europe
- Asia-Pacific
- China
- Japan
- India
- South Korea
- Australia
- Rest of Asia-Pacific
- Middle East
- Saudi Arabia
- United Arab Emirates
- Qatar
- Rest of Middle East
- Africa
- South Africa
- Egypt
- Nigeria
- Rest of Africa
- North America
Geography Analysis
North America held 34.21% of the sports OTT market share in 2025. The region stayed ahead because households were already accustomed to paying for premium sports access, and major operators shifted that spending into digital bundles. Disney launched ESPN's new direct-to-consumer service in August 2025 at USD 29.99 per month with 12 ESPN linear networks, and the same move broadened ESPN's role as a digital sports destination. Amazon also launched its first exclusive NBA season in October 2025, sharpening competition for premium basketball viewers in the United States. The sports OTT market in North America is therefore moving toward fewer operators with broader rights portfolios, stronger bundles, and deeper financial capacity.
Asia-Pacific is projected to expand at a 15.73% CAGR through 2031, making it the fastest-growing regional market for sports OTT. India remains the main growth engine because cricket, mobile broadband, and mass digital distribution are scaling simultaneously. This regional pattern also fits the stronger shift toward mobile viewing, lower entry price points, and flexible monetization models that can reach large audiences beyond mature subscription households. As a result, the sports OTT market in Asia-Pacific is increasingly shaping global thinking on how to combine premium live rights with very large digital reach.
Europe remained a high-value part of the sports OTT market in 2025, although rights structures and platform strength continued to vary by country. DAZN said in August 2025 that it had added the Bundesliga Konferenz Saturday afternoon rights in Germany alongside its Sunday match portfolio, which confirmed the stronger role of streaming platforms in national football negotiations. South America and the Middle East and Africa are also moving deeper into streaming, but adoption patterns are shaped more clearly by major football rights, connected-TV growth, and the strength of mobile access than by a single region-wide model. Taken together, these regions show that the sports OTT market is expanding through different routes, with mature countries leaning on premium bundling and emerging markets leaning on access, device reach, and ad-supported viewing.
- Amazon.com, Inc.
- The Walt Disney Company
- DAZN Group Limited
- Warner Bros. Discovery, Inc.
- Paramount Skydance Corporation
- Fox Corporation
- Netflix, Inc.
- Apple Inc.
- Comcast Corporation
- Alphabet Inc.
- NFL Enterprises LLC
- Liberty Media Corporation
- PCCW Limited
- Telefonica, S.A.
- beIN Media Group LLC
- JioStar India Private Limited
- FloSports, Inc.
- Sony Group Corporation
- CANAL+ S.A.
- Viaplay Group AB
Additional Benefits:
- The market estimate (ME) sheet in Excel format
- 3 months of analyst support
TABLE OF CONTENTS
1 INTRODUCTION
- 1.1 Study Assumptions And Market Definition
- 1.2 Scope Of The Study
2 RESEARCH METHODOLOGY
3 EXECUTIVE SUMMARY
4 MARKET LANDSCAPE
- 4.1 Market Overview
- 4.2 Market Drivers
- 4.2.1 Rising Exclusive Sports Rights Acquisitions by OTT Platforms
- 4.2.2 Growth of Hybrid Monetization Across Subscription and Advertising Models
- 4.2.3 Increasing Mobile-First Sports Consumption and Second-Screen Viewing
- 4.2.4 Expansion of Low-Latency and Interactive Streaming Capabilities
- 4.2.5 Rising Integration of Personalized Highlights and AI-Driven Discovery
- 4.2.6 Growth of Direct-to-Consumer League and Team-Owned Platforms
- 4.3 Market Restraints
- 4.3.1 High and Rising Costs of Premium Sports Rights
- 4.3.2 Piracy and Unauthorized Restreaming of Live Sports Events
- 4.3.3 Churn Pressure from Fragmented Rights Across Multiple Platforms
- 4.3.4 Latency, QoE, and Peak-Load Reliability Challenges During Live Events
- 4.4 Industry Value Chain Analysis
- 4.5 Regulatory Landscape
- 4.6 Technological Outlook
- 4.7 Porter's Five Forces Analysis
- 4.7.1 Bargaining Power of Buyers
- 4.7.2 Bargaining Power of Suppliers
- 4.7.3 Threat of New Entrants
- 4.7.4 Threat of Substitutes
- 4.7.5 Intensity of Competitive Rivalry
- 4.8 Impact of Macroeconomic Factors on the Market
5 MARKET SIZE AND GROWTH FORECASTS (VALUE)
- 5.1 By Monetization Model
- 5.1.1 SVOD
- 5.1.2 AVOD
- 5.1.3 TVOD
- 5.1.4 Hybrid
- 5.1.5 Freemium
- 5.2 By Device Type
- 5.2.1 Smartphones and Tablets
- 5.2.2 Smart TVs
- 5.2.3 Laptops and Desktops
- 5.2.4 Other Device Types
- 5.3 By Streaming Type
- 5.3.1 Live Streaming
- 5.3.2 On-demand Streaming
- 5.3.3 Other Streaming Types
- 5.4 By Sport Type
- 5.4.1 Football and Soccer
- 5.4.2 Cricket
- 5.4.3 Basketball
- 5.4.4 Baseball
- 5.4.5 Tennis
- 5.4.6 Motorsport
- 5.4.7 Esports
- 5.4.8 Other Sports Types
- 5.5 By Geography
- 5.5.1 North America
- 5.5.1.1 United States
- 5.5.1.2 Canada
- 5.5.1.3 Mexico
- 5.5.2 South America
- 5.5.2.1 Brazil
- 5.5.2.2 Argentina
- 5.5.2.3 Chile
- 5.5.2.4 Rest of South America
- 5.5.3 Europe
- 5.5.3.1 Germany
- 5.5.3.2 United Kingdom
- 5.5.3.3 France
- 5.5.3.4 Italy
- 5.5.3.5 Spain
- 5.5.3.6 Rest of Europe
- 5.5.4 Asia-Pacific
- 5.5.4.1 China
- 5.5.4.2 Japan
- 5.5.4.3 India
- 5.5.4.4 South Korea
- 5.5.4.5 Australia
- 5.5.4.6 Rest of Asia-Pacific
- 5.5.5 Middle East
- 5.5.5.1 Saudi Arabia
- 5.5.5.2 United Arab Emirates
- 5.5.5.3 Qatar
- 5.5.5.4 Rest of Middle East
- 5.5.6 Africa
- 5.5.6.1 South Africa
- 5.5.6.2 Egypt
- 5.5.6.3 Nigeria
- 5.5.6.4 Rest of Africa
- 5.5.1 North America
6 COMPETITIVE LANDSCAPE
- 6.1 Market Concentration
- 6.2 Strategic Moves
- 6.3 Vendor Positioning Analysis
- 6.4 Company Profiles (includes Global Level Overview, Market Level Overview, Core Segments, Financials as available, Strategic Information, Market Rank/Share, Products and Services, Recent Developments)
- 6.4.1 Amazon.com, Inc.
- 6.4.2 The Walt Disney Company
- 6.4.3 DAZN Group Limited
- 6.4.4 Warner Bros. Discovery, Inc.
- 6.4.5 Paramount Skydance Corporation
- 6.4.6 Fox Corporation
- 6.4.7 Netflix, Inc.
- 6.4.8 Apple Inc.
- 6.4.9 Comcast Corporation
- 6.4.10 Alphabet Inc.
- 6.4.11 NFL Enterprises LLC
- 6.4.12 Liberty Media Corporation
- 6.4.13 PCCW Limited
- 6.4.14 Telefonica, S.A.
- 6.4.15 beIN Media Group LLC
- 6.4.16 JioStar India Private Limited
- 6.4.17 FloSports, Inc.
- 6.4.18 Sony Group Corporation
- 6.4.19 CANAL+ S.A.
- 6.4.20 Viaplay Group AB
7 MARKET OPPORTUNITIES AND FUTURE OUTLOOK
- 7.1 White-Space and Unmet-Need Assessment