

|
시장보고서
상품코드
2100548
자동 자재 취급(AMH) 시장 : 점유율 분석, 업계 동향 및 통계, 성장 예측(2026-2031년)Automated Material Handling (AMH) - Market Share Analysis, Industry Trends & Statistics, Growth Forecasts (2026 - 2031) |
||||||
 Mordor Intelligence
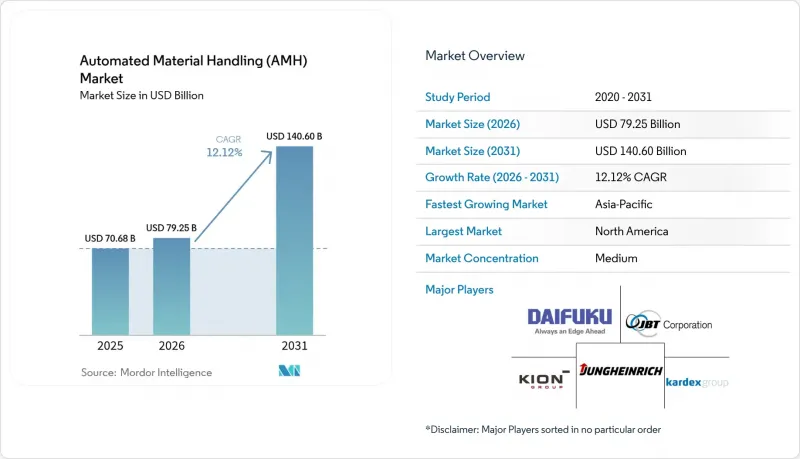
자동 자재 취급 시장 규모는 2025년에 706억 8,000만 달러로 평가되었고 2026년 792억 5,000만 달러에서 2031년까지 1,406억 달러에 이를 것으로 예측되며, 예측 기간(2026-2031년) CAGR은 12.12%를 나타낼 전망입니다.
본 보고서에서는 업계를 제품 유형(하드웨어, 소프트웨어, 서비스), 장비 유형(이동 로봇, 자동 창고 시스템, 자동 컨베이어 등), 최종 사용자(공항, 자동차, 식품 및 음료, 소매·창고 및 물류, 일반 제조업 등), 기능(보관, 운반·견인, 피킹·배치 등), 지역별로 분류하고 있습니다.
전 세계 자동 자재 취급(AMH) 시장 동향과 인사이트
전자상거래 주문 처리 수요 급증
마이크로 주문 처리 센터는 주문 처리의 경제성을 획기적으로 변화시켜, 불과 2,000제곱피트의 공간에서도 2시간 이내 배송을 실현했습니다. 셔틀 자동화를 도입한 식료품 체인에서는 수작업으로는 달성할 수 없는 99.99%의 정확도로 하루 5,000건의 주문 라인을 처리했습니다. 식품 및 음료 부문에서는 HACCP 요건을 충족하기 위해 온도 관리 기능을 갖춘 자동화 시스템이 도입되었습니다. 소비자 직접 판매(D2C) 모델의 부상으로 계절적 SKU 급증에 대응할 수 있는 유연한 시스템에 대한 수요가 높아지면서, 자동화는 단순한 비용 절감 수단에서 경쟁적 차별화 요인으로 변모했습니다. 라스트 마일 거점을 자동화한 소매업체들은 기존 창고에서는 유지할 수 없었던 배송 약속을 이행함으로써 고객 충성도를 확보했습니다.
브라운필드 공장에서의 인더스트리 4.0 관련 설비 투자 주기.
제조업체는 기존 자재 취급 자산에 사이버-물리 시스템을 통합하여 하이브리드 워크플로를 구축했습니다. 이를 통해 조립 라인의 효율을 33% 향상시키는 동시에 인건비를 64% 절감했습니다. 디지털 트윈을 활용한 시뮬레이션을 통해 가동 중단 위험이 감소하고 자본 배분이 최적화되었습니다. 제약 시설에서는 첨단 브라운필드 개조를 통해 GMP 준수 및 온도 관리의 무결성을 유지하면서 보관 용량을 60% 확대했습니다. 이처럼 제2차 설비 투자 사이클은 설비의 전면적인 교체가 아닌 상호 운용성과 확장성에 중점을 두었기 때문에 성숙한 공장에서도 기존 공정을 해체하지 않고도 인더스트리 4.0의 이점을 누릴 수 있게 되었습니다.
초기 통합 및 개조 비용의 높음
창고의 종합적인 자동화에는 200만-400만 달러가 필요했으며, 이는 중견 기업에게 장벽이 되었습니다. 브라운필드 현장에서는 설치 작업 중에도 가동을 계속해야 했기 때문에 복잡성이 증가했고, 맞춤형 인터페이스 비용이 급증했습니다. BALYO와 같은 'Robotics-as-a-Service(RaaS)' 방식은 자본 지출을 줄이고, 성과 연동형 청구 제도 하에서 30%의 운영 비용 절감을 약속했습니다. 그러나 락인(lock-in)에 대한 우려와 높은 수명 주기 비용으로 인해 도입에 있어 여전히 신중한 태도가 나타났습니다. 온도 관리가 필요한 환경에서는 필요한 자본이 2배로 불어났고, 중소기업은 규모를 희생하더라도 합리적인 가격을 실현할 수 있는 모듈식 도입을 선택하게 되었습니다.
부문 분석
2025년에는 컨베이어, AS/RS, 로봇이 설비 투자 예산의 주축이 되면서 하드웨어가 매출의 61.60%를 차지했으나, 소프트웨어는 2031년까지 연평균 성장률(CAGR) 18.30%를 기록했습니다. AI 기반 오케스트레이션이 보급됨에 따라, 자동 자재 취급 시장의 소프트웨어 시장 규모는 급격히 확대될 것으로 예측됩니다. 서비스 부문은 규모는 가장 작았지만, 가동 시간을 확보하기 위한 통합 및 예방 정비 계약을 통해 지속적인 수익을 확보했습니다.
소프트웨어의 급속한 성장은 자재 취급 업계가 지능형 의사 결정으로 중심을 옮기고 있음을 반영합니다. SaaS를 통한 제공으로 하드웨어 교체 없이도 지속적인 업데이트가 가능해졌습니다. 창고 관리 소프트웨어와 연동된 디지털 트윈은 가동 중지 시간을 25% 줄이고 에너지 부하 균형을 최적화함으로써 다국적 기업의 시설에서 투자 수익률(ROI)을 향상시켰습니다.
이동 로봇은 2025년 장비 매출의 34.65%를 차지하며, 자율 이동 로봇(AMR)은 2031년까지 연평균 성장률(CAGR) 26.20%로 급성장하고 있습니다. 자동 창고 시스템(AS/RS)은 고밀도 보관을 통해 시장 점유율을 유지하고 있으며, 컨베이어는 곳곳에서 자재 흐름을 실현했습니다.
AMR의 인프라가 필요 없는 내비게이션 덕분에 도입 시간이 단축되고 유연한 확장성이 실현되었습니다. 그 대표적인 사례가 DHL의 5,000대 도입으로, 이는 현재 시점에서 최대 규모의 AMR 프로젝트입니다. 팔레타이저 및 분류 시스템이 차지하는 자동 자재 취급 시장 점유율은 전자상거래 처리량 증가에 힘입어 꾸준히 확대되었습니다. 또한, SKU의 다양한 형태에 대응하는 컴퓨터 비전 기술의 발전도 이러한 성장을 뒷받침했습니다.
지역별 분석
아시아태평양은 2025년 매출의 45.85%를 차지하며, 2031년까지 연평균 성장률(CAGR) 12.55%로 성장하고 있습니다. 이는 전 세계 창고 로봇 생산 대수의 52%를 차지하는 중국과, 크로스보더 전자상거래 수요에 힘입은 결과입니다. 각 지역 정부는 자동화를 지원하고 있으며, 그 예로 다이후쿠(Daifuku)사의 인도 신공장과 JD 로지스틱스(JD Logistics)사의 첨단 멜버른 허브를 들 수 있습니다. 통합된 공급망을 통해 하드웨어 비용과 도입 기간이 단축되어, 현지 도입 기업들에게 비용 면에서의 우위를 가져다주었습니다.
북미는 2위를 차지했으며, 5,000대의 로봇을 배치한 아마존의 콜로라도주 소재 350만 제곱피트 규모의 센터 등 대규모 로봇 시설이 특징이었습니다. 월마트의 5개 첨단 신선식품 물류 센터는 처리 능력을 2배로 확대하는 동시에 2,000개의 일자리를 창출하며, 해당 지역 내 기존 시설의 전환 속도를 입증했습니다. 지속가능성 관련 규제로 인해 물류 네트워크 전반에 걸쳐 에너지 효율이 높은 개보수 작업이 진행되었습니다.
유럽에서의 도입은 ESG 기준을 준수하는 솔루션과 인더스트리 4.0의 융합에 중점을 두었습니다. REWE사의 마그데부르크 시설에서는 엄격한 환경 기준 하에 하루 28만 6,000개의 화물을 처리했으며, 데마틱(Dematic)사와 그루브 로베르(Groove Robert)사의 제휴를 통해 퀘벡주에서 완전 자동화된 냉장 창고가 선구적으로 도입되어 기술 수출의 실례가 되었습니다. '기업 지속가능성 보고 지침'에 따라 측정 가능한 탄소 감축 목표가 설정되었으며, 재생에너지를 활용하는 창고에 대한 투자가 촉진되었습니다.
기타 혜택:
- 엑셀 형식 시장 예측(ME) 시트
- 3개월간의 애널리스트 지원
자주 묻는 질문
목차
제1장 서론
제2장 조사 방법
제3장 주요 요약
제4장 시장 구도
제5장 시장 세분화
제6장 경쟁 구도
제7장 시장 기회와 향후 전망
JHS 26.08.11According to Mordor Intelligence, the automated material handling market size was valued at USD 70.68 billion in 2025 and estimated to grow from USD 79.25 billion in 2026 to reach USD 140.6 billion by 2031, at a CAGR of 12.12% during the forecast period (2026-2031).
This report Segments the Industry Into Product Type (Hardware, Software, and Services), Equipment Type (Mobile Robots, Automated Storage and Retrieval Systems, Automated Conveyors, and More), End User (Airports, Automotive, Food and Beverages, Retail/Warehousing/Distribution, General Manufacturing, and More), Function (Storage, Transport and Tow, Picking and Placing, and More), and Geography.
Global Automated Material Handling (AMH) Market Trends and Insights
E-commerce Fulfillment Intensity Surge
Micro-fulfillment centers reshaped order-fulfillment economics, enabling 2-hour delivery windows in spaces as small as 2,000 ft2 Grocery chains using shuttle automation processed 5,000 order lines daily at 99.99% accuracy levels unattainable with manual. The food and beverage sector integrated temperature-controlled automation to satisfy HACCP requirements. Direct-to-consumer models intensified demand for flexible systems able to scale with seasonal SKU spikes, transforming automation from a cost lever into a competitive differentiator. Retailers that automated last-mile nodes secured customer loyalty by meeting delivery promises that traditional warehouses could not sustain.
Industry 4.0-Linked Capex Cycles in Brown-Field Plants.
Manufacturers layered cyber-physical systems onto legacy material-handling assets, creating hybrid workflows that lifted assembly-line efficiency by 33% while cutting labor costs 64%. Digital twin simulations reduced downtime risk and sharpened capital allocation. Pharmaceutical facilities expanded storage capacity 60% while maintaining GMP compliance and temperature integrity through sophisticated brownfield retrofits. The second-wave capex cycle thus focused on interoperability and scalability rather than wholesale equipment replacement, allowing mature plants to unlock Industry 4.0 benefits without dismantling existing flows.
High Upfront Integration and Retrofit Costs
Comprehensive warehouse automation required USD 2-4 million, a hurdle for mid-market firms. Brownfield sites faced added complexity as operations continued during installation, inflating custom-interface expenses. Robotics-as-a-Service schemes such as BALYO's reduced capital outlays and promised 30% opex savings under performance-based invoicing. Yet adoption remained cautious due to lock-in fears and higher lifetime costs. Temperature-controlled environments saw capital needs double, prompting SMEs to adopt modular deployments that trade scale for affordability.
Other drivers and restraints analyzed in the detailed report include:
- Labor Shortages in OECD Logistics Hubs
- ESG-Driven Demand for Energy-Efficient Intralogistics
- Cyber-Physical Security Vulnerabilities
For complete list of drivers and restraints, kindly check the Table Of Contents.
Segment Analysis
Hardware commanded 61.60% revenue in 2025 as conveyors, AS/RS, and robots anchored capital budgets, while software posted a 18.30% CAGR through 2031. The automated material handling market size for software is projected to climb sharply as AI-based orchestration gains acceptance. Services, though smallest, secured recurring revenue via integration and preventive maintenance contracts that ensured uptime.
The software boom mirrored the automated material handling industry's pivot toward intelligent decision-making. SaaS delivery allowed continuous updates without hardware swaps. Digital twins linked to warehouse-control software reduced downtime 25% and optimized energy load balancing, enhancing ROI at multinational facilities.
Mobile robots captured 34.65% of 2025 equipment revenue, and Autonomous Mobile Robots are accelerating at 26.20% CAGR to 2031. Automated Storage and Retrieval Systems retained share through high-density storage, while conveyors provided ubiquitous material flow.
AMRs' infrastructure-free navigation lowered deployment time and delivered flexible scaling, exemplified by DHL's 5,000-unit rollout-the largest AMR project to date. The automated material handling market share held by palletizers and sortation systems grew steadily, thanks to e-commerce volumes, aided by computer-vision upgrades that accommodated SKU shape diversity.
Complete Report Scope:
- By Product Type
- Hardware
- Software
- Services
- By Equipment Type
- Mobile Robots
- Automated Guided Vehicles (AGV)
- Autonomous Mobile Robots (AMR)
- Automated Storage and Retrieval Systems
- Fixed-Aisle
- Carousel
- Vertical Lift Module
- Automated Conveyors
- Belt
- Roller
- Pallet
- Overhead
- Palletizers
- Conventional
- Robotic
- Sortation Systems
- Mobile Robots
- By End User
- Airports
- Automotive
- Food and Beverages
- Retail / Warehousing / Distribution
- General Manufacturing
- Pharmaceuticals
- Post and Parcel
- Others
- By Function
- Storage
- Transport and Tow
- Picking and Placing
- Sorting
- Packaging and Palletising
- By Geography
- North America
- United States
- Canada
- Mexico
- South America
- Brazil
- Argentina
- Rest of South America
- Europe
- Germany
- United Kingdom
- France
- Italy
- Russia
- Rest of Europe
- Asia-Pacific
- China
- Japan
- South Korea
- India
- ASEAN
- Rest of Asia-Pacific
- Middle East and Africa
- Middle East
- Saudi Arabia
- United Arab Emirates
- Turkey
- Rest of Middle East
- Africa
- South Africa
- Nigeria
- Rest of Africa
- Middle East
- North America
Geography Analysis
Asia-Pacific accounted for 45.85% 2025 revenue and is growing at 12.55% CAGR through 2031, propelled by China's 52% share of global warehouse-robot output and cross-border e-commerce demand. Regional governments supported automation, illustrated by Daifuku's new Indian plant and JD Logistics' high-tech Melbourne hub. Integrated supply chains reduced hardware costs and deployment times, giving local adopters a cost edge.
North America ranked second, featuring large-scale robotics facilities such as Amazon's 3.5 million ft2 Colorado center, hosting 5,000 robots. Walmart's five high-tech perishable distribution centers doubled throughput while creating 2,000 jobs, demonstrating the region's brownfield transformation pace. Sustainability mandates spurred energy-efficient retrofits across logistics networks.
Europe's adoption focused on ESG-compliant solutions and Industry 4.0 convergence. REWE's Magdeburg facility processed 286,000 packages daily under strict environmental standards, and Dematic's partnership with Groupe Robert pioneered fully automated cold storage in Quebec, showcasing technology exports. The Corporate Sustainability Reporting Directive drove measurable carbon-reduction targets, encouraging investment in renewable-powered warehouses.
- Daifuku Co., Ltd.
- KION Group AG (Dematic GmbH)
- Honeywell Intelligrated, Inc.
- SSI SCHAFER Group
- TGW Logistics Group GmbH
- Kardex Holding AG
- JBT Corporation
- Jungheinrich AG
- KNAPP AG
- Mecalux, S.A.
- System Logistics S.p.A.
- viastore SYSTEMS GmbH
- BEUMER Group GmbH & Co. KG
- Interroll Holding AG
- WITRON Logistik + Informatik GmbH
- Siemens AG
- KUKA AG
- Murata Machinery, Ltd.
- Toyota Industries Corporation
- VisionNav Robotics Co., Ltd.
- AutoStore Holdings Ltd.
- Locus Robotics Corp.
- Vanderlande Industries B.V.
- GreyOrange Pte. Ltd.
- Amazon Robotics LLC
Additional Benefits:
- The market estimate (ME) sheet in Excel format
- 3 months of analyst support
TABLE OF CONTENTS
1 INTRODUCTION
- 1.1 Study Assumptions and Market Definition
- 1.2 Scope of the Study
2 RESEARCH METHODOLOGY
3 EXECUTIVE SUMMARY
4 MARKET LANDSCAPE
- 4.1 Market Overview
- 4.2 Market Drivers
- 4.2.1 E-commerce fulfilment intensity surge
- 4.2.2 Industry 4.0-linked capex cycles in brown-field plants
- 4.2.3 Labour shortages in OECD logistics hubs
- 4.2.4 ESG-driven demand for energy-efficient intralogistics
- 4.2.5 Battery-as-a-Service (BaaS) models for mobile robots
- 4.2.6 Micro-fulfilment centre roll-outs by grocery chains
- 4.3 Market Restraints
- 4.3.1 High upfront integration and retro-fit costs
- 4.3.2 Cyber-physical security vulnerabilities
- 4.3.3 Scarcity of automation-literate technicians
- 4.3.4 Volatile rare-earth and steel prices
- 4.4 Evaluation of Critical Regulatory Framework
- 4.5 Value Chain Analysis
- 4.6 Technological Outlook
- 4.7 Porter's Five Forces
- 4.7.1 Bargaining Power of Suppliers
- 4.7.2 Bargaining Power of Buyers
- 4.7.3 Threat of New Entrants
- 4.7.4 Threat of Substitutes
- 4.7.5 Competitive Rivalry
- 4.8 Impact Assessment of Key Stakeholders
- 4.9 Key Use Cases and Case Studies
- 4.10 Impact on Macroeconomic Factors of the Market
- 4.11 Investment Analysis
5 MARKET SEGMENTATION
- 5.1 By Product Type
- 5.1.1 Hardware
- 5.1.2 Software
- 5.1.3 Services
- 5.2 By Equipment Type
- 5.2.1 Mobile Robots
- 5.2.1.1 Automated Guided Vehicles (AGV)
- 5.2.1.2 Autonomous Mobile Robots (AMR)
- 5.2.2 Automated Storage and Retrieval Systems
- 5.2.2.1 Fixed-Aisle
- 5.2.2.2 Carousel
- 5.2.2.3 Vertical Lift Module
- 5.2.3 Automated Conveyors
- 5.2.3.1 Belt
- 5.2.3.2 Roller
- 5.2.3.3 Pallet
- 5.2.3.4 Overhead
- 5.2.4 Palletizers
- 5.2.4.1 Conventional
- 5.2.4.2 Robotic
- 5.2.5 Sortation Systems
- 5.2.1 Mobile Robots
- 5.3 By End User
- 5.3.1 Airports
- 5.3.2 Automotive
- 5.3.3 Food and Beverages
- 5.3.4 Retail / Warehousing / Distribution
- 5.3.5 General Manufacturing
- 5.3.6 Pharmaceuticals
- 5.3.7 Post and Parcel
- 5.3.8 Others
- 5.4 By Function
- 5.4.1 Storage
- 5.4.2 Transport and Tow
- 5.4.3 Picking and Placing
- 5.4.4 Sorting
- 5.4.5 Packaging and Palletising
- 5.5 By Geography
- 5.5.1 North America
- 5.5.1.1 United States
- 5.5.1.2 Canada
- 5.5.1.3 Mexico
- 5.5.2 South America
- 5.5.2.1 Brazil
- 5.5.2.2 Argentina
- 5.5.2.3 Rest of South America
- 5.5.3 Europe
- 5.5.3.1 Germany
- 5.5.3.2 United Kingdom
- 5.5.3.3 France
- 5.5.3.4 Italy
- 5.5.3.5 Russia
- 5.5.3.6 Rest of Europe
- 5.5.4 Asia-Pacific
- 5.5.4.1 China
- 5.5.4.2 Japan
- 5.5.4.3 South Korea
- 5.5.4.4 India
- 5.5.4.5 ASEAN
- 5.5.4.6 Rest of Asia-Pacific
- 5.5.5 Middle East and Africa
- 5.5.5.1 Middle East
- 5.5.5.1.1 Saudi Arabia
- 5.5.5.1.2 United Arab Emirates
- 5.5.5.1.3 Turkey
- 5.5.5.1.4 Rest of Middle East
- 5.5.5.2 Africa
- 5.5.5.2.1 South Africa
- 5.5.5.2.2 Nigeria
- 5.5.5.2.3 Rest of Africa
- 5.5.5.1 Middle East
- 5.5.1 North America
6 COMPETITIVE LANDSCAPE
- 6.1 Market Concentration
- 6.2 Strategic Moves
- 6.3 Market Share Analysis
- 6.4 Company Profiles {(includes Global level Overview, Market level overview, Core Segments, Financials as available, Strategic Information, Market Rank/Share for key companies, Products and Services, and Recent Developments)}
- 6.4.1 Daifuku Co., Ltd.
- 6.4.2 KION Group AG (Dematic GmbH)
- 6.4.3 Honeywell Intelligrated, Inc.
- 6.4.4 SSI SCHAFER Group
- 6.4.5 TGW Logistics Group GmbH
- 6.4.6 Kardex Holding AG
- 6.4.7 JBT Corporation
- 6.4.8 Jungheinrich AG
- 6.4.9 KNAPP AG
- 6.4.10 Mecalux, S.A.
- 6.4.11 System Logistics S.p.A.
- 6.4.12 viastore SYSTEMS GmbH
- 6.4.13 BEUMER Group GmbH & Co. KG
- 6.4.14 Interroll Holding AG
- 6.4.15 WITRON Logistik + Informatik GmbH
- 6.4.16 Siemens AG
- 6.4.17 KUKA AG
- 6.4.18 Murata Machinery, Ltd.
- 6.4.19 Toyota Industries Corporation
- 6.4.20 VisionNav Robotics Co., Ltd.
- 6.4.21 AutoStore Holdings Ltd.
- 6.4.22 Locus Robotics Corp.
- 6.4.23 Vanderlande Industries B.V.
- 6.4.24 GreyOrange Pte. Ltd.
- 6.4.25 Amazon Robotics LLC
7 MARKET OPPORTUNITIES AND FUTURE OUTLOOK
- 7.1 White-space and Unmet-Need Assessment


