

|
시장보고서
상품코드
2100728
아프리카의 특수 비료 시장 : 시장 점유율 분석, 업계 동향 및 통계, 성장 예측(2026-2031년)Africa Specialty Fertilizers - Market Share Analysis, Industry Trends & Statistics, Growth Forecasts (2026 - 2031) |
||||||
 Mordor Intelligence
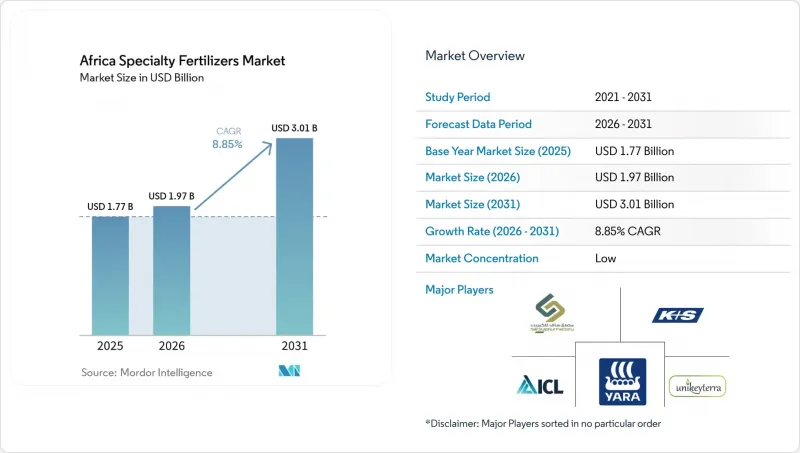
Mordor Intelligence에 의하면, 아프리카의 특수 비료 시장 규모는 2025년에 17억 7,000만 달러로 평가되었고, 2026년에 19억 7,000만 달러로 추정되고, 2026-2031년 CAGR 8.85%로 확대될 전망이며, 2031년에는 30억 1,000만 달러에 이를 것으로 예측됩니다.
본 보고서는 특수 비료 유형별(코팅 비료(CRF), 액체 비료, 방출 조절 비료(SRF), 수용성 비료), 시비 방법별(시비 관개, 엽면 시비, 토양 시비), 작물 유형별(밭작물, 원예작물, 잔디 및 관상용 식물), 국가별로 분류되어 있습니다. 시장 전망은 금액 및 수량으로 제시되어 있습니다.
아프리카의 특수 비료 시장 동향 및 인사이트
정부의 보조금 및 정책적 인센티브
아프리카 전역 각국의 비료 보조금 개혁에 따라 10억 달러 이상이 기후 변화를 고려한 특수 비료로 재편되고 있으며, 조달 패턴은 벌크 상품에서 정밀 배합 제품으로 근본적으로 변화하고 있습니다. 나이지리아의 특별 농업 가공 구역(SAPZ) 프로그램에서는 2024년에 5억 달러가 특히 특수 비료 유통 인프라에 배정된 반면, 케냐의 비료 보조금 프로그램은 처음으로 수용성 및 서방형 제제를 대상으로 확대되었습니다. 아프리카 연합(AU)의 2024년 나이로비 선언에서는 회원국들에게 2030년까지 비료 자급률 50%를 달성할 것을 약속하고 있으며, 이를 통해 특수 제품 제조 및 지역적 밸류체인을 위한 정책의 일관성이 촉진되고 있습니다. 이러한 보조금 개혁은 고효율 복합비료에 대한 지속적인 수요를 창출하는 동시에, 프리미엄 특수 제품에 대한 농가의 가격 민감도를 낮추고 있습니다.
1인당 경작 가능 면적의 감소
아프리카의 1인당 경작 가능 면적은 2000년 0.31헥타르에서 2024년 0.23헥타르로 감소했으며, 이로 인해 경작 면적 확대가 아닌 고효율 영양 솔루션을 통한 농업의 집약화가 시급해지고 있습니다. 사하라 이남 아프리카에서는 1헥타르당 평균 비료 시비량이 고작 13-20kg에 그치는 반면, 선진 지역에서는 150kg/ha에 달하고 있어, 수확량 격차를 해소하기 위해 특수 비료를 도입할 여지는 충분합니다. 토양 열화는 대륙 전체 경작지의 최대 65%에 영향을 미치고 있으며, 표토 고갈로 인한 연간 생산성 저하는 4.3-26.6%에 달하고, 미량 영양소 보충과 고효율 복합 비료가 필요합니다. 말리의 트레나부그 지역은 이러한 과제를 상징적으로 보여주고 있으며, 토양 분석 결과 질소, 칼륨, 마그네슘 결핍에 더해 니켈, 망간, 붕소 등의 미량 영양소도 부족한 것으로 밝혀졌습니다.
제한된 유통 인프라
액체 비료의 콜드체인 및 벌크 터미널 인프라가 미비하여, 입상 제품에 비해 유통 비용이 12% 더 높아, 외딴 농업 지역에서의 도입이 저해되고 있습니다. DP 월드(DP World)가 2029년까지 실시할 30억 달러 규모의 아프리카 항만 투자를 통해 일부 인프라 격차는 해소될 전망이지만, 온도에 민감한 특수 배합 비료의 경우 농촌 지역의 라스트 마일 유통이 여전히 과제로 남아 있습니다. 나이지리아의 비료 유통망은 적절한 보관 시설을 갖춘 농업 공동체의 불과 40%만을 커버하고 있어, 농가들은 제품 품질을 저하시키는 부적절한 상온 보관에 의존할 수밖에 없는 상황입니다. 남아프리카공화국의 농업협동조합에 따르면, 농촌 지역 창고의 냉장 시설 미비로 인해 액체 비료의 제품 손실률은 25%에 달할 전망입니다.
부문 분석
2025년, 아프리카 특수 비료 시장에서 액체 비료는 47.8%의 점유율을 차지했습니다. 이는 비료 시비 및 관개 인프라의 확대와 정밀한 영양 관리가 요구되는 수출 작물 수요에 힘입은 결과입니다. 액체 비료는 현대적인 관개 시스템이나 수경 재배, 아쿠아포닉스와 같은 선진적인 재배 방법과의 호환성으로 인해 큰 주목을 받고 있습니다. 이 부문의 성장은 관개 기술의 발전과 정밀 농업 기술의 보급 확대에 힘입고 있습니다. 한편, 방출 조절 비료(SRF) 부문은 규모는 작지만, 토양 경화를 최소화하고 식물에 대한 양분 공급을 조절하는 데 있어 매우 중요한 역할을 하고 있습니다. 이러한 비료는 시비 빈도와 전체 비료 비용을 줄이는 데 특히 효과적일 뿐만 아니라, 질소의 휘발 및 침출을 저감하는 등 환경적인 이점도 제공합니다.
코팅 비료(CRF)는 가장 빠르게 성장하는 부문으로, 2026-2031년 연평균 성장률(CAGR) 8.4%가 예상됩니다. 주로 상업용 농장이나 고부가가치 원예 분야에서 이용되며, 영양소의 방출 기간이 길기 때문에 프리미엄 가격 책정이 정당화됩니다. 정밀한 배합으로의 부문 진화는 지역 제조업체가 기후에 적응한 제품을 개발할 기회를 창출하는 한편, 세계 기업들은 기술 이전 및 현지 파트너십에 주력하고 있습니다. 이 부문의 성장은 침출이나 휘발로 인한 영양분 손실을 최소화해야 할 필요성이 매우 높은 밭작물에서 특히 두드러집니다. 시비 빈도 감소 및 영양분 이용 효율 향상과 같은 이점을 농가들이 점점 더 인식함에 따라, 코팅 비료(CRF)의 채택은 가속화될 전망입니다.
기타 혜택 :
- 엑셀 형식 시장 예측(ME) 시트
- 3개월간의 애널리스트 지원
자주 묻는 질문
목차
제1장 서론
제2장 개 보고서의 내용
제3장 주요 요약 및 주요 조사 결과
제4장 주요 업계 동향
제5장 시장 규모 및 성장 예측
제6장 경쟁 구도
제7장 비료 업계 CEO가 직면하는 중요 전략적 과제
AJY 26.08.12According to Mordor Intelligence, the Africa specialty fertilizers market size was USD 1.77 billion in 2025 to USD 1.97 billion in 2026 and is forecast to reach USD 3.01 billion by 2031 at 8.85% CAGR over 2026-2031.
This report is Segmented by Speciality Type (Controlled-Release Fertilizer (CRF), Liquid Fertilizer, Slow-Release Fertilizer (SRF), and Water Soluble), by Application Mode (Fertigation, Foliar, and Soil), by Crop Type (Field Crops, Horticultural Crops, and Turf & Ornamental), and by Country. The Market Forecasts are Provided in Terms of Value (USD) and Volume (Metric Tons).
Africa Specialty Fertilizers Market Trends and Insights
Government Subsidies and Policy Incentives
National fertilizers subsidy reforms across Africa are redirecting over USD 1 billion toward climate-smart specialty inputs, fundamentally reshaping procurement patterns from bulk commodities to precision formulations. Nigeria's Special Agro-Processing Zones program allocated USD 500 million in 2024 specifically for specialty fertilizers distribution infrastructure, while Kenya's fertilizers subsidy program expanded to include water-soluble and controlled-release formulations for the first time . The African Union's Nairobi Declaration 2024 committed member states to achieve 50% fertilizer self-sufficiency by 2030, driving policy alignment toward specialty product manufacturing and regional value chains. These subsidy reforms create sustained demand for enhanced-efficiency formulations while reducing farmers' price sensitivity to premium specialty products.
Decreasing Arable Land Per Capita
Africa's arable land per capita declined from 0.31 hectares in 2000 to 0.23 hectares in 2024, forcing agricultural intensification through higher-efficiency nutrient solutions rather than area expansion. Sub-Saharan Africa averages only 13-20 kg nutrient application per hectare compared to 150 kg/ha in developed regions, creating substantial scope for specialty fertilizers adoption to bridge yield gaps. Soil degradation affects up to 65% of arable land across the continent, with annual productivity losses of 4.3-26.6% from topsoil depletion requiring micronutrient supplementation and enhanced-efficiency formulations. Mali's Trenabougou region exemplifies the challenge, with soil analysis revealing deficiencies in nitrogen, potassium, and magnesium alongside limited micronutrients including nickel, manganese, and boron.
Limited Distribution Infrastructure
Poor cold-chain and bulk terminal infrastructure for liquid fertilizers raises distribution costs by 12% compared to granular products, constraining adoption in remote agricultural areas. DP World's USD 3 billion African ports investment through 2029 addresses some infrastructure gaps, but rural last-mile distribution remains problematic for temperature-sensitive specialty formulations. Nigeria's fertilizers distribution network covers only 40% of farming communities with proper storage facilities, forcing farmers to rely on suboptimal ambient storage that degrades product quality. South Africa's agricultural cooperatives report 25% product loss rates for liquid fertilizers due to inadequate cold storage in rural depots.
Other drivers and restraints analyzed in the detailed report include:
- Shift Toward High-Value Horticultural Exports
- Micro-Irrigation Projects Backed by AfDB (African Development Bank)
- High Upfront Cost of Controlled-Release Fertilizer (CRF) Polymers
For complete list of drivers and restraints, kindly check the Table Of Contents.
Segment Analysis
Liquid fertilizers accounted for 47.8% of the Africa specialty fertilizers market share in 2025, driven by expanding fertigation infrastructure and export crop requirements for precise nutrition management. Liquid fertilizers have gained significant traction due to their compatibility with modern irrigation systems and advanced cultivation methods like hydroponics and aquaponics. The segment's growth is supported by developments in irrigation technology and the increasing adoption of precision farming techniques. Meanwhile, the Slow-Release Fertilizer (SRF) segment, while smaller, plays a crucial role in minimizing soil hardening and coordinating nutrient flow to plants. These fertilizers are particularly valuable in reducing application frequency and overall fertilizers costs, while also offering environmental benefits such as reduced nitrogen volatilization and leaching.
Controlled-release fertilizers (CRF) are the fastest-growing segment, with a projected CAGR of 8.4% from 2026 to 2031, primarily serving commercial farms and high-value horticulture where extended nutrient release justifies premium pricing. The segment evolution toward precision formulations creates opportunities for regional manufacturers to develop climate-adapted products while global players focus on technology transfer and local partnerships. The segment's growth is particularly notable in field crops, where the need to minimize nutrient losses through leaching and volatilization is critical. The adoption of Controlled-Release Fertilizer (CRF) is likely to accelerate as farmers increasingly recognize its benefits in reducing application frequency and improving nutrient use efficiency.
Complete Report Scope:
- Speciality Type
- Controlled-Release Fertilizer (CRF)
- Polymer Coated
- Polymer-Sulfur Coated
- Others
- Liquid Fertilizer
- Slow-Release Fertilizer (SRF)
- Water Soluble
- Controlled-Release Fertilizer (CRF)
- Application Mode
- Fertigation
- Foliar
- Soil
- Crop Type
- Field Crops
- Horticultural Crops
- Turf & Ornamental
- Country
- Nigeria
- South Africa
- Rest of Africa
List of Companies Covered in this Report:
- Yara International ASA
- ICL Group Ltd
- K+S Aktiengesellschaft
- Unikeyterra Chemical
- Safsulphur
- OCP SA
- Haifa Chemicals Ltd.
- UPL Limited
- Omnia Holdings Ltd
- EuroChem Group AG
- PhosAgro Africa Ltd
- Kynoch Holdings Pty Ltd
- Kynoch Holdings Pty Ltd
- Zimbabwe Phosphate Industries Ltd
- Gavilon South Africa (MacroSource, LLC)
Additional Benefits:
- The market estimate (ME) sheet in Excel format
- 3 months of analyst support
TABLE OF CONTENTS
1 INTRODUCTION
- 1.1 Study Assumptions & Market Definition
- 1.2 Scope of the Study
- 1.3 Research Methodology
2 REPORT OFFERS
3 EXECUTIVE SUMMARY & KEY FINDINGS
4 KEY INDUSTRY TRENDS
- 4.1 Acreage of Major Crop Types
- 4.1.1 Field Crops
- 4.1.2 Horticultural Crops
- 4.2 Average Nutrient Application Rates
- 4.2.1 Micronutrients
- 4.2.1.1 Field Crops
- 4.2.1.2 Horticultural Crops
- 4.2.2 Primary Nutrients
- 4.2.2.1 Field Crops
- 4.2.2.2 Horticultural Crops
- 4.2.3 Secondary Macronutrients
- 4.2.3.1 Field Crops
- 4.2.3.2 Horticultural Crops
- 4.2.1 Micronutrients
- 4.3 Agricultural Land Equipped For Irrigation
- 4.4 Regulatory Framework
- 4.5 Value Chain & Distribution Channel Analysis
- 4.6 Market Drivers
- 4.6.1 Government subsidies and policy incentives
- 4.6.2 Decreasing arable land per capita
- 4.6.3 Shift toward high-value horticultural exports
- 4.6.4 Micro-irrigation projects backed by AfDB (African Development Bank)
- 4.6.5 Drone-based foliar nutrient application
- 4.6.6 Carbon-credit linked premium pricing
- 4.7 Market Restraints
- 4.7.1 Limited distribution infrastructure
- 4.7.2 High upfront cost of Controlled-Release Fertilizer (CRF) polymers
- 4.7.3 Inconsistent regional heavy-metal standards
- 4.7.4 Supply-chain exposure to coating polymer imports
5 MARKET SIZE AND GROWTH FORECASTS (VALUE AND VOLUME)
- 5.1 Speciality Type
- 5.1.1 Controlled-Release Fertilizer (CRF)
- 5.1.1.1 Polymer Coated
- 5.1.1.2 Polymer-Sulfur Coated
- 5.1.1.3 Others
- 5.1.2 Liquid Fertilizer
- 5.1.3 Slow-Release Fertilizer (SRF)
- 5.1.4 Water Soluble
- 5.1.1 Controlled-Release Fertilizer (CRF)
- 5.2 Application Mode
- 5.2.1 Fertigation
- 5.2.2 Foliar
- 5.2.3 Soil
- 5.3 Crop Type
- 5.3.1 Field Crops
- 5.3.2 Horticultural Crops
- 5.3.3 Turf & Ornamental
- 5.4 Country
- 5.4.1 Nigeria
- 5.4.2 South Africa
- 5.4.3 Rest of Africa
6 COMPETITIVE LANDSCAPE
- 6.1 Key Strategic Moves
- 6.2 Market Share Analysis
- 6.3 Company Landscape
- 6.4 Company Profiles (Includes Global Level Overview, Market Level Overview, Core Business Segments, Financials, Headcount, Key Information, Market Rank, Market Share, Products and Services, and Analysis of Recent Developments).
- 6.4.1 Yara International ASA
- 6.4.2 ICL Group Ltd
- 6.4.3 K+S Aktiengesellschaft
- 6.4.4 Unikeyterra Chemical
- 6.4.5 Safsulphur
- 6.4.6 OCP SA
- 6.4.7 Haifa Chemicals Ltd.
- 6.4.8 UPL Limited
- 6.4.9 Omnia Holdings Ltd
- 6.4.10 EuroChem Group AG
- 6.4.11 PhosAgro Africa Ltd
- 6.4.12 Kynoch Holdings Pty Ltd
- 6.4.13 Kynoch Holdings Pty Ltd
- 6.4.14 Zimbabwe Phosphate Industries Ltd
- 6.4.15 Gavilon South Africa (MacroSource, LLC)


