

|
시장보고서
상품코드
2113295
전립선암 : 시장 점유율 분석, 업계 동향과 통계, 성장 예측(2026-2031년)Prostate Cancer - Market Share Analysis, Industry Trends & Statistics, Growth Forecasts (2026 - 2031) |
||||||
 Mordor Intelligence
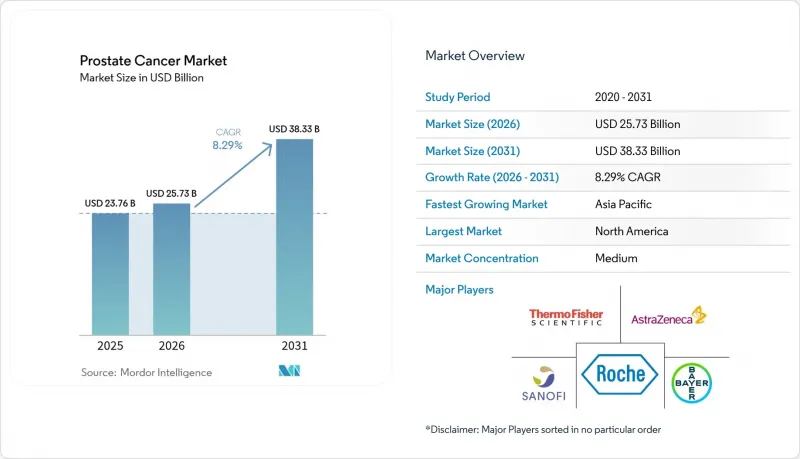
Mordor Intelligence에 따르면 2026년 전립선암 시장의 규모는 257억 3,000만 달러로 추정되고 있으며, 2025년 237억 6,000만 달러에서 성장하며, 2031년에는 383억 3,000만 달러에 달할 것으로 예측됩니다.
2026-2031년 동안의 연평균 성장률(CAGR)은 8.29%에 달할 전망입니다.
이 보고서는 질환 유형(양성 전립선 비대증, 전립선 선암, 기타), 병기(국소성 T1-T2, 국소 진행성 T3, 원격 전이성 T4 및 M1), 모달리티(진단, 치료),최종사용자(병원, 암 전문 센터 및 클리닉, 기타), 지역(북미, 유럽, 기타)별로 분류되어 있습니다. 시장 예측은 금액(달러) 기준으로 제시되어 있습니다.
전 세계 전립선암 시장의 동향 및 인사이트
고령화 진행과 높은 유병률
평균 수명의 연장으로 인해 전 세계 남성의 평균 잔여 수명이 늘어나며, 전립선암 위험에 노출되는 인구층이 확대되고 있습니다. 현재 지역 간 발병률 차이는 13배 이상에 달하며, 호주·뉴질랜드, 북미, 북유럽에서 가장 높은 수치를 보이고 있습니다. 한편, 사하라 이남 아프리카와 라틴아메리카의 일부 지역에서는 사망률이 여전히 불균형적으로 높으며, 초기 진단시 전이가 확인되는 사례가 20%를 초과하고 있으며, 선별 검사 체계의 격차가 두드러지고 있습니다. 지난 5년간 11개 중소득 국가에서 발병률이 두 자릿수 증가세를 보였는데, 이는 PSA 검사 수검률 향상과 인구 고령화 두 가지 요인을 모두 반영한 것입니다. 이러한 구조적 변화가 전 세계 전립선암 시장의 기초적인 수요를 지원하고 있습니다. 중동의 보건부는 진행기 진단을 억제하기 위해 연령대별 선별검사의 기준 연령을 재검토하고 있으며, 이는 진단 기술의 광범위한 도입을 위한 규제 측면의 호재가 될 것임을 시사합니다.
정밀 의료 워크플로우 및 동반 진단의 보급 확대
바이오마커 기반 치료, 특히 BRCA 변이를 가진 전이성 질환에 대한 올라파립과 아비라테론 병용 요법에 대한 규제 당국의 승인으로, 게놈 검사의 일상적인 사용이 정당화되었습니다. 경제 모델에 따르면 생식세포 계통 BRCA 선별 검사의 비용은 품질 조정 생존 연한(QALY)당 2만 6,657달러로 산출되었으며, 이는 고소득 국가의 의료제도에서 허용되는 기준 범위 내에 충분히 들어맞습니다. 소변 검체를 이용한 ‘MyProstateScore 2.0’과 18개 유전자 패널에 대한 메디케어 보험 적용으로 인해 피할 수 있는 생검 비율이 감소했으며, 그 결과 후속 과정에서 발생하는 과잉 치료 비용이 억제되고 있습니다. ‘Prostatype P-score’는 적극적인 경과 관찰 대상 선별을 한층 강화하여 총 비용을 절감하는 동시에 QALY의 증분 효과를 가져오고 있습니다. 이러한 툴들은 종합적으로 맞춤형 의료에 대한 의사의 신뢰를 높여, 진단 부문에서 전립선암 시장의 수익 성장을 가속화하고 있습니다.
진단에서 치료에 이르는 전 과정에서 발생하는 높은 총비용
이란의 질병 비용 조사에 따르면 환자 1인당 평균 지출은 2,613달러, 국가 부담 추정액은 2억 1,700만 달러에 달하며, 이러한 수치는 자원이 부족한 환경에서 지불 주체의 예산에 큰 부담을 주고 있습니다. 독일에서는 177Lu-PSMA-617 방사성 리간드 요법이 환자 1인당 2만 7,200유로의 추가 비용을 발생시켜, 비용-효용 비율을 QALY당 6만 9,418유로로 끌어올리고 있습니다. 이 수준은 협상된 기준치를 약간 상회하는 정도입니다. 카리브해 지역의 병원에서는 외과적 치료에 대한 환자 본인 부담 비용이 급격히 치솟고 있으며, 환자가 최적의 치료법이라고 할 수 없는 호르몬 단독 요법으로 유도되는 사례가 종종 관찰됩니다. 멕시코에서는 아비라테론 제네릭 의약품의 도입으로 사례당 6,251달러의 비용 절감이 실현되어, 가격 개혁이 치료 접근성을 얼마나 확대할 수 있는지를 보여주고 있습니다. 총 지출이 지속적으로 높은 수준을 유지하고 있는 것은 최첨단 치료법의 단기적 도입을 저해하며, 특히 저·중소득 국가에서 전립선암 시장의 성장 속도를 억제하고 있습니다.
부문 분석
전립선 선암은 여전히 주류를 차지하고 있으며, 표준화된 치료 경로와 확고한 근거에 기반한 지침에 힘입어 2025년에는 전립선암 시장 규모의 86.74%를 차지할 것으로 전망됩니다. 정밀한 바이오마커 패널을 통해 이 광범위한 환자 집단에 대한 위험 계층화가 정교해지고, 보다 세밀한 치료 계획이 가능해짐에 따라 진단 검사 시장의 성장이 지속되고 있습니다. 소세포암은 전체 발병 건수에서 차지하는 비율은 미미하지만, 유전체 프로파일링 및 표적 화학요법 요법의 발전으로 인해 이 침습성이 높은 표현형의 생존율이 향상됨에 따라 연평균 성장률(CAGR) 6.78%를 기록하고 있습니다. 전립선암 진단·치료 산업은 전문적인 치료법에 대한 보험 급여 차별화를 염두에 두고, 희귀 조직형에 대한 연구개발(R&D) 예산을 확보함으로써 이에 대응하고 있습니다. 양성 전립선 비대증은 임상적으로 여전히 별개의 질환이지만, PSA 수치 상승으로 추가 검사가 필요한 경우 영상 검사 건수에 간접적인 영향을 미치며, 종합 비뇨기과 센터내 상호 의뢰를 통한 시너지 효과를 창출하고 있습니다.
전이성 상피암 및 육종양 변이형에 대한 인식이 높아지고, 학술기관의 레지스트리 구축 노력이 더해지면서 틈새 하위 부문에서는 점진적인 증가가 예상됩니다. 그러나 선암의 압도적인 규모가 호르몬 요법 원료의약품 및 생검 기기의 제조 비용을 낮추어, 소규모 적응증에서는 재현하기 어려운 비용 우위를 가져오고 있습니다. 이러한 검사 건수의 동향은 대상 시장에서 선암 관리의 중심적인 역할을 지원하고 있습니다.
국소성 T1-T2 병변은 2025년 시술 건수의 61.08%를 차지하며, 북미와 유럽 일부 지역의 PSA 선별검사의 보급과 보험 적용에 따른 MRI 선별 검사를 반영하고 있습니다. 반면, 원격·전이성 종양은 생화학적 재발을 보다 조기 전이 확인으로 전환시키는 영상 진단 감도의 향상에 힘입어 연평균 성장률(CAGR) 8.57%로 예측되며, 다른 모든 병변을 상회하는 성장세를 보이고 있습니다. 전이성 전립선암 치료 시장 규모는 새로운 호르몬 병용 요법 및 방사성 리간드 요법의 이용 확대를 반영하여 향후 수년간 성장할 것으로 예측됩니다.
국소성 T3 병변은 이 두 극단 사이 중간에 위치하며, 선량이 증량된 영상 유도 방사선 치료와 기능적 예후를 유지하는 MR 표적 국소 절제술의 혜택을 받고 있습니다. 멕시코의 Can.Prost 등록부 데이터에 따르면 조기 발견 프로그램을 통해 근치적 치료 적응률이 67%로 상승하여 향후 전이로 인한 부담이 경감될 것으로 확인되었습니다. 반면, 중동의 레지스트리에서는 신규 전이율이 20%를 넘는 것으로 보고되고 있는데, 이는 선별 검사의 기회를 놓치고 있음을 시사하며, 그 결과 고비용의 전신 요법에 대한 수요가 증가하고 있습니다. 이러한 대조적인 상황은 병기 변화가 전립선암 시장내 수익 구성을 어떻게 좌우하는지를 여실히 보여주고 있습니다.
지역별 분석
북미는 2025년 전 세계 매출의 41.88%를 차지하며 시장을 선도하고 있습니다. 이는 지침에서 권장하는 진단법의 전국적 적용, PSMA-PET의 조기 도입, 안드로겐 수용체 경로 억제제의 급속한 보급을 반영한 것입니다. 메디케어(Medicare)의 분자 검사 보상 범위 확대로 생검 선별 정확도가 향상된 반면, 재향군인부(VA)는 과잉 치료를 방지하기 위해 적극적 관찰 프로토콜을 지속적으로 개선하고 있습니다. 미국의 종양학 네트워크에서는 의료 기술 평가를 활용하여 처방약 리스트 등재를 실제 치료 성과와 일치시킴으로써, 지불 주체의 신뢰를 유지하는 데이터 투명성을 확보하고 있습니다. 캐나다에서는 치료 순서와 기간을 최적화하는 시퀀스 기반 비용-효과 모델을 통해 재정 규율을 강화하고 있습니다. 그 결과, 해당 지역의 시장 성장은 인구 증가보다 혁신 주기에 의해 주도되고 있습니다. 환자 1인당 절대 지출액은 여전히 세계 최고 수준을 유지하고 있으며, 이것이 전립선암 시장에서 제약 기업의 제품 출시 전략의 기반이 되고 있습니다.
유럽에서는 유럽연합 집행위원회의 지침에 따라 조화로운 선별 검사 체계를 활용하고 있으며, 환급 환경이 달라도 일관된 기준 수요가 확보되고 있습니다. 독일 연방합동위원회는 비용-효용 프로파일을 엄격하게 평가하고 있지만, 승인된 방사성 리간드나 첨단 영상 진단 기술은 그 가치가 입증되면 DRG(진단 관련 군)에 따른 결제를 신속하게 확보할 수 있습니다. 한편, 동유럽 국가들은 사망률이 높고 PSA 스크리닝 수검률이 낮은 상황에 처해 있으며, 이는 잠재적인 성장 여지를 보여주는 불평등을 여실히 드러내고 있습니다. 방사성 추적자 및 게놈 검사 키트에 대한 공동 조달이 탄력을 받고 있으며, 국경을 초월한 수요의 집적을 통해 접근성 격차의 축소가 기대됩니다.
아시아태평양은 고령화와 의료 시스템의 현대화를 배경으로, 2031년까지 10.08%라는 지역내 가장 높은 연평균 성장률(CAGR)을 기록할 전망입니다. 중국의 병원 계층화 개혁에 따라 복잡한 종양 치료가 PSMA-PET 스캐너와 선형 가속기가 집중된 3차 의료 기관으로 집약되면서, 진단 및 방사선 치료 건수가 급속히 증가하고 있습니다. 일본의 국민건강보험에서는 이미 달로르타미드와 올라파리브의 병용 요법이 보험 적용 리스트에 등재되어 있으며, 고부가가치 치료의 신속한 보급을 지원하고 있습니다. 인도에서는 민간 비뇨기과 그룹이 원격 병리 진단 제공업체와 제휴하여 바이오마커 검사를 대도시권 이외의 지역으로도 확대하고 있습니다. 레즈빌타미드의 QALY당 2만 6,657달러라는 우수한 비용 대비 효과는 중국 보험사의 판단에 영향을 미치고 있으며, 비용 대비 효과가 높은 혁신적인 치료법에 대한 보험 급여 지급 준비가 되어 있음을 보여줍니다. 따라서 이러한 강력한 성장은 유병률 상승과 기술 보급 확대를 모두 반영하며, 아시아태평양이 시장의 주요 수요 동력임을 확고히 하고 있습니다.
기타 혜택
- 엑셀 형식의 시장 예측(ME) 시트
- 3개월간의 애널리스트 지원
자주 묻는 질문
목차
제1장 서론
제2장 조사 방법
제3장 개요
제4장 시장 구도
제5장 시장 규모와 성장 예측
제6장 경쟁 구도
제7장 시장 기회와 향후 전망
KSA 26.08.25According to Mordor Intelligence, prostate cancer market size in 2026 is estimated at USD 25.73 billion, growing from 2025 value of USD 23.76 billion with 2031 projections showing USD 38.33 billion, growing at 8.29% CAGR over 2026-2031.
This report is Segmented by Disease Type (Benign Prostatic Hyperplasia, Prostatic Adenocarcinoma, and More), Stage (Localized T1-T2, Regional T3, Distant/Metastatic T4 & M1), Modality (Diagnostics, Treatment), End User (Hospitals, Specialty Cancer Centers & Clinics, and More), and Geography (North America, Europe, and More). The Market Forecasts are Provided in Terms of Value (USD).
Global Prostate Cancer Market Trends and Insights
Rising Ageing Population and High Prevalence
Longevity gains have lifted global male life expectancy, creating larger cohorts at risk for prostate malignancy. Incidence now varies more than 13-fold between regions, with the highest rates in Australia/New Zealand, North America, and Northern Europe. Mortality remains disproportionately high across sub-Saharan Africa and parts of Latin America, where de novo metastatic presentations exceed 20%, underscoring gaps in screening infrastructure. Over the past five years, 11 middle-income countries have reported double-digit growth in incidence, reflecting both improved PSA testing coverage and demographic aging. These structural shifts sustain baseline demand for the prostate cancer market worldwide. Health ministries in the Middle East are reevaluating age-based screening cut-offs to curb the presentation of advanced stages, signaling regulatory tailwinds for the widespread adoption of diagnostics.
Growing Adoption of Precision-Medicine Workflows & Companion Diagnostics
Regulatory approvals for biomarker-guided treatments, notably olaparib plus abiraterone for BRCA-mutated metastatic disease, have validated the routine use of genomic testing. Economic models place germline BRCA screening at USD 26,657 per quality-adjusted life year, which is well within the acceptability thresholds for high-income systems. Medicare reimbursement for urine-based MyProstateScore 2.0 and 18-gene panels is cutting avoidable biopsy rates, thereby curbing downstream overtreatment costs. The Prostatype P-score further enhances active-surveillance triage, delivering incremental QALY gains at a lower overall spend. Collectively, these tools bolster physician confidence in individualized care, accelerating revenue growth for the prostate cancer market within the diagnostics segment.
High Aggregate Cost of Diagnosis-to-Treatment Pathway
Cost-of-illness studies in Iran pegged the average per-patient expenditure at USD 2,613, while national burden estimates reached USD 217 million, figures that strain payer budgets in resource-stressed settings. In Germany, 177Lu-PSMA-617 radioligand therapy adds EUR 27,200 per patient, nudging the cost-utility ratio toward EUR 69,418 per QALY, a level only marginally within negotiated thresholds. Caribbean hospitals experience sharp spikes in out-of-pocket costs for surgical care, often steering patients toward suboptimal hormone monotherapy. Generic abiraterone in Mexico has reduced costs by USD 6,251 per case, illustrating how pricing reforms can expand therapeutic access. Persistently high aggregate spending dampens the near-term uptake of cutting-edge modalities, tempering the velocity of the prostate cancer market, especially in low- and middle-income economies.
Other drivers and restraints analyzed in the detailed report include:
- Technological Advances in Minimally-Invasive Surgery and Image-Guided Radiotherapy
- Robust R&D Pipeline of Prostate Cancer Therapies
- Limited Accessibility of Advanced Imaging and Genomic Testing in Low-Resource Settings
For complete list of drivers and restraints, kindly check the Table Of Contents.
Segment Analysis
Prostatic adenocarcinoma continues to dominate, holding 86.74% of the prostate cancer market value in 2025, buoyed by standardized care pathways and robust evidence-based guidelines. Precision biomarker panels are refining risk stratification within this broad cohort, enabling more granular treatment roadmaps and sustaining diagnostic test growth. Small cell carcinoma, although accounting for only a small portion of the overall incidence, is experiencing a 6.78% CAGR as genomic profiling and targeted chemotherapeutic regimens improve survival in this aggressive phenotype. The Prostate Cancer Diagnostics and Therapy industry has responded by earmarking R&D budgets for rare histologies, anticipating reimbursement differentiation that rewards specialized therapeutics. Benign prostatic hyperplasia remains clinically distinct yet exerts an indirect influence on imaging volumes when PSA levels trigger further work-up, fostering cross-referral synergies within comprehensive urology centers.
Heightened recognition of transitional cell and sarcomatoid variants, coupled with academic-centre registry initiatives, forecasts an incremental lift in niche subsegments. However, the sheer scale of adenocarcinoma anchors manufacturing economies across hormone-therapy APIs and biopsy devices, conferring cost advantages that smaller-scale indications struggle to replicate. This volume dynamic reinforces the central role of adenocarcinoma management in the target market.
Localized T1-T2 disease delivered 61.08% of 2025 procedure volumes, reflecting widespread PSA screening and insurance-funded MRI triage in North America and parts of Europe. Yet distant/metastatic tumours outpaced all others with an 8.57% CAGR forecast, propelled by improved imaging sensitivity that converts biochemical recurrence into earlier metastatic confirmation. The prostate cancer market size for metastatic interventions is projected to grow in the coming years, mirroring escalating use of novel hormonal combinations and radioligand therapies.
Regional T3 disease sits between these poles, benefiting from dose-escalated image-guided radiotherapy and MR-targeted focal ablation that preserves functional outcomes. Data from the Mexican Can.Prost registry confirms that early detection programs elevate radical treatment eligibility to 67%, shrinking future metastatic burden. Conversely, Middle Eastern registries cite de novo metastatic rates above 20%, signalling lost screening opportunities that inflate high-cost systemic therapy demand. Such contrasts illustrate how stage migration dictates revenue mix inside the prostate cancer market
Complete Report Scope:
- By Disease Type
- Benign Prostatic Hyperplasia
- Prostatic Adenocarcinoma
- Small Cell Carcinoma
- Other Types
- By Stage
- Localized (T1-T2)
- Regional (T3)
- Distant/Metastatic (T4 & M1)
- By Modality
- Diagnostics
- Tissue Biopsy
- Transrectal Ultrasound
- Clinical Laboratory Examination
- Prostate-specific Antigen Testing
- Urine Biomarker Testing
- Diagnostic Imaging
- Treatment
- Surgery (Radical, Laparoscopic, Robotic)
- Radiation Therapy (EBRT, Brachytherapy)
- Therapeutics
- Hormone / Androgen-Deprivation Therapy
- Chemotherapy
- Immunotherapy / Targeted Therapy
- Other Treatments (HIFU, Cryotherapy)
- Diagnostics
- By End User
- Hospitals
- Specialty Cancer Centers & Clinics
- Diagnostic Laboratories
- Other End Users
- By Geography
- North America
- United States
- Canada
- Mexico
- Europe
- Germany
- United Kingdom
- France
- Italy
- Spain
- Rest of Europe
- Asia-Pacific
- China
- Japan
- India
- Australia
- South Korea
- Rest of Asia-Pacific
- Middle East and Africa
- GCC
- South Africa
- Rest of Middle East and Africa
- South America
- Brazil
- Argentina
- Rest of South America
- North America
Geography Analysis
North America dominated with a 41.88% share of 2025 global revenues, reflecting universal coverage of guideline-endorsed diagnostics, early integration of PSMA-PET, and rapid uptake of androgen receptor pathway inhibitors. Medicare's expansion of molecular test reimbursement has amplified biopsy triage accuracy, while the Veterans Affairs system continues to refine active-surveillance protocols to guard against overtreatment. United States oncology networks employ health-technology assessments to align formulary inclusion with real-world outcomes, generating data transparency that sustains payer confidence. Canada reinforces fiscal discipline through sequence-based cost-effectiveness models that optimize therapy order and duration. As a result, market growth in the region is driven more by innovation cycling than demographic expansion. Yet, absolute spend per patient remains at the global peak, anchoring manufacturer launch strategies inside the prostate cancer market.
Europe leverages harmonized screening frameworks under European Commission guidance, providing consistent baseline demand despite heterogeneous reimbursement climates. Germany's Federal Joint Committee rigorously evaluates cost-utility profiles, yet approved radioligands and advanced imaging quickly secure DRG-linked payment once value is demonstrated. Eastern European states, however, face higher mortality and lower PSA screening coverage, pointing to inequities that represent latent growth pockets. Collaborative procurement for radiotracers and genomic kits is gaining momentum, promising cross-border volume aggregation that could narrow access gaps.
Asia-Pacific supplies the fastest regional CAGR at 10.08% through 2031, underpinned by ageing demographics and health-system modernization. China's tiered hospital reform is funnelling complex oncology procedures to tertiary centres where PSMA-PET scanners and linear accelerators cluster, rapidly lifting diagnostic and radiotherapy volumes. Japan's national insurance already lists darolutamide and olaparib combinations, aiding swift diffusion of premium therapeutics. In India, private urology groups partner with tele-pathology providers to extend biomarker testing beyond metros. Rezvilutamide's favourable USD 26,657 per QALY profile has swayed Chinese payers, illustrating readiness to reimburse cost-effective innovations. Strong growth therefore reflects both rising incidence and escalating technology penetration, cementing Asia-Pacific as the pivotal demand engine for the market.
- Johnson & Johnson Services Inc. (Janssen)
- AstraZeneca
- Bayer
- Pfizer
- Astellas Pharma
- Merck
- Sanofi
- Roche
- Thermo Fisher Scientific
- Koninklijke Philips
- Exact Sciences Corp.
- Lantheus Holdings, Inc.
- Myriad Genetics
- Illumina
- Siemens Healthineers
- Accuray
- Intuitive Surgical, Inc.
- Ipsen
- Novartis
- Telix Pharmaceuticals
Additional Benefits:
- The market estimate (ME) sheet in Excel format
- 3 months of analyst support
TABLE OF CONTENTS
1 Introduction
- 1.1 Study Assumptions & Market Definition
- 1.2 Scope of the Study
2 Research Methodology
3 Executive Summary
4 Market Landscape
- 4.1 Market Overview
- 4.2 Market Drivers
- 4.2.1 Rising Aging Population and High Prevalence Rate of Prostate Cancer
- 4.2.2 Growing Adoption of Precision-Medicine Workflows & Companion Diagnostics
- 4.2.3 Technological Advances in Minimally-Invasive Surgery and Image-Guided Radiotherapy
- 4.2.4 Increasing Government Initiatives for Prostate Cancer Awareness
- 4.2.5 Robust R&D Pipeline of Prostate Cancer Therapies
- 4.2.6 Shift Toward Personalized Medicine and Relevant Improved Patient Experience
- 4.3 Market Restraints
- 4.3.1 High Aggregate Cost of Diagnosis-To-Treatment Pathway Strains Payers and Patients
- 4.3.2 Limited Accessibility of Advanced Imaging and Genomic Testing in Low-Resource Settings
- 4.3.3 Stringent Regulatory Requirements & Lengthy Clinical Development Timelines for Novel Agents
- 4.3.4 Concerns Regarding Drug Resistance and Relapse
- 4.4 Pipeline Analysis for Drugs
- 4.5 Regulatory Outlook
- 4.6 Technological Outlook
- 4.7 Porter's Five Forces Analysis
- 4.7.1 Threat of New Entrants
- 4.7.2 Bargaining Power of Buyers
- 4.7.3 Bargaining Power of Suppliers
- 4.7.4 Threat of Substitutes
- 4.7.5 Intensity of Competitive Rivalry
5 Market Size & Growth Forecasts (Value)
- 5.1 By Disease Type
- 5.1.1 Benign Prostatic Hyperplasia
- 5.1.2 Prostatic Adenocarcinoma
- 5.1.3 Small Cell Carcinoma
- 5.1.4 Other Types
- 5.2 By Stage
- 5.2.1 Localized (T1-T2)
- 5.2.2 Regional (T3)
- 5.2.3 Distant/Metastatic (T4 & M1)
- 5.3 By Modality
- 5.3.1 Diagnostics
- 5.3.1.1 Tissue Biopsy
- 5.3.1.2 Transrectal Ultrasound
- 5.3.1.3 Clinical Laboratory Examination
- 5.3.1.3.1 Prostate-specific Antigen Testing
- 5.3.1.3.2 Urine Biomarker Testing
- 5.3.1.4 Diagnostic Imaging
- 5.3.2 Treatment
- 5.3.2.1 Surgery (Radical, Laparoscopic, Robotic)
- 5.3.2.2 Radiation Therapy (EBRT, Brachytherapy)
- 5.3.2.3 Therapeutics
- 5.3.2.3.1 Hormone / Androgen-Deprivation Therapy
- 5.3.2.3.2 Chemotherapy
- 5.3.2.3.3 Immunotherapy / Targeted Therapy
- 5.3.2.3.4 Other Treatments (HIFU, Cryotherapy)
- 5.3.1 Diagnostics
- 5.4 By End User
- 5.4.1 Hospitals
- 5.4.2 Specialty Cancer Centers & Clinics
- 5.4.3 Diagnostic Laboratories
- 5.4.4 Other End Users
- 5.5 By Geography
- 5.5.1 North America
- 5.5.1.1 United States
- 5.5.1.2 Canada
- 5.5.1.3 Mexico
- 5.5.2 Europe
- 5.5.2.1 Germany
- 5.5.2.2 United Kingdom
- 5.5.2.3 France
- 5.5.2.4 Italy
- 5.5.2.5 Spain
- 5.5.2.6 Rest of Europe
- 5.5.3 Asia-Pacific
- 5.5.3.1 China
- 5.5.3.2 Japan
- 5.5.3.3 India
- 5.5.3.4 Australia
- 5.5.3.5 South Korea
- 5.5.3.6 Rest of Asia-Pacific
- 5.5.4 Middle East and Africa
- 5.5.4.1 GCC
- 5.5.4.2 South Africa
- 5.5.4.3 Rest of Middle East and Africa
- 5.5.5 South America
- 5.5.5.1 Brazil
- 5.5.5.2 Argentina
- 5.5.5.3 Rest of South America
- 5.5.1 North America
6 Competitive Landscape
- 6.1 Market Concentration
- 6.2 Market Share Analysis
- 6.3 Company Profiles (includes Global level Overview, Market level overview, Core Segments, Financials as available, Strategic Information, Market Rank/Share for key companies, Products & Services, and Recent Developments)
- 6.3.1 Johnson & Johnson Services Inc. (Janssen)
- 6.3.2 AstraZeneca PLC
- 6.3.3 Bayer AG
- 6.3.4 Pfizer Inc.
- 6.3.5 Astellas Pharma Inc.
- 6.3.6 Merck & Co., Inc.
- 6.3.7 Sanofi SA
- 6.3.8 F. Hoffmann-La Roche Ltd
- 6.3.9 Thermo Fisher Scientific Inc.
- 6.3.10 Koninklijke Philips NV
- 6.3.11 Exact Sciences Corp.
- 6.3.12 Lantheus Holdings, Inc.
- 6.3.13 Myriad Genetics, Inc.
- 6.3.14 Illumina Inc.
- 6.3.15 Siemens Healthineers AG
- 6.3.16 Accuray Incorporated
- 6.3.17 Intuitive Surgical, Inc.
- 6.3.18 Ipsen Pharma
- 6.3.19 Novartis AG
- 6.3.20 Telix Pharmaceuticals Ltd
7 Market Opportunities & Future Outlook
- 7.1 White-space & Unmet-need Assessment


