|
시장보고서
상품코드
2116612
전이성 암 치료 시장 : 점유율 분석, 업계 동향과 통계, 성장 예측(2026-2031년)Metastatic Cancer Treatment - Market Share Analysis, Industry Trends & Statistics, Growth Forecasts (2026 - 2031) |
||||||
 Mordor Intelligence
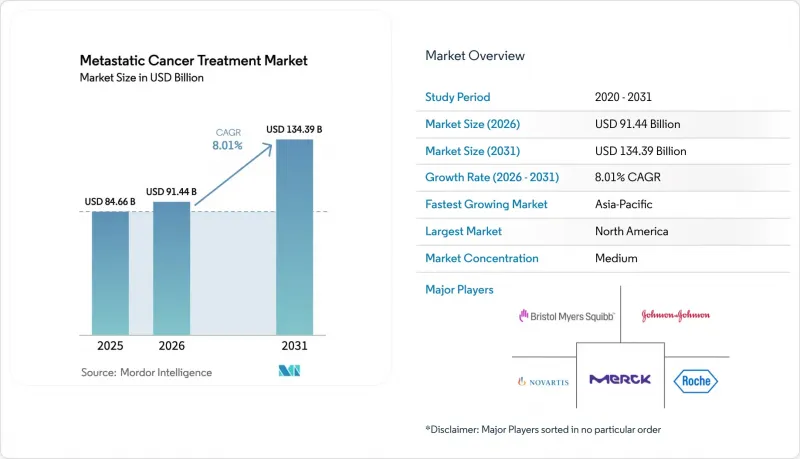
Mordor Intelligence에 의하면, 2026년 전이성 암 치료 시장 규모는 914억 4,000만 달러로 추정되고 있어 2025년 846억 6,000만 달러에서 확대해, 2031년에는 1,343억 9,000만 달러에 이를 것으로 예측됩니다.
2026년부터 2031년까지의 연평균 성장률(CAGR)은 8.01%를 나타낼 전망입니다.
본 보고서는 치료법별(화학요법, 면역요법, 호르몬요법, 표적요법 등), 암 유형별(유방암, 폐암, 전립선암, 악성 흑색종, 대장암 등), 최종 사용자별(병원, 전문 클리닉 등), 지역별(북미, 유럽,아시아태평양 등)으로 분류되어 있습니다. 시장 예측은 금액(달러) 기준으로 제시되어 있습니다.
전 세계 전이성 암 치료 시장 동향 및 인사이트
FDA/EMA에 의한 승인 및 적응증 확대 가속화
‘브레이크스루 테라피(Breakthrough Therapy)’ 지정에 따라, 미국 내 심사 기간의 중앙값은 6.1개월로 단축되었습니다. 한편, EMA는 2024년에 티소츠맙 베도틴과 림보셀타맙을 포함한 8개의 항암제에 대해 조건부 승인을 발급하며, 수요가 높은 적응증에 대해 규제상의 유연성을 보여주었습니다. CAR-T의 우산 평가(umbrella evaluation) 합리화를 통해 신청 부담이 40% 더 감소하여, 견고한 제조 체계와 후기 임상시험 단계의 자산을 보유한 신청 기업에게 유리하게 작용하고 있습니다. 유럽의 의료기술평가(HTA) 프레임워크에 기반한 공동 임상 평가를 통해 회원국 간 가치 평가 자료의 일관성이 확보되고, 시장 출시 시차가 단축되며, 수익 창출이 가속화될 것으로 기대됩니다.
면역요법의 급속한 확산
체크포인트 억제제는 현재 15가지 종양 유형에서 승인되었으며, 바이오마커에 기반한 환자 선정을 통해 PD-L1 양성 환자군에서 전반적인 반응률은 45%에 달할 전망입니다. 방사선이나 종양 용해성 바이러스를 사용하여 ‘콜드’ 종양을 염증성 표현형으로 전환시키는 병용 요법을 통해, 적응증 대상은 기존 반응률 30%인 코호트를 상회하는 범위로 확대되고 있으며,린보셀타맙에 대한 초기 데이터에서는 다제내성 다발성 골수종에서 70%의 객관적 반응률이 나타났습니다. 이러한 성과를 바탕으로 전이성 암 치료 시장은 생존 기간의 지속적인 연장을 가져오는 혁신의 원동력으로서의 입지를 확고히 하고 있습니다.
고액의 치료비와 보험 급여 장벽
CAR-T 요법의 1코스당 평균 가격은 45만 달러에 육박하고, 항체-약물 복합체(ADC)는 연간 18만 달러를 초과하는 등 경제적 장벽이 발생하고 있습니다. 전문적인 투여 및 독성 관리가 필요하기 때문에 총 치료비는 60-80%나 더 치솟습니다. 미국 민간 보험사의 40%가 병용 요법에 대해 사전 승인을 의무화하고 있어 최적의 치료 시작이 지연되는 한편, 유럽의 의료기술평가(HTA) 기관은 질조정생존년(QALY)당 비용을 10만 유로 미만으로 억제할 것을 요구하고 있습니다. 가치 기반 계약 및 바이오시밀러 시장 진입으로 인해 이러한 과제는 부분적으로 완화될 전망입니다.
부문 분석
2025년 매출 중 표적 치료가 53.78%를 차지했습니다. 이는 경험적 치료의 실패율을 거의 절반으로 줄여주는 견고한 바이오마커 주도 프로토콜에 힘입은 결과입니다. 이 부문은 처방 목록에서 안정적인 위치를 차지하고 있으며, 적응증 확대의 진전에 따른 혜택도 누리고 있습니다. 화학요법은 주로 새로운 병용 요법 프로토콜의 기반으로 자리 잡고 있으며, 면역요법은 계속해서 성장하고 있습니다. 세포 및 유전자 치료는 기반은 낮지만 17.35%라는 가장 높은 연평균 성장률(CAGR)을 기록하고 있습니다. 레전드 바이오테크(Legend Biotech)가 2025년까지 ‘칼빅티(Calvikti)’의 투여 횟수를 1만 건으로 두 배로 늘릴 계획인 것은 수요를 충족하기 위해 필요한 인프라 구축의 좋은 사례입니다. 노바티스도 마찬가지로 방사성 리간드의 생산량을 연간 25만 회분으로 확대하여, 오랫동안 지속되어 온 공급 부족 문제를 해결하고 있습니다.
세포 및 유전자 치료에 의한 전이성 암 치료 시장 규모는 제조 기술의 발전과 유리한 보험 환급 시범 프로그램을 배경으로, 2026년부터 2031년까지 연평균 성장률(CAGR) 17.35%로 확대될 것으로 예측됩니다. 표적 치료는 성장률이 비교적 낮은 편이지만, 폭넓은 기반과 향후 출시 예정인 수많은 저분자 의약품 덕분에 여전히 가장 큰 절대 매출을 올릴 것으로 전망됩니다.
지역별 분석
북미는 2025년 매출의 44.89%를 차지했습니다. 이는 견고한 메디케어(Medicare) 환급 제도, 여러 주에 걸친 조기 접근 제도, 그리고 전 세계에서 진행 중인 종양학 임상시험 프로토콜의 60%를 차지하는 성숙한 임상시험 생태계에 힘입은 결과입니다. 미국에서는 시판까지의 기간을 6-12개월 단축하는 ‘획기적 치료제 지정(Breakthrough Designation)’ 덕분에 급속한 보급이 진행되고 있습니다. 캐나다에서는 국민건강보험 제도가 잘 갖춰져 있지만, 주별 협상에 시간이 걸린다는 과제에 직면해 있습니다.
유럽은 2위를 차지하고 있으며, 2024년 유럽의약품청(EMA)이 8건의 조건부 종양학 승인을 내린 것이 호재로 작용하고 있습니다. 독일은 자금력이 풍부한 암 센터를 바탕으로 도입을 주도하고 있는 반면, 영국에서는 비용 대비 효과에 관한 더 엄격한 기준이 적용되고 있습니다. 스페인 등 남유럽 국가들은 EU 차원의 국경을 초월한 연구 네트워크의 지원을 받아 매력적인 임상시험 거점으로 자리 잡고 있습니다.
아시아태평양은 10.22%라는 가장 높은 연평균 성장률(CAGR)을 기록하고 있습니다. 중국은 승인 주기를 12개월로 단축하고 국내 생물학적 제제 생산 능력을 확대함으로써 접근성과 가격 경쟁을 촉진하고 있습니다. 급속한 고령화가 진행 중인 일본에서는 치슬렐리주맙과 같은 새로운 치료법이 적극적으로 도입되고 있습니다. 인도는 대규모 제네릭 의약품 공장과 활기찬 의료 관광 경제를 활용하고 있으며, 한국과 호주는 첨단 임상시험 거점을 제공합니다. 2035년까지 24% 증가할 것으로 예측되는 유병률 상승에 따라 수요는 높은 수준을 유지하고 있습니다.
기타 혜택:
- 엑셀 형식 시장 예측(ME) 시트
- 3개월간의 애널리스트 지원
자주 묻는 질문
목차
제1장 서론
제2장 조사 방법
제3장 개요
제4장 시장 구도
제5장 시장 규모와 성장 예측
제6장 경쟁 구도
제7장 시장 기회와 향후 전망
JHS 26.09.01According to Mordor Intelligence, the metastatic cancer treatment market size in 2026 is estimated at USD 91.44 billion, growing from 2025 value of USD 84.66 billion with 2031 projections showing USD 134.39 billion, growing at 8.01% CAGR over 2026-2031.
This report is Segmented by Treatment Type (Chemotherapy, Immunotherapy, Hormone Therapy, Targeted Therapy, and More), Cancer Type (Breast, Lung, Prostate, Melanoma, Colorectal, and More), End Users (Hospitals, Specialty Clinics, and More), and Geography (North America, Europe, Asia-Pacific, and More). The Market Forecasts are Provided in Terms of Value (USD).
Global Metastatic Cancer Treatment Market Trends and Insights
Accelerated FDA/EMA approvals & label expansions
Breakthrough therapy designations now cut median U.S. review times to 6.1 months, while the EMA issued eight conditional approvals for oncology products in 2024, including tisotumab vedotin and linvoseltamab, showing regulatory flexibility for high-need indications. Streamlined CAR-T umbrella evaluations further trim filing burdens by 40%, advantaging sponsors with robust manufacturing and late-stage assets. Joint clinical assessments under the European Health Technology Assessment framework promise aligned value dossiers across member states, narrowing launch gaps and accelerating revenue capture.
Surge in immunotherapy adoption
Checkpoint inhibitors now span 15 approved tumour types, with biomarker-driven selection lifting overall response rates to 45% in PD-L1-positive populations. Combination regimens that convert "cold" tumours into inflamed phenotypes through radiation or oncolytic viruses broaden eligibility beyond the historical 30% responsive cohort, and early data with linvoseltamab shows a 70% objective response in heavily pre-treated myeloma. Such outcomes cement the metastatic cancer treatment market as an innovation engine for durable survival gains.
High treatment costs & reimbursement hurdles
Average CAR-T pricing near USD 450,000 per course and antibody-drug conjugates exceeding USD 180,000 annually create affordability barriers. Total care costs soar another 60-80% due to specialised administration and toxicity management. Forty percent of U.S. commercial payers require prior authorisation for combination regimens, delaying optimal initiation, while European HTA bodies push for cost per quality-adjusted life year below EUR 100,000. Value-based contracting and biosimilar entry offer partial relief.
Other drivers and restraints analyzed in the detailed report include:
- Precision-medicine & companion-diagnostic uptake
- Tumor-agnostic approvals creating new revenue pools
- Severe immune-related adverse events (irAEs)
For complete list of drivers and restraints, kindly check the Table Of Contents.
Segment Analysis
Targeted therapies commanded 53.78% of 2025 revenue, anchored by robust biomarker-led protocols that cut empirical failure rates nearly in half. The segment enjoys stable formulary positioning and benefits from progressive label extensions. Chemotherapy persists mainly as a backbone for new combination protocols, and immunotherapy continues its expansion. Cell and gene therapy, though starting from a low base, posts the highest 17.35% CAGR. Legend Biotech's plan to double Carvykti slots to 10,000 in 2025 exemplifies the infrastructure build-out required to satisfy demand. Novartis is similarly scaling radioligand output to 250,000 annual doses, addressing historic supply shortages.
The metastatic cancer treatment market size for cell and gene therapy is projected to expand at 17.35% CAGR between 2026 and 2031 on the back of manufacturing advances and favourable reimbursement pilots. Targeted therapy, despite slower percentage growth, will still add the largest absolute revenue owing to its broad base and numerous upcoming small-molecule launches.
Complete Report Scope:
- By Treatment Type
- Chemotherapy
- Immunotherapy
- Targeted Therapy
- Hormone Therapy
- Cell & Gene Therapy
- Radiation Therapy
- By Cancer Type
- Breast
- Lung
- Prostate
- Colorectal
- Melanoma
- Liver
- Others
- By End User
- Hospitals
- Specialty Clinics
- Ambulatory Surgical Centres
- Academic & Research Institutes
- Geography
- North America
- United States
- Canada
- Mexico
- Europe
- Germany
- United Kingdom
- France
- Italy
- Spain
- Rest of Europe
- Asia-Pacific
- China
- Japan
- India
- South Korea
- Australia
- Rest of Asia-Pacific
- Middle East and Africa
- GCC
- South Africa
- Rest of Middle East and Africa
- South America
- Brazil
- Argentina
- Rest of South America
- North America
Geography Analysis
North America generated 44.89% of revenue in 2025, underpinned by robust Medicare reimbursement, multi-state early-access pathways, and a mature clinical-trial ecosystem that hosts 60% of active global oncology protocols. The United States enjoys rapid uptake thanks to breakthrough designations that shave 6-12 months off launch timelines. Canada provides universal coverage yet faces longer provincial negotiations.
Europe stands second, benefiting from the EMA's eight conditional oncology approvals in 2024. Germany leads uptake through well-funded cancer centres, while the United Kingdom imposes stricter cost-effectiveness hurdles. Southern European nations such as Spain have become attractive trial hubs, aided by EU-level cross-border research networks.
Asia-Pacific delivers the strongest 10.22% CAGR. China slashed approval cycles to 12 months and expanded domestic biologic capacity, boosting access and price competition. Japan, with its rapidly ageing demographic, embraces novel regimens like tislelizumab. India leverages large generic plants and a vibrant medical-tourism economy, while South Korea and Australia supply sophisticated trial sites. Rising incidence-projected up 24% by 2035-keeps demand high.
- Bristol-Myers Squibb
- Roche
- Merck
- Johnson & Johnson
- Novartis
- AstraZeneca
- Abbvie
- Pfizer
- Eli Lilly and Company
- Amgen
- GlaxoSmithKline
- Sanofi
- Bayer
- Astellas Pharma
- Seagen
- Gilead Sciences
- Regeneron Pharmaceuticals
- Takeda Pharmaceuticals
- BeiGene Ltd.
- Daiichi Sankyo Co., Ltd.
Additional Benefits:
- The market estimate (ME) sheet in Excel format
- 3 months of analyst support
TABLE OF CONTENTS
1 Introduction
- 1.1 Study Assumptions & Market Definition
- 1.2 Scope of the Study
2 Research Methodology
3 Executive Summary
4 Market Landscape
- 4.1 Market Overview
- 4.2 Market Drivers
- 4.2.1 Rising Prevalence Of Metastatic Cancers
- 4.2.2 Accelerated FDA/EMA Approvals & Label Expansions
- 4.2.3 Surge In Immunotherapy Adoption
- 4.2.4 Precision-Medicine & Companion-Diagnostic Uptake
- 4.2.5 Tumor-Agnostic Approvals Creating New Revenue Pools
- 4.2.6 Decentralized Clinical-Trial Models Shortening TTM
- 4.3 Market Restraints
- 4.3.1 High Treatment Costs & Reimbursement Hurdles
- 4.3.2 Severe Immune-Related Adverse Events (irAEs)
- 4.3.3 Limited Efficacy In Cold Tumors
- 4.3.4 Radionuclide & Cell-Therapy Supply-Chain Bottlenecks
- 4.4 Porter's Five Forces
- 4.4.1 Threat of New Entrants
- 4.4.2 Bargaining Power of Buyers
- 4.4.3 Bargaining Power of Suppliers
- 4.4.4 Threat of Substitutes
- 4.4.5 Intensity of Competitive Rivalry
5 Market Size & Growth Forecasts (Value, USD)
- 5.1 By Treatment Type
- 5.1.1 Chemotherapy
- 5.1.2 Immunotherapy
- 5.1.3 Targeted Therapy
- 5.1.4 Hormone Therapy
- 5.1.5 Cell & Gene Therapy
- 5.1.6 Radiation Therapy
- 5.2 By Cancer Type
- 5.2.1 Breast
- 5.2.2 Lung
- 5.2.3 Prostate
- 5.2.4 Colorectal
- 5.2.5 Melanoma
- 5.2.6 Liver
- 5.2.7 Others
- 5.3 By End User
- 5.3.1 Hospitals
- 5.3.2 Specialty Clinics
- 5.3.3 Ambulatory Surgical Centres
- 5.3.4 Academic & Research Institutes
- 5.4 Geography
- 5.4.1 North America
- 5.4.1.1 United States
- 5.4.1.2 Canada
- 5.4.1.3 Mexico
- 5.4.2 Europe
- 5.4.2.1 Germany
- 5.4.2.2 United Kingdom
- 5.4.2.3 France
- 5.4.2.4 Italy
- 5.4.2.5 Spain
- 5.4.2.6 Rest of Europe
- 5.4.3 Asia-Pacific
- 5.4.3.1 China
- 5.4.3.2 Japan
- 5.4.3.3 India
- 5.4.3.4 South Korea
- 5.4.3.5 Australia
- 5.4.3.6 Rest of Asia-Pacific
- 5.4.4 Middle East and Africa
- 5.4.4.1 GCC
- 5.4.4.2 South Africa
- 5.4.4.3 Rest of Middle East and Africa
- 5.4.5 South America
- 5.4.5.1 Brazil
- 5.4.5.2 Argentina
- 5.4.5.3 Rest of South America
- 5.4.1 North America
6 Competitive Landscape
- 6.1 Market Concentration
- 6.2 Market Share Analysis
- 6.3 Company Profiles (includes Global level Overview, Market level overview, Core Segments, Financials as available, Strategic Information, Market Rank/Share for key companies, Products & Services, and Recent Developments)
- 6.3.1 Bristol Myers Squibb Company
- 6.3.2 F. Hoffmann-La Roche Ltd.
- 6.3.3 Merck & Co., Inc.
- 6.3.4 Johnson & Johnson
- 6.3.5 Novartis AG
- 6.3.6 AstraZeneca PLC
- 6.3.7 AbbVie Inc.
- 6.3.8 Pfizer Inc.
- 6.3.9 Eli Lilly and Company
- 6.3.10 Amgen Inc.
- 6.3.11 GSK plc
- 6.3.12 Sanofi S.A.
- 6.3.13 Bayer AG
- 6.3.14 Astellas Pharma Inc.
- 6.3.15 Seagen Inc.
- 6.3.16 Gilead Sciences, Inc.
- 6.3.17 Regeneron Pharmaceuticals, Inc.
- 6.3.18 Takeda Pharmaceutical Co. Ltd.
- 6.3.19 BeiGene Ltd.
- 6.3.20 Daiichi Sankyo Co., Ltd.
7 Market Opportunities & Future Outlook
- 7.1 White-space & Unmet-need Assessment