

|
시장보고서
상품코드
2116644
변압기유 시장 : 점유율 분석, 업계 동향과 통계, 성장 예측(2026-2031년)Transformer Oil - Market Share Analysis, Industry Trends & Statistics, Growth Forecasts (2026 - 2031) |
||||||
 Mordor Intelligence
Mordor Intelligence에 의하면, 변압기유 시장 규모는 2025년 55억 9,000만 리터에서 2026년에는 10억 9,000만 리터로 확대되어 2026-2031년까지 CAGR 1.31%로 성장을 지속하여, 2031년에는 11억 6,000만 리터에 이를 것으로 예측됩니다.
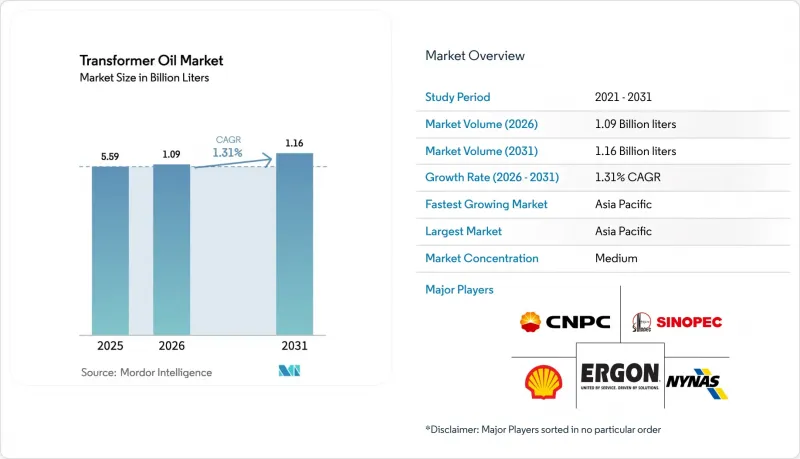
본 보고서는 유형(광물계, 실리콘계, 바이오계), 용도(변압기, 개폐 장치, 차단기, 기타), 최종 사용자 산업(발전, 송배전, 철도·지하철, 기타), 지역(아시아태평양, 북미, 유럽, 남미, 중동 및 아프리카)별로 분류되어 있습니다. 시장 예측은 수량(리터) 기준으로 제시되어 있습니다.
전 세계 변압기유 시장 동향 및 인사이트
아시아태평양의 전력망 확장
아시아태평양의 전력 사업자들은 송전망에 중복성을 구축하고 있으며, 이는 변압기유 수요를 비약적으로 끌어올리고 있습니다. 중국의 국가전망은 2025년에 890억 달러를 투자하여 초고압 송전선로 확장을 추진하고 있으며, 1,000kV 변압기 1대당 1만-2만 리터의 변압기유가 필요합니다. 인도는 2032년까지 1,274GVA의 신규 변전 용량을 확보하기 위해 9조 1,600억 루피(1,090억 달러)를 예산에 편성했습니다. 아세안(ASEAN) 프로젝트에서는 열대 지역의 습도에 내성이 있는 합성 에스테르계 또는 실리콘계 절연유에 의존하는 최대 1만 3,780MW 규모의 국경을 넘는 송전선이 추가될 예정입니다. 투자의 주요 동력은 전기화보다는 송전망의 신뢰성이며, 이는 변압기유 시장에 안정적인 기반을 마련해 주고 있습니다.
OECD 시장의 노후 변압기 교체
북미와 유럽의 전력 회사들은 1970년대부터 1980년대에 걸쳐 설치되어 수명이 다해가는 변압기 군에 직면해 있습니다. 미국에서는 전자강판 부족도 한 원인으로 작용하여, 교체용 유닛의 리드타임이 24개월까지 연장되고 있습니다. 유럽에서는 해상 풍력발전을 통합하기 위해 400/100kV 변전소의 현대화가 진행되고 있으며, 2030년까지 연간 3만 4,000톤의 변압기유 수요가 예상됩니다. 호주에서는 보험사의 강력한 요청에 따라 지방 설비에 난연성 에스테르유를 사용한 개보수 작업이 진행되고 있습니다. 교체 일정은 여전히 편차를 보이고 있으며, 일본과 한국에서는 예산상의 이유로 교체가 연기되고 있어, 이로 인해 광물유 수요가 장기적으로 유지되고 있습니다.
유럽 정유시설 폐쇄로 인한 그룹 I 기유 공급 부족
유럽의 가동 중단으로 인해 2024년 이후 그룹 I 기유의 생산 능력이 200만 톤 감소하여, 블렌더들은 고가의 원료를 수입할 수밖에 없는 상황입니다. 15-20%의 운임 프리미엄과 6개월의 납기 지연이 가격 전망을 불투명하게 만들고 있습니다. 북미의 배합 제조업체들은 그룹 II 기유로의 전환을 추진하고 있으며, 유전성 성능을 유지하기 위해서는 배합 재검토가 필수적입니다. 한국과 싱가포르의 아시아계 공급업체들은 수출을 확대하고 있지만, 그 물류 체인은 비용 증가와 품질 편차를 초래하고 있습니다. 따라서 공급 부족으로 인해 변압기유 시장의 연평균 성장률(CAGR)은 약 0.2포인트 하락했습니다.
부문 분석
2025년 판매량 중 광물성 제품이 90.12%를 차지하고 있으며, 이는 확고한 조달 관행과 낮은 단가를 반영한 것입니다. 바이오계 에스테르는 K급 방화 성능과 신속한 생분해성을 강점으로 2031년까지 연평균 성장률(CAGR) 7.92%로 확대되고 있습니다. 천연 에스테르는 화재 위험 및 환경 책임이 가장 높은 데이터센터와 병원에서 선호되고 있습니다. 폴리올을 기반으로 설계된 합성 에스테르는 높은 열 사이클 조건에서 뛰어난 성능을 발휘하기 때문에 해상 풍력 발전 플랫폼이나 철도용 견인 변압기에서 선호되는 선택지가 되고 있습니다. 따라서 바이오계 에스테르의 변압기유 시장 규모는 기존 광물계 부문보다 빠르게 확대되고 있습니다.
유럽에서는 보험사의 인센티브와 탄소 공시 의무를 배경으로, 신규 설비의 약 3분의 1에서 천연 에스테르 사용이 지정되고 있습니다. 북미에서는 전력 회사가 장기적인 성능을 검증하는 단계에 있기 때문에 채택률은 여전히 15-20%에 그치고 있습니다. 아시아태평양에서는 여전히 가격이 주요 결정 요인으로 작용하고 있지만, 수역 인근에서 생분해성 유체의 사용을 의무화하는 중국의 법안 초안에 따라 2030년까지 설치 기반의 10-15%가 에스테르 계열로 전환될 가능성이 있습니다. 실리콘 오일은 200°C를 초과하는 온도대에서 틈새 시장을 차지하고 있으며, 특히 용광로용 변압기에서 주목받고 있지만, 비용 측면의 과제에 직면해 있습니다. 이러한 동향들이 맞물리면서 변압기유 시장의 제품 구성이 재편되고 있습니다.
지역별 분석
아시아태평양은 2025년에 전 세계 출하량의 47.77%를 차지하며, 2031년까지 연평균 1.82%의 성장률을 보일 것으로 전망됩니다. 중국의 890억 달러 규모의 송전망 계획과 인도의 1,090억 달러 규모의 송전 계획이 이 지역의 주도적 위치를 뒷받침하고 있습니다. 아세안(ASEAN)의 상호 연결 프로젝트에서는 높은 습도나 염수 비말이 있는 환경에서도 작동 가능한 고성능 에스테르가 요구되고 있습니다. 일본이나 한국 등 성숙한 시장에서는 고효율 기기로의 교체 수요가 꾸준히 발생하고 있습니다.
북미는 2025년 출하량에서 일정 비율을 차지하고 있습니다. 미국 에너지부(DOE)의 규제, 해상 풍력 투자, 12GW 규모의 신규 축전지 설비가 성장의 기반이 되고 있습니다. 캐나다의 수출 지향적인 송전망 갱신과 멕시코의 변전소 현대화도 수요 증가에 기여하고 있습니다.
유럽 시장 점유율은 30GW 규모의 해상 풍력 발전과 난연성 유체 사용이 규정된 도시 지역 변전소의 개보수에 의해 견인되고 있습니다. 400/100kV 변압기의 교체로 인해 2030년까지 연간 3만 4,000톤의 오일 수요가 추가될 전망입니다.
남미와 중동 및 아프리카 시장 점유율은 이에 비해 현저히 낮습니다. 브라질은 수력 발전 자산을 통합하기 위해 아마존 지역으로 송전선을 연장하고 있는 반면, 사우디아라비아의 ‘비전 2030’에서는 송전망 업그레이드에 500억 달러가 배정되었습니다. 남아프리카와 나이지리아는 각각 도시 지역의 전력 공급 안정화와 농촌 지역의 전기화에 중점을 두고 있으며, 저비용의 광물성 오일을 선호하고 있지만, 기부금에 의한 프로젝트에서는 점차 에스테르 계열의 오일을 시험적으로 도입하고 있습니다.
기타 혜택
- 엑셀 형식 시장 예측(ME) 시트
- 3개월간의 애널리스트 지원
자주 묻는 질문
목차
제1장 서론
제2장 조사 방법
제3장 개요
제4장 시장 구도
제5장 시장 규모와 성장 예측(수량)
제6장 경쟁 구도
제7장 시장 기회와 향후 전망
JHS 26.09.01According to Mordor Intelligence, the transformer oil market size is expected to grow from 5.59 Billion liters in 2025 to 1.09 Billion liters in 2026 and is forecast to reach 1.16 Billion liters by 2031 at 1.31% CAGR over 2026-2031.
This report is Segmented by Type (Mineral-Based, Silicone-Based, and Bio-Based), Application (Transformer, Switchgear, Circuit Breakers, and More), End-User Industry (Power Generation, Transmission and Distribution, Railways and Metros, and Other), and Geography (Asia-Pacific, North America, Europe, South America, and Middle East and Africa). Market Forecasts are Provided in Terms of Volume (liters).
Global Transformer Oil Market Trends and Insights
Growing Electric Grids in Asia-Pacific
Asia-Pacific utilities are building redundancy into networks, driving step-change transformer oil demand. China's State Grid invested USD 89 billion in 2025 to extend ultra-high-voltage corridors, and each 1,000 kV unit requires 10,000 to 20,000 liters of oil. India has earmarked Rs 9.16 trillion (USD 109 billion) for 1,274 GVA of new transformation capacity by 2032. ASEAN projects will add up to 13,780 MW of cross-border links that rely on synthetic-ester or silicone fluids resilient to tropical humidity. Investment is driven less by electrification and more by network reliability, creating a stable base for the transformer oil market.
Upgradation of Aging Transformers in OECD Markets
North American and European utilities are confronting end-of-life fleets installed during the 1970s-1980s. US lead times have lengthened to 24 months for replacement units, partly due to shortages of electrical steel. Europe anticipates 34,000 tonnes of annual oil demand by 2030 as 400/100 kV substations are modernized to integrate offshore wind. Australia is retrofitting rural assets with fire-resistant esters at insurers' insistence. Replacement schedules remain uneven; Japan and South Korea are delaying upgrades for budgetary reasons, preserving long-tail mineral demand.
Tight Group-I Base-Oil Supply After European Refinery Closures
European shutdowns have removed 2 million tonnes of Group-I capacity since 2024, forcing blenders to import higher-priced feedstock. Freight premiums of 15-20% and six-month delivery lags undermine pricing visibility. North American formulators are migrating to Group-II base oils, necessitating reformulation to match dielectric performance. Asian suppliers in South Korea and Singapore are scaling exports, but their logistics chains add cost and quality variability. Supply tightness, therefore, subtracts about 0.2 percentage points from the transformer oil market CAGR.
Other drivers and restraints analyzed in the detailed report include:
- DOE-Mandated Efficiency Standards for Distribution Transformers
- Offshore-Wind Converter Platforms Demanding High-Flash-Point Oils
- Mineral-Oil Environmental Liabilities and Disposal Costs
For complete list of drivers and restraints, kindly check the Table Of Contents.
Segment Analysis
Mineral-based products accounted for 90.12% of the 2025 volume, reflecting entrenched procurement habits and lower unit cost. Bio-based esters are advancing at a 7.92% CAGR to 2031, anchored in K-class fire-safety performance and rapid biodegradability. Natural esters find favor in data centers and hospitals where fire risks and environmental liabilities are highest. Synthetic esters, engineered from polyol bases, outperform under high thermal cycling, making them the preferred choice for offshore wind platforms and rail traction transformers. The transformer oil market size for bio-based esters is therefore expanding faster than the legacy mineral segment.
Europe specifies natural esters in roughly one-third of new installations, spurred by insurer incentives and carbon-disclosure mandates. North American adoption remains at 15-20% as utilities validate long-term performance. Asia-Pacific remains price-driven, yet China's draft law requiring biodegradable fluids near water bodies could shift 10-15% of its installed base to esters by 2030. Silicone oils occupy a niche for temperatures above 200°C, notable in furnace transformers, but face cost hurdles. Collectively, these trends reshape the product mix within the transformer oil market.
Complete Report Scope:
- By Type
- Mineral-Based
- Silicone-Based
- Bio-Based (Natural and Synthetic Esters)
- By Application
- Transformer
- Switchgear
- Circuit Breakers
- Capacitors
- Other Applications (reactor, etc.)
- By End-User Industry
- Power Generation
- Transmission and Distribution
- Railways and Metros
- Other End-user Industries
- By Geography
- Asia-Pacific
- China
- India
- Japan
- South Korea
- Indonesia
- Malaysia
- Thailand
- Vietnam
- Rest of Asia-Pacific
- North America
- United States
- Canada
- Mexico
- Europe
- Germany
- United Kingdom
- France
- Italy
- Spain
- Nordic Countries
- Russia
- Turkey
- Rest of Europe
- South America
- Brazil
- Argentina
- Rest of South America
- Middle-East and Africa
- Saudi Arabia
- United Arab Emirates
- Qatar
- South Africa
- Nigeria
- Egypt
- Rest of Middle-East and Africa
- Asia-Pacific
Geography Analysis
Asia-Pacific held 47.77% of global volume in 2025 and is expected to grow at 1.82% annually to 2031. China's USD 89 billion grid program and India's USD 109 billion transmission plan underpin the region's leadership. ASEAN interconnection projects call for high-performance esters able to operate in humid, salt-spray environments. Mature markets such as Japan and South Korea generate steady replacement demand for higher-efficiency units.
North America contributed just over some of the 2025 volume. US DOE rules, offshore-wind investments, and 12 GW of new battery storage underpin growth. Canada's export-oriented transmission upgrades and Mexico's substation modernizations add incremental demand.
Europe's market share is driven by 30 GW of offshore wind and urban-substation retrofits that specify fire-resistant fluids. Replacement of 400/100 kV transformers adds 34,000 tonnes of annual oil demand by 2030.
South America and the Middle East & Africa together represent a significantly lower market share. Brazil is extending transmission lines into the Amazon to integrate hydro assets, while Saudi Arabia's Vision 2030 allocates USD 50 billion for grid upgrades. South Africa and Nigeria focus on urban reliability and rural electrification respectively, favoring lower-cost mineral oils but gradually trialing esters in donor-funded projects.
- APAR Industries Ltd.
- Calumet, Inc.
- Cargill, Incorporated
- Chevron Corporation
- China Petrochemical Corporation
- Ergon, Inc.
- Exxon Mobil Corporation
- Gulf Oil International Ltd
- Lukoil
- NYNAS AB
- Petro-Canada Lubricants Inc.
- Phillips 66 Company
- Raj Petro
- Repsol
- San Joaquin Refining Co. Inc.
- Saudi Arabian Oil Co.
- SAVITA OIL TECHNOLOGIES LIMITED
- Shell plc
- TotalEnergies
Additional Benefits:
- The market estimate (ME) sheet in Excel format
- 3 months of analyst support
TABLE OF CONTENTS
1 Introduction
- 1.1 Study Assumptions & Market Definition
- 1.2 Scope of the Study
2 Research Methodology
3 Executive Summary
4 Market Landscape
- 4.1 Market Overview
- 4.2 Market Drivers
- 4.2.1 Growing electric grids in Asia-Pacific
- 4.2.2 Up-gradation of aging transformers in OECD markets
- 4.2.3 DOE-mandated efficiency standards for distribution transformers
- 4.2.4 Offshore-wind converter platforms demanding high-flash-point oils
- 4.2.5 Utility-scale battery storage build-out
- 4.3 Market Restraints
- 4.3.1 Tight Group-I base-oil supply after European refinery closures
- 4.3.2 Mineral-oil environmental liabilities and disposal costs
- 4.3.3 Ester-fluid price premium in cost-sensitive Asia-Pacific utilities
- 4.4 Value Chain Analysis
- 4.5 Porter's Five Forces
- 4.5.1 Bargaining Power of Suppliers
- 4.5.2 Bargaining Power of Buyers
- 4.5.3 Threat of New Entrants
- 4.5.4 Threat of Substitutes
- 4.5.5 Degree of Competition
5 Market Size and Growth Forecasts (Volume )
- 5.1 By Type
- 5.1.1 Mineral-Based
- 5.1.2 Silicone-Based
- 5.1.3 Bio-Based (Natural and Synthetic Esters)
- 5.2 By Application
- 5.2.1 Transformer
- 5.2.2 Switchgear
- 5.2.3 Circuit Breakers
- 5.2.4 Capacitors
- 5.2.5 Other Applications (reactor, etc.)
- 5.3 By End-User Industry
- 5.3.1 Power Generation
- 5.3.2 Transmission and Distribution
- 5.3.3 Railways and Metros
- 5.3.4 Other End-user Industries
- 5.4 By Geography
- 5.4.1 Asia-Pacific
- 5.4.1.1 China
- 5.4.1.2 India
- 5.4.1.3 Japan
- 5.4.1.4 South Korea
- 5.4.1.5 Indonesia
- 5.4.1.6 Malaysia
- 5.4.1.7 Thailand
- 5.4.1.8 Vietnam
- 5.4.1.9 Rest of Asia-Pacific
- 5.4.2 North America
- 5.4.2.1 United States
- 5.4.2.2 Canada
- 5.4.2.3 Mexico
- 5.4.3 Europe
- 5.4.3.1 Germany
- 5.4.3.2 United Kingdom
- 5.4.3.3 France
- 5.4.3.4 Italy
- 5.4.3.5 Spain
- 5.4.3.6 Nordic Countries
- 5.4.3.7 Russia
- 5.4.3.8 Turkey
- 5.4.3.9 Rest of Europe
- 5.4.4 South America
- 5.4.4.1 Brazil
- 5.4.4.2 Argentina
- 5.4.4.3 Rest of South America
- 5.4.5 Middle-East and Africa
- 5.4.5.1 Saudi Arabia
- 5.4.5.2 United Arab Emirates
- 5.4.5.3 Qatar
- 5.4.5.4 South Africa
- 5.4.5.5 Nigeria
- 5.4.5.6 Egypt
- 5.4.5.7 Rest of Middle-East and Africa
- 5.4.1 Asia-Pacific
6 Competitive Landscape
- 6.1 Market Concentration
- 6.2 Strategic Moves
- 6.3 Market Share(%)/Ranking Analysis
- 6.4 Company Profiles (includes Global level Overview, Market level overview, Core Segments, Financials as available, Strategic Information, Market Rank/Share for key companies, Products and Services, and Recent Developments)
- 6.4.1 APAR Industries Ltd.
- 6.4.2 Calumet, Inc.
- 6.4.3 Cargill, Incorporated
- 6.4.4 Chevron Corporation
- 6.4.5 China Petrochemical Corporation
- 6.4.6 Ergon, Inc.
- 6.4.7 Exxon Mobil Corporation
- 6.4.8 Gulf Oil International Ltd
- 6.4.9 Lukoil
- 6.4.10 NYNAS AB
- 6.4.11 Petro-Canada Lubricants Inc.
- 6.4.12 Phillips 66 Company
- 6.4.13 Raj Petro
- 6.4.14 Repsol
- 6.4.15 San Joaquin Refining Co. Inc.
- 6.4.16 Saudi Arabian Oil Co.
- 6.4.17 SAVITA OIL TECHNOLOGIES LIMITED
- 6.4.18 Shell plc
- 6.4.19 TotalEnergies
7 Market Opportunities and Future Outlook
- 7.1 White-Space and Unmet-Need Assessment
- 7.2 Growing Demand for Bio-Based Transformer Oils


