

|
시장보고서
상품코드
2117243
위성 IoT 통신 시장 : 시장 점유율 분석, 업계 동향 및 통계, 성장 예측(2026-2031년)Satellite IoT Communication - Market Share Analysis, Industry Trends & Statistics, Growth Forecasts (2026 - 2031) |
||||||
 Mordor Intelligence
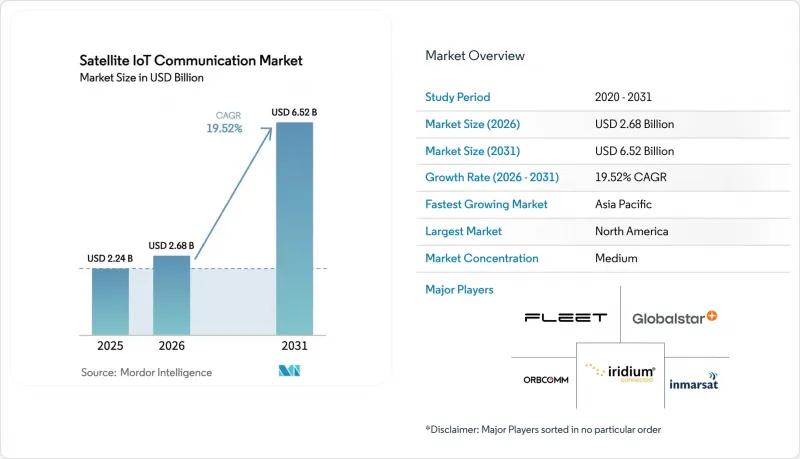
Mordor Intelligence에 의하면, 위성 IoT 통신 시장 규모는 2025년에 22억 4,000만 달러로 평가되었고, 2026년 26억 8,000만 달러에서 2031년까지 65억 2,000만 달러에 이를 것으로 예측되며, 예측 기간(2026-2031년) CAGR은 19.52%를 나타낼 전망입니다.
본 보고서는 궤도 유형별(저궤도, 중궤도, 정지궤도), 주파수 대역별(L대역, S대역 등), 최종 사용자 산업별(해사·해운, 농림업 등), 서비스 유형별(위성 자산 추적, 원격 감시·제어 등) 및 지역별로 분류되어 있습니다. 시장 전망은 금액(달러) 기준으로 제시되어 있습니다.
세계의 위성 IoT 통신 시장 동향 및 인사이트
5G-Advanced NTN 사양의 개발 및 성장
릴리스 17 및 18 사양에서는 지상 및 위성 연결이 통합되어 듀얼 모드 칩셋이 불필요해졌으며, 기기의 부품 원가를 최대 30% 절감했습니다. 표준에 통합된 도플러 시프트 보정 및 타이밍 어드밴스 알고리즘을 통해 고속으로 이동하는 저궤도(LEO) 우주선으로부터의 링크가 안정화되어, 원격 로봇 공학 등 지연에 민감한 애플리케이션이 지원됩니다. FCC 및 ETSI를 비롯한 규제 당국은 현재 이러한 규정을 기기 인증에 반영하여, 발사부터 시장 출시까지의 주기를 단축하고 있습니다. 원활한 로밍을 통해 지상 통신이 두절된 경우에도 산업용 IoT 장비는 연결을 유지할 수 있으며, 이는 이상 기상による 비상 상황에서 그 장점이 더욱 두드러집니다. 또한, 이 프레임워크는 스마트폰을 통한 네이티브 연결도 가능하게 하여 소비자의 친숙도를 높이고, 이는 기업 수요로 이어질 것입니다.
200kg 미만의 소형 위성 제조 및 발사 비용의 급격한 감소
표준화된 위성 섀시, 적층 가공 및 부품 대량 발주를 통해 위성 1기당 제조 비용은 2020년 50만 달러에서 2024년에는 15만 달러 미만으로 감소했습니다. 라이드셰어 미션의 발사 비용이 현재 1kg당 5,000달러 미만으로 떨어졌기 때문에 24기의 위성으로 구성된 IoT 콘스텔레이션을 8,000만 달러 미만으로 궤도에 투입하는 것이 가능해졌으며, 벤처 캐피털이 자금 지원을 승인하는 자금 조달 기준을 충족할 수 있게 되었습니다. 신규 진출기업들은 이 비용 곡선을 활용하여, 광대역 위성을 개조하는 대신 저속 텔레메트리 용도에 맞게 전력 예산과 안테나 패턴을 최적화하고 있습니다. 예를 들어, 농업용 네트워크의 경우, 토양 센서에서 전송되는 패킷 통신에 최적화된 협대역 L-밴드 페이로드를 발사하고 있습니다. 궤도상 정비를 통해 우주선의 수명이 연장되고 보급의 필요성이 줄어들기 때문에 비용 하락 추세는 앞으로도 계속될 것으로 예측됩니다.
혼잡한 L대역 및 S대역에서의 혼잡과 간섭
L-밴드 및 S-밴드 통신 링크에서는 해운 및 물류 사용자가 엔드포인트를 늘림에 따라 패킷 충돌이 증가하고 있으며, 2023년부터 2024년에 걸쳐 간섭 사건이 45% 증가했습니다. 항로에서 트래픽이 피크에 달할 때 처리량이 30% 저하될 가능성이 있으며, 재전송을 반복해야 함으로써 센서의 배터리가 소모됩니다. 음성 회선용으로 설계된 기존의 조정 방식으로는 수백만 건에 달하는 버스트 형태의 IoT 통신을 처리할 수 없습니다. 사업자들은 일부 트래픽을 Ka 대역으로 이전하고 있지만, 레인페이드와 단말기 비용의 높음이 대규모 도입을 방해하고 있습니다. 적응형 빔포밍 및 동적 채널 할당 기술이 성숙해지기 전까지는 서비스 품질의 불확실성이 단기적인 보급을 둔화시키고, 위성 IoT 통신 시장의 성장을 저해할 가능성이 있습니다.
부문 분석
2025년, 저궤도(LEO) 플랫폼은 자율주행차의 텔레메트리 및 폐쇄 루프 산업 제어를 지원하는 100밀리초 미만의 왕복 지연 시간을 활용하여 위성 IoT 통신 시장의 61.65% 점유율을 차지했습니다. 이러한 우위는 때로는 1,000대를 넘는 우주선의 대량 생산으로 이어져, 공급업체로부터의 수량 할인 및 신속한 제품 개선 주기를 실현하고 있습니다. 한편, 중궤도(MEO) 네트워크는 연평균 성장률(CAGR) 20.05%로 확대되고 있습니다. 이는 8-20기의 위성으로 지구 전체를 커버할 수 있어, LEO 위성군에 비해 위성군에 대한 설비 투자를 최대 50%까지 절감할 수 있기 때문입니다.
운영상의 판단 기준은 고객 그룹에 따라 다릅니다. 외딴 지역의 광산에 설치된 배터리 구동 센서의 경우, 링크 예산이 낮아 배터리 수명이 연장된다는 이유로 LEO가 선호되는 경우가 많습니다. 반면, 해운 사업자들은 LEO가 통과할 때 일시적인 통신 단절이 발생하는 극지 항로에서 끊김 없는 커버리지를 확보할 수 있는 MEO에 주목하고 있습니다. 규제 당국은 현재 궤도 슬롯 신청을 우주 쓰레기 저감 계획과 대조하여 심사하고 있으며, 이러한 요인으로 인해 향후 발사는 궤도 수명이 긴 고고도로 전환될 가능성이 있습니다. 따라서 두 아키텍처가 공존하며, 위성 IoT 통신 시장의 다양한 서비스 수준 계약(SLA)을 뒷받침하고 있습니다.
L-밴드는 2025년 매출 점유율에서 28.25%를 유지했으며, 해운 및 농작물 모니터링 용도에 필요한, 나무를 투과하는 전천후 통신 링크로서 신뢰를 얻고 있습니다. 단말기는 밀리와트 단위의 전력으로 작동할 수 있어 배터리 수명을 연장하고, 가격에 민감한 농업 관련 기업도 이용하기 쉬운 요금 설정을 실현하고 있습니다. Ka 대역은 기상 조건의 영향을 받기 쉽다는 단점이 있지만, 풍부한 주파수 대역폭 덕분에 이미지 및 동영상을 중심으로 한 엣지 분석을 지원하는 높은 처리량을 제공할 수 있어 20.12%라는 업계 최고 수준의 연평균 성장률(CAGR)을 기록하고 있습니다.
전환 경로는 산업별로 다릅니다. 환경 모니터링 기관은 멀티 스펙트럼 데이터 스트리밍에 Ka 대역을 채택하는 반면, 자산 추적을 수행하는 차량군은 단말기 비용이 낮아질 때까지 L 대역을 계속 사용하는 경향이 있습니다. 주파수 대역 조정에 관한 과제는 여전히 남아 있습니다. 신규 시장 진출기업는 전 세계 주파수 등록을 보유한 기존 사업자와 협상해야 하며, 이는 시장 진입을 지연시킬 가능성도 있지만, 동시에 서비스 품질을 보호하는 결과로 이어지기도 합니다. 이러한 균형을 고려할 때, 사업자들이 주파수 고유의 제약을 회피하기 위해 페이로드를 조합하는 멀티밴드 방식의 미래가 예상되며, 위성 IoT 통신 시장에서 솔루션의 폭이 넓어질 것으로 전망됩니다.
지역별 분석
북미는 국방 감시 예산과 지방 확장을 지원하는 ‘ReConnect’ 보조금의 뒷받침을 받아 2025년 매출의 35.05%를 차지했습니다. 북극권의 주권 순찰을 배경으로 캐나다에서는 내한성 센서 구매가 진행되고 있는 반면, 미국의 연안 항로에서는 ESG 스코어카드 요건을 충족하기 위해 배출량 추적 시스템이 도입되고 있습니다. 멕시코 해안 지역의 제조업 수출에서는 내륙 공장과 국경 검문소 간의 적시 재고 흐름을 유지하기 위해 위성 원격 측정 기술이 활용되고 있습니다.
아시아태평양은 중국, 인도 및 동남아시아 국가들이 디지털 농업을 확대함에 따라 2031년까지 20.85%라는 가장 높은 연평균 성장률(CAGR)을 기록할 전망입니다. 중국의 농촌 진흥 정책에 따라 공공 자금이 협동조합 소유의 센서 네트워크에 투입되고 있으며, 또한 인도의 국내 발사 능력 향상으로 인해 현지 시스템 통합사업자의 접근 비용이 낮아지고 있습니다. 일본과 한국에서는 끊김 없는 IoT 데이터 피드에 기반한 공장 현장의 자동화가 진행되고 있는 반면, 호주의 광산 지역에서는 운반 도로나 컨베이어 라인에 위성 게이트웨이를 설치하여 설비의 상태를 모니터링하고 있습니다.
유럽에서는 ESG 규제와 CEF-Digital 펀드의 지원에 힘입어 꾸준한 확장이 이루어지고 있습니다. 독일의 정밀 농업 보조금에서는 위성 이용료가 지원되며, 프랑스의 수산 양식 기업은 지속적인 원격 측정 기술을 통해 추적성 요건을 충족하고 있습니다. 영국에서는 위성 분석을 활용해 선석 배정을 최적화하는 스마트 항만 구상이 추진되고 있습니다. 이러한 성숙한 지역 외에도 중동 및 아프리카가 새로운 기회의 보고로 부상하고 있으며, 석유 사업자와 농업 기술(AgriTech) 프로그램이 위성 IoT를 활용해 지상 통신 사각지대를 극복함에 따라, 위성 IoT 통신 시장의 지리적 수익 다각화가 진행되고 있습니다.
기타 혜택 :
- 엑셀 형식 시장 예측(ME) 시트
- 3개월간 애널리스트 지원
자주 묻는 질문
목차
제1장 서론
제2장 조사 방법
제3장 개요
제4장 시장 구도
제5장 시장 규모 및 성장 예측
제6장 경쟁 구도
제7장 시장 기회 및 향후 전망
AJY 26.09.01According to Mordor Intelligence, the satellite ioT communication market size was valued at USD 2.24 billion in 2025 and estimated to grow from USD 2.68 billion in 2026 to reach USD 6.52 billion by 2031, at a CAGR of 19.52% during the forecast period (2026-2031).
This report is Segmented by Type of Orbit (Low-Earth Orbit, Medium-Earth Orbit, Geostationary Orbit), Frequency Band (L-Band, S-Band, and More), End-User Industry (Maritime and Shipping, Agriculture and Forestry, and More), Service Type (Satellite Asset Tracking, Remote Monitoring and Control, and More), and Geography. The Market Forecasts are Provided in Terms of Value (USD).
Global Satellite IoT Communication Market Trends and Insights
Development and Growth of 5G-Advanced NTN Specifications
Release 17 and 18 specifications unify terrestrial and satellite connectivity, removing the need for dual-mode chipsets and cutting device bill-of-materials by up to 30%. Doppler shift compensation and timing-advance algorithms built into the standard stabilize links from rapidly moving LEO spacecraft, supporting delay-sensitive applications such as remote robotics. Regulators, including the FCC and ETSI, now embed these rules in device certification, trimming launch-to-market cycles. Seamless roaming means industrial IoT installations remain connected during terrestrial outages, an advantage heightened during extreme-weather emergencies. The framework also opens native smartphone connectivity, driving consumer familiarity that will spill over into enterprise demand.
Rapid Drop in Manufacturing and Launch Costs of Sub-200 kg Satellites
Standardized satellite buses, additive manufacturing, and bulk component orders have cut per-unit build costs from USD 500,000 in 2020 to under USD 150,000 in 2024. With launch fees now below USD 5,000 per kg on rideshare missions, a 24-satellite IoT constellation can orbit for under USD 80 million, hitting financing thresholds that venture capital is willing to underwrite. New entrants exploit this cost curve to tailor power budgets and antenna patterns for low-rate telemetry instead of retrofitting broadband birds. Agriculture-focused networks, for example, fly narrow-beam L-Band payloads optimized for soil-sensor packets. Cost trajectories are expected to fall further as in-orbit servicing extends spacecraft life, reducing replenishment needs.
Congestion and Interference in Crowded L- and S-Bands
L- and S-band links face growing packet collisions as maritime and logistics users add endpoints, with interference incidents up 45% between 2023 and 2024. Peak traffic on shipping lanes can cut throughput by 30%, forcing resends that drain sensor batteries. Legacy coordination schemes designed for voice circuits cannot handle millions of bursty IoT transmissions. Operators shift some traffic into Ka-Band, but rain fade and higher terminal costs limit mass adoption. Until adaptive beamforming and dynamic channel allocation mature, service-quality uncertainty may dampen near-term uptake, shaving growth off the satellite IoT communication market.
Other drivers and restraints analyzed in the detailed report include:
- Government Rural-Connectivity Subsidies Drive Infrastructure Investment
- New ITU Spectrum Allocations Enable Expanded Capacity
- Limited Battery Life of Ground Sensors in Remote Cold Regions
For complete list of drivers and restraints, kindly check the Table Of Contents.
Segment Analysis
Low-Earth Orbit platforms captured 61.65% of the satellite IoT communication market share in 2025, leveraging sub-100 millisecond round-trip latency that supports autonomous vehicle telemetry and closed-loop industrial control. This dominance translates into large production runs, sometimes over 1,000 spacecraft, that unlock supplier volume discounts and rapid iteration cycles. However, MEO networks are expanding at a 20.05% CAGR because eight to twenty satellites can blanket the globe, cutting constellation capex by as much as 50% relative to LEO fleets.
The operational calculus differs across customer groups. Battery-powered sensors in remote mining sites often favor LEO because lower link budgets extend battery life. Maritime operators eye MEO for uninterrupted coverage on polar routes where LEO passes create brief outages. Regulatory bodies now weigh orbital-slot filings against debris-mitigation plans, a factor that could tilt future launches toward higher altitudes with longer orbital lifetimes. Both architectures, therefore, coexist, supporting varied service-level agreements inside the satellite IoT communication market.
L-Band maintained a 28.25% share of 2025 revenue, trusted for foliage-penetrating, all-weather links needed in maritime and crop-monitoring applications. Devices can operate on milliwatts, stretching battery life and bringing subscription fees within reach of price-sensitive agribusinesses. Ka-Band, despite its weather vulnerability, posts a leading 20.12% CAGR as spectrum abundance allows higher throughputs that support imagery and video-centric edge analytics.
Migration paths vary by vertical. Environmental monitoring agencies adopt Ka for streaming multispectral data, while asset-tracking fleets stick with L-Band until terminal costs fall. Spectrum coordination hurdles persist: newcomers must negotiate with incumbents that hold global filings, which could slow competitive entry but also safeguard service quality. The balance suggests a multiband future where operators mix payloads to hedge against frequency-specific constraints, enriching solution depth in the satellite IoT communication market.
Complete Report Scope:
- By Type of Orbit
- Low-Earth Orbit (LEO)
- Medium-Earth Orbit (MEO)
- Geostationary Orbit (GEO)
- By Frequency Band
- L-Band
- S-Band
- C-Band
- Ku-Band
- Ka-Band
- By End-user Industry
- Maritime and Shipping
- Agriculture and Forestry
- Logistics and Intermodal Freight
- Defense and Security
- Environmental Monitoring
- Other End-user Industries
- By Service Type
- Satellite Asset Tracking
- Remote Monitoring and Control
- Direct-to-Device Connectivity
- Backhaul Connectivity
- By Geography
- North America
- United States
- Canada
- Mexico
- South America
- Brazil
- Argentina
- Rest of South America
- Europe
- Germany
- United Kingdom
- France
- Italy
- Spain
- Russia
- Rest of Europe
- Asia Pacific
- China
- Japan
- South Korea
- India
- Australia and New Zealand
- Southeast Asia
- Rest of Asia Pacific
- Middle East
- Saudi Arabia
- United Arab Emirates
- Rest of Middle East
- Africa
- South Africa
- Nigeria
- Rest of Africa
- North America
Geography Analysis
North America commanded 35.05% of 2025 revenue, buoyed by defense surveillance budgets and the ReConnect subsidy that underwrites rural deployments. Arctic sovereignty patrols drive Canada's purchase of cold-weather-tolerant sensors, while US coastal shipping lanes adopt emissions tracking to comply with ESG scorecards. Mexico's near-shore manufacturing exports rely on satellite telemetry to maintain just-in-time inventory flows between inland plants and border crossings.
Asia Pacific registers the fastest 20.85% CAGR to 2031 as China, India, and Southeast Asian states scale digital agriculture. China's rural revitalization agenda channels public lending into cooperative-owned sensor networks, and India's domestic launch capacity lowers access costs for local integrators. Japan and South Korea showcase factory-floor automation that depends on uninterrupted IoT data feeds, while Australia's mining belts outfit haul-roads and conveyor lines with satellite gateways to monitor equipment health.
Europe delivers steady expansion underpinned by ESG regulation and the CEF-Digital fund. Germany's precision-farming subsidies reimburse satellite subscription fees, and French aquaculture firms meet traceability mandates via continuous telemetry. The U.K. advances smart-port initiatives that use satellite analytics to optimize berth allocation. Beyond these mature regions, the Middle East and Africa emerge as opportunity pools where oil operators and agritech programs tap satellite IoT to overcome terrestrial gaps, broadening geographic revenue diversity in the satellite IoT communication market.
- Iridium Communications Inc.
- ORBCOMM Inc.
- Inmarsat (Viasat, Inc.)
- Globalstar, Inc.
- Fleet Space Technologies Pty Ltd.
- Sateliot IoT Services
- Swarm Technologies, Inc. (SpaceX)
- Astrocast SA
- Myriota Pty Ltd.
- Hiber AB
- Kepler Communications Inc.
- SES S.A.
- Eutelsat Group (OneWeb)
- EchoStar Corporation
- Cobham Satcom
- L3Harris Technologies, Inc.
- Omnispace LLC
- Lacuna Space Ltd.
- China Satellite Communications Co., Ltd.(China Satcom)
- Addvalue Technologies Ltd.
Additional Benefits:
- The market estimate (ME) sheet in Excel format
- 3 months of analyst support
TABLE OF CONTENTS
1 INTRODUCTION
- 1.1 Study Assumptions and Market Definition
- 1.2 Scope of the Study
2 RESEARCH METHODOLOGY
3 EXECUTIVE SUMMARY
4 MARKET LANDSCAPE
- 4.1 Market Overview
- 4.2 Market Drivers
- 4.2.1 Development and growth of 5G-Advanced NTN specifications
- 4.2.2 Rapid drop in manufacturing and launch costs of <200 kg satellites
- 4.2.3 Government rural-connectivity subsidies (e.g., US ReConnect, EU CEF-Digital)
- 4.2.4 New ITU spectrum allocations (WRC-23) for narrowband IoT links
- 4.2.5 Maritime ESG compliance demand for continuous asset telemetry
- 4.2.6 Carbon-credit traceability for remote agriculture and forestry
- 4.3 Market Restraints
- 4.3.1 Congestion and interference in crowded L- and S-bands
- 4.3.2 Limited battery life of ground sensors in remote cold regions
- 4.3.3 Lack of global standard for Sat-to-Device antenna modules
- 4.3.4 Rising space-debris mitigation insurance premiums
- 4.4 Value Chain Analysis
- 4.5 Regulatory Landscape
- 4.6 Technological Outlook
- 4.7 Porter's Five Forces Analysis
- 4.7.1 Bargaining Power of Consumers
- 4.7.2 Bargaining Power of Suppliers
- 4.7.3 Threat of New Entrants
- 4.7.4 Threat of Substitute Products
- 4.7.5 Intensity of Competitive Rivalry
5 MARKET SIZE AND GROWTH FORECASTS (VALUE)
- 5.1 By Type of Orbit
- 5.1.1 Low-Earth Orbit (LEO)
- 5.1.2 Medium-Earth Orbit (MEO)
- 5.1.3 Geostationary Orbit (GEO)
- 5.2 By Frequency Band
- 5.2.1 L-Band
- 5.2.2 S-Band
- 5.2.3 C-Band
- 5.2.4 Ku-Band
- 5.2.5 Ka-Band
- 5.3 By End-user Industry
- 5.3.1 Maritime and Shipping
- 5.3.2 Agriculture and Forestry
- 5.3.3 Logistics and Intermodal Freight
- 5.3.4 Defense and Security
- 5.3.5 Environmental Monitoring
- 5.3.6 Other End-user Industries
- 5.4 By Service Type
- 5.4.1 Satellite Asset Tracking
- 5.4.2 Remote Monitoring and Control
- 5.4.3 Direct-to-Device Connectivity
- 5.4.4 Backhaul Connectivity
- 5.5 By Geography
- 5.5.1 North America
- 5.5.1.1 United States
- 5.5.1.2 Canada
- 5.5.1.3 Mexico
- 5.5.2 South America
- 5.5.2.1 Brazil
- 5.5.2.2 Argentina
- 5.5.2.3 Rest of South America
- 5.5.3 Europe
- 5.5.3.1 Germany
- 5.5.3.2 United Kingdom
- 5.5.3.3 France
- 5.5.3.4 Italy
- 5.5.3.5 Spain
- 5.5.3.6 Russia
- 5.5.3.7 Rest of Europe
- 5.5.4 Asia Pacific
- 5.5.4.1 China
- 5.5.4.2 Japan
- 5.5.4.3 South Korea
- 5.5.4.4 India
- 5.5.4.5 Australia and New Zealand
- 5.5.4.6 Southeast Asia
- 5.5.4.7 Rest of Asia Pacific
- 5.5.5 Middle East
- 5.5.5.1 Saudi Arabia
- 5.5.5.2 United Arab Emirates
- 5.5.5.3 Rest of Middle East
- 5.5.6 Africa
- 5.5.6.1 South Africa
- 5.5.6.2 Nigeria
- 5.5.6.3 Rest of Africa
- 5.5.1 North America
6 COMPETITIVE LANDSCAPE
- 6.1 Market Concentration
- 6.2 Strategic Moves
- 6.3 Market Share Analysis
- 6.4 Company Profiles (includes Global level Overview, Market level overview, Core Segments, Financials as available, Strategic Information, Market Rank/Share for key companies, Products and Services, and Recent Developments)
- 6.4.1 Iridium Communications Inc.
- 6.4.2 ORBCOMM Inc.
- 6.4.3 Inmarsat (Viasat, Inc.)
- 6.4.4 Globalstar, Inc.
- 6.4.5 Fleet Space Technologies Pty Ltd.
- 6.4.6 Sateliot IoT Services
- 6.4.7 Swarm Technologies, Inc. (SpaceX)
- 6.4.8 Astrocast SA
- 6.4.9 Myriota Pty Ltd.
- 6.4.10 Hiber AB
- 6.4.11 Kepler Communications Inc.
- 6.4.12 SES S.A.
- 6.4.13 Eutelsat Group (OneWeb)
- 6.4.14 EchoStar Corporation
- 6.4.15 Cobham Satcom
- 6.4.16 L3Harris Technologies, Inc.
- 6.4.17 Omnispace LLC
- 6.4.18 Lacuna Space Ltd.
- 6.4.19 China Satellite Communications Co., Ltd.(China Satcom)
- 6.4.20 Addvalue Technologies Ltd.
7 MARKET OPPORTUNITIES AND FUTURE OUTLOOK
- 7.1 White-space and Unmet-need Assessment


