
|
시장보고서
상품코드
2118034
OTT 광고 시장 : 점유율 분석, 업계 동향과 통계, 성장 예측(2026-2031년)OTT Advertising - Market Share Analysis, Industry Trends & Statistics, Growth Forecasts (2026 - 2031) |
||||||
 Mordor Intelligence
Mordor Intelligence에 의하면, OTT 광고 시장 규모는 2025년 1,216억 7,000만 달러, 2026년 1,364억 2,000만 달러에서 2031년까지 2,137억 8,000만 달러로 확대되어 2026년부터 2031년까지 CAGR 9.40%를 나타낼 것으로 예측됩니다.
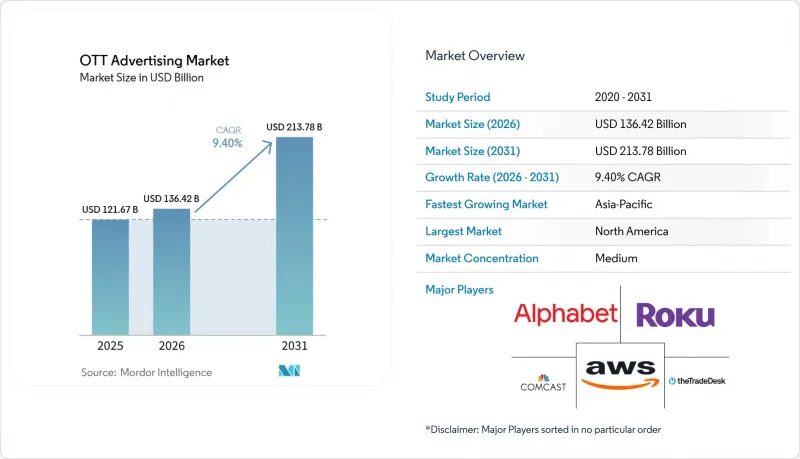
본 보고서는 광고 게재 위치(프리롤 광고, 미드롤 광고 등), 광고 형식(동영상 광고, 디스플레이 광고, 인터랙티브 광고 등), 플랫폼 유형(스마트폰·태블릿,스마트 TV 등), 최종 사용자(미디어 및 엔터테인먼트, 소매 및 전자상거래, 자동차, 헬스케어 및 제약, 금융 서비스 등), 지역별로 분류되어 있습니다. 시장 예측은 금액(미 달러) 기준으로 제시되어 있습니다.
세계 OTT 광고 시장 동향 및 인사이트
선형 TV에서 스트리밍으로의 광고 예산 전환 가속화
선형 TV에서 스트리밍으로의 예산 전환에 따라, OTT 광고 시장 전체에서 동영상 광고 계획의 우선순위가 재검토되고 있습니다. Premion과 Advertiser Perceptions의 조사에 따르면, CTV 및 OTT 광고주의 70%가 2026년에 스트리밍에 대한 지출을 평균 17% 늘릴 계획인 것으로 나타났으며, 이는 이러한 전환이 주요 광고주들에게 더 이상 실험적인 단계가 아님을 보여줍니다. 동 조사에 따르면, 예산 증가분의 28%는 지상파 TV에서 24%는 케이블 TV 및 위성 방송 예산에서 전용될 전망이며, 이는 스트리밍이 단순히 신규 자금을 유치할 뿐만 아니라 기존 TV 광고 예산에서 자금을 빼앗고 있음을 뒷받침합니다. 현재 하이브리드형 기획 팀이 CTV 예산의 55%를 관리하고 있으며, 대행사 및 브랜드 팀 내에서는 기존 선형 방송과 디지털 광고 구매를 분담하던 업무 구분이 점차 축소되고 있습니다. 이러한 변화로 인해 업프론트 계획부터 프로그래매틱 실행에 이르는 프로세스가 단축되었으며, 이미 프리미엄 스트리밍 공급을 장악하고 있는 플랫폼의 우위가 더욱 강화되고 있습니다. 실무적으로는 OTT 광고 시장이 스트리밍을 핵심 동영상 채널로 취급하고, 리니어 TV는 감소 추세에 있는 보완적 매체로 관리되는 경향이 강해지는 기획 모델로 전환되고 있습니다.
광고 포함 스트리밍 플랜과 FAST 인벤토리의 확대
광고 포함 플랜과 FAST 서비스 덕분에 OTT 광고 시장 전체에서 이용 가능한 판매 가능한 인벤토리의 양이 확대되고 있습니다. Xumo는 2026년 1월, The Trade Desk의 OpenPath 프레임워크를 통해 자사의 프리미엄 스트리밍 인벤토리에 대한 직접 접근을 확대했습니다. 이는 광고가 포함된 스트리밍 플랫폼이 직접적인 프로그래매틱 경로를 통해 더 많은 공급을 개방하고 있음을 보여줍니다. Roku는 2026년 4월, 자사의 오디언스 인사이트와 파트너사의 구매 데이터를 연동하는 ‘Roku Curate’를 도입했습니다. 이는 광고 지원 환경이 더 이상 단순한 노출 수에 그치지 않고, 측정 가능한 성과를 중심으로 구축되고 있음을 시사합니다. 디즈니 애드버타이징(Disney Advertising)은 2025년 6월, 소매업체의 데이터 세트를 스트리밍 노출과 연동함으로써 구매 가능하고 실행 가능한 광고 기능을 확장하여, 광고 지원형 시청을 커머스 주도형 캠페인에 더욱 유용하게 만들었습니다. 또한 각 플랫폼은 단순히 광고 부하를 늘리는 데 그치지 않고, 광고 경험 개선에도 주력하고 있습니다. 시청자의 참여도가 안정되어야만 인벤토리 확대가 성장으로 이어지기 때문입니다. 이를 통해 구매자는 광고 지원형 스트리밍 환경에서 프리미엄 TV에 가까운 캠페인 품질과 어트리뷰션 기준을 유지하면서 더 많은 시청자에게 도달할 수 있는 여지가 생겼습니다.
기기 및 퍼블리셔를 가로지르는 측정 단편화
측정 단편화는 OTT 광고 시장의 급속한 확장에 있어 여전히 가장 두드러진 장벽 중 하나입니다. 광고주는 각각 서로 다른 식별 체계와 보고 시스템을 가진 플랫폼 간에 성과를 비교하는 데 여전히 어려움을 겪고 있기 때문입니다. CIMM과 4As는 2026년 3월, 광고주가 이전보다 더 많은 데이터와 분석 도구에 접근할 수 있게 되었다고 보고했으나, 팀이 경쟁하는 캠페인 실적 데이터를 대조해야 하기 때문에 측정 정확성에 대한 신뢰도는 여전히 낮은 상태입니다. 이 문제는 기술적인 측면에만 국한되지 않습니다. 주요 스트리밍 플랫폼들은 시청자 데이터나 성과 데이터를 자체 환경 내에 보관해야 할 상업적인 이유도 있기 때문입니다. 그 결과, 빈도 제어, 중복 제거 후 도달 범위, 크로스 플랫폼 어트리뷰션에 대해 재무 부서나 조달 부서에 그 타당성을 설명하기가 어려워지고 있습니다. EEA 및 영국에서 구글의 맞춤형 광고에 관한 동의 규정은 시장마다 더 큰 불일치를 초래하고 있습니다. 이는 현지 동의 신호에 따라 ID의 품질이 달라질 수 있기 때문입니다. 보고 기준의 비교 가능성이 높아질 때까지는 OTT 광고 시장에서 계속해서 마찰이 발생하고, 측정 방식이 더 잘 이해되는 채널로의 예산 재분배가 둔화되는 상황이 지속될 것입니다.
부문 분석
2025년, 미드롤 광고는 OTT 광고 시장 점유율의 43.12%를 차지하며 프리미엄 스트리밍 수익 창출에서 중심적인 위치를 계속 유지했습니다. 이러한 우위는 게재 컨텍스트에서 비롯된 것으로, 시청이 활발한 순간에 표시되는 광고는 일반적으로 컨텐츠 전후의 광고 슬롯보다 더 큰 주목을 끌며, 더 높은 가격 책정력을 발휘하기 때문입니다. 또한, 광고주들은 여전히 미드롤 광고를 기존 TV 광고 슬롯에 가장 가까운 대안으로 간주하고 있으며, 이는 리니어 방송 예산이 스트리밍으로 전환되는 데 유익한 요소가 되고 있습니다. 프리롤 광고는 가장 빠르게 성장하는 광고 슬롯으로, 2026년부터 2031년까지 연평균 성장률(CAGR) 9.92%로 확대될 것으로 예측됩니다. 포스트롤 광고는 컨텐츠가 끝난 후에도 시청자가 서비스를 계속 이용하는 것에 의존하기 때문에 많은 캠페인에서 규모가 제한적이며 여전히 광고 구성에서 가장 작은 비중을 차지하고 있습니다.
OTT 광고 시장의 광고 슬롯 구성도 변화하고 있습니다. 이는 퍼블리셔가 시청 완료율을 유지하고 시청자의 불만을 줄이기 위해 광고 슬롯 구성을 보다 신중하게 관리하고 있기 때문입니다. 프리롤 광고는 재생 시 마찰이 적고 광고 전달 워크플로가 개선된 점의 혜택을 받고 있으며, 이로 인해 일관된 시작 타이밍이 필요한 성과 중심 캠페인에서 이 형식에 대한 수용도가 높아지고 있습니다. 미드롤은 여전히 가장 수익성이 높은 위치를 유지하고 있습니다. 이는 가장 가치가 높은 시청 시간대에 위치해 있으며, 과도한 광고 슬롯을 필요로 하지 않으면서도 프리미엄 가격 책정이 가능하기 때문입니다. 포스트롤은 시청 경험에 미치는 영향을 최소화해야 하는 캠페인이나 직접 리스폰스 활동에는 유용하지만, 미드스트림 인벤토리의 규모나 가격에는 미치지 못하는 상황입니다. 유럽에서는 개인화된 광고 게재에 관한 동의 규정이 배치 수준 타겟팅에도 영향을 미치고 있어, 이로 인해 프리롤 및 미드롤 노출에서 타겟 대상이 축소될 가능성이 있습니다.
2025년에는 동영상 광고가 광고 포맷 구성의 66.54%를 차지했습니다. 이는 스트리밍 환경이 여전히 정적인 디스플레이 광고 경험이 아니라, 장편 및 단편 동영상 시청을 중심으로 구축되어 있음을 반영합니다. 이 형식이 지배적인 위치를 유지하는 이유는 대부분의 브랜드 광고주가 이미 TV 방송용 크리에이티브 자산을 보유하고 있어, 리니어 채널에서 스트리밍으로 예산을 전환할 때의 운영 부담이 줄어들기 때문입니다. 인터랙티브 광고는 2026년부터 2031년까지 연평균 성장률(CAGR) 10.54%로 확대될 것으로 예측되며, 이는 OTT 광고 시장이 수동적인 노출에서 측정 가능한 참여로 전환되고 있음을 보여줍니다. 오버레이, 컴패니언 유닛, 일시 정지 기반 배치와 같은 디스플레이 형식은 시청 세션을 반드시 중단시키지 않으면서도 노출을 증가시키기 때문에 여전히 중요한 역할을 하고 있습니다. 현재의 전반적인 구성을 살펴보면, 광고주들은 ‘도달’과 ‘행동’을 별개의 미디어 플랜으로 취급하기보다는 두 가지를 동시에 추구하는 시장으로 나아가고 있습니다.
이러한 변화는 프리미엄 스트리밍 환경에 커머스 기능이 도입됨에 따라 더욱 뚜렷해지고 있습니다. 디즈니 애드버타이징은 2025년 6월, 크로거 프리시전 마케팅(Kroger Precision Marketing) 및 월마트 커넥트(Walmart Connect)의 소매업체 데이터 세트를 CTV 광고 노출과 연동함으로써, 쇼핑 기능 및 행동 유도 기능을 갖춘 광고의 역량을 확대했습니다. 이를 통해 광고주는 동영상 노출과 상품 발견, 구매 의도를 보다 직접적으로 연결할 수 있게 되어, 인터랙티브 광고 유닛은 캠페인 계획에서 더욱 중요한 역할을 담당하게 될 것입니다. 시청 세션 내에서 가벼운 행동 유도(CTA)를 지원하는 경우, 디스플레이 광고 형식도 이러한 추세의 혜택을 받고 있습니다. 그럼에도 불구하고, 동영상은 여전히 OTT 광고 업계의 중추를 이루고 있습니다. 이는 동영상이 시청자의 기대에 부응하고, 프리미엄 컨텐츠 환경에 적합하며, 구매자와 퍼블리셔 사이에서 여전히 가장 널리 받아들여지고 있기 때문입니다.
지역별 분석
2025년, 북미는 OTT 광고 시장 점유율의 41.09%를 차지하며 최대의 지역별 수익 기반이 되었습니다. 이 지역은 프리미엄 광고 슬롯, 프로그래매틱 광고 인프라 및 인증된 오디언스 데이터가 이미 대규모로 확립되어 있어 스트리밍 광고에 있어 가장 성숙한 환경으로 남아 있습니다. IAB 보고서에 따르면, 미국의 CTV 광고비는 2025년에 265억 달러에 달하고 2026년에는 293억 달러에 이를 것으로 추정되며, 이는 해당 지역 최대의 국내 시장에서 성장세가 지속되고 있음을 보여줍니다. 북미는 또한 아마존, 로쿠, 넷플릭스, 디즈니와 같은 주요 플랫폼 사업자가 집중되어 있다는 점도 강점으로 작용하고 있으며, 이를 통해 고품질 광고 슬롯 및 퍼스트파티 데이터에 대한 접근성이 강화되고 있습니다. 한편, 세계 프라이버시 컨트롤(GPC)에 대한 인식 확대와 보다 광범위한 데이터 거버넌스 기준과 같은 프라이버시 대책으로 인해, 오디언스 활성화는 규정 준수를 준수하는 ID 인프라에 대한 의존도를 높이고 있습니다.
아시아태평양은 가장 빠르게 성장하는 지역으로, 2026년부터 2031년까지 연평균 성장률(CAGR) 10.37%로 확대될 것으로 예측됩니다. 이 지역은 매우 대규모의 스트리밍 시청자층을 보유하고 있는 반면, 수익화 현황에 편차가 있어 시청자 수 증가가 반드시 북미 수준의 가격 책정으로 이어지는 것은 아닙니다. 모바일 우선 시청 습관은 아시아태평양의 일부 시장에서 여전히 주요 특징이며, 광고주는 캠페인 형식, 광고 길이와 측정 관련 기대치를 더 작은 화면과 낮은 CPM에 맞추어 조정해야만 합니다. 인도와 동남아시아는 광고 지원형 동영상 소비가 확대되고 있으며, 구독 중심 모델만 있는 경우보다 더 폭넓은 잠재 시청자층을 확보하고 있어 계속해서 중요한 시장으로 남아 있습니다. 일본과 한국은 프리미엄 컨텐츠, 첨단 기기의 보급, 그리고 광고주의 높은 이해도로 인해 이 지역의 다른 많은 시장보다 강력한 수익 창출이 뒷받침되고 있어 여전히 중요한 시장입니다.
유럽은 OTT(Over-The-Top) 광고 시장에 있어 여전히 중요한 수익원이지만, 동의 기준의 엄격화와 행동 타겟팅의 유연성 저하로 인해 성장이 둔화되고 있습니다. Google은 EEA 및 영국 내 개인 맞춤형 광고 인벤토리에 대해 GDPR(EU 개인정보보호규정)을 준수하는 동의 처리를 의무화하고 있으며, 이를 통해 컨텍스트 기반 접근 방식, 자사 데이터 활용, 그리고 투명성이 더 높은 오디언스 연계 프레임워크로의 전환이 촉진되고 있습니다. 남미에서는 주요 시장 전반에 걸쳐 커넥티드 TV의 보급, 광고 지원형 스트리밍, 그리고 디지털 동영상 시청 습관의 정착이 계속 진행되고 있어 더욱 강력한 성장세를 보이고 있습니다. 중동 및 아프리카는 여전히 발전 초기 단계에 있는 지역이지만, 사우디아라비아, UAE, 남아프리카공화국은 인프라 수준, 스마트폰 보급률 및 광고주의 성숙도가 인근 시장 대부분보다 높아 두드러진 존재감을 보이고 있습니다.
기타 혜택:
- 엑셀 형식 시장 예측(ME) 시트
- 3개월간의 애널리스트 지원
자주 묻는 질문
목차
제1장 서론
제2장 조사 방법
제3장 개요
제4장 시장 구도
제5장 시장 규모와 성장 예측
제6장 경쟁 구도
제7장 시장 기회와 향후 전망
JHS 26.09.01According to Mordor Intelligence, the OTT advertising market size is projected to expand from USD 121.67 billion in 2025 and USD 136.42 billion in 2026 to USD 213.78 billion by 2031, registering a CAGR of 9.40% between 2026 and 2031.
This report is Segmented by Ad Placement (Pre-Roll Ads, Mid-Roll Ads, and More), Ad Format (Video Ads, Display Ads, Interactive Ads, and More), Platform Type (Smartphones and Tablets, Smart TVs, and More), End User (Media and Entertainment, Retail and E-Commerce, Automotive, Healthcare and Pharmaceuticals, Financial Services, and More), Geography. The Market Forecasts are Provided in Terms of Value (USD).
Global OTT Advertising Market Trends and Insights
Rising Shift from Linear TV to Streaming Ad Budgets
Budget migration from linear television to streaming has reset video planning priorities across the OTT advertising market. Premion and Advertiser Perceptions found that 70% of CTV and OTT advertisers planned to increase streaming spend by an average of 17% in 2026, indicating the shift is no longer experimental for major buyers. The same survey showed that 28% of the planned increase was expected to come from broadcast linear TV and 24% from cable or satellite budgets, confirming that streaming is taking spend from legacy television pools rather than attracting only new money. Hybrid planning teams now control 55% of CTV budgets, so the old operational split between linear and digital buying is narrowing inside agencies and brand teams. That shift is shortening the path from upfront planning to programmatic execution, giving platforms that already control premium streaming supply greater leverage. In practical terms, the OTT advertising market is moving toward a planning model in which streaming is treated as the central video channel, while linear television is increasingly managed as a declining complement.
Expansion of Ad-Supported Streaming Tiers and FAST Inventory
Ad-supported tiers and FAST services are widening the amount of sellable inventory available across the OTT advertising market. Xumo expanded direct access to its premium streaming inventory through The Trade Desk's OpenPath framework in January 2026, which shows how ad-supported streaming platforms are opening more supply through direct programmatic routes. Roku introduced Roku Curate in April 2026 to connect its first-party audience insights with partner purchase data, signaling that ad-supported environments are now built around measurable outcomes rather than simple impression scale. Disney Advertising extended shoppable and actionable ad capabilities in June 2025, linking retailer datasets to streaming exposures and making ad-supported viewing more useful for commerce-led campaigns. Platforms are also refining ad experiences rather than just raising ad loads, because inventory expansion only supports growth if viewer engagement remains stable. This creates space for buyers to reach more viewers in ad-supported streaming environments while still maintaining campaign quality and attribution standards closer to those of premium television.
Fragmented Measurement Across Devices and Publishers
Measurement fragmentation remains one of the clearest barriers to faster expansion in the OTT advertising market, as advertisers still struggle to compare performance across platforms with distinct identities and reporting systems. CIMM and the 4As reported in March 2026 that advertisers have access to more data and analytics tools than before, yet confidence in measurement accuracy still lags because teams must reconcile competing versions of campaign truth. The problem is not only technical, because major streaming platforms also have commercial reasons to keep audience and performance data inside proprietary environments. That makes frequency control, deduplicated reach, and cross-platform attribution harder to defend to finance and procurement teams. Google's consent rules for personalized advertising in the EEA and UK add another layer of variation across markets, since identity quality can change based on local permission signals. Until reporting standards become more comparable, the OTT advertising market will continue to carry friction that slows budget reallocation from channels where measurement practices are better understood.
Other drivers and restraints analyzed in the detailed report include:
- Programmatic Buying and Real-Time Bidding Adoption
- Better First-Party Audience Targeting and Measurement
- Limited Inventory Transparency in Premium OTT Environments
For complete list of drivers and restraints, kindly check the Table Of Contents.
Segment Analysis
Mid-roll ads held 43.12% of the OTT advertising market share in 2025, which kept them at the center of premium streaming monetization. Their lead came from placement context, because ads shown during active viewing moments usually attract stronger attention and command better pricing power than inventory placed before or after the content. Buyers also continue to view mid-roll as a closer substitute for traditional television commercial breaks, which is helpful as linear budgets are redirected into streaming. Pre-roll ads are the fastest-growing placement type and are projected to expand at a 9.92% CAGR from 2026 to 2031. Post-roll ads remain the smallest part of the mix because they depend on viewers staying with the service after content ends, which narrows scale for many campaigns.
The placement mix in the OTT advertising market is also changing because publishers are managing ad break structures more carefully to protect completion rates and reduce viewer irritation. Pre-roll is benefiting from lower playback friction and better ad delivery workflows, which makes the format more acceptable for performance-led campaigns that need consistent starts. Mid-roll still holds the strongest revenue position because it sits inside the highest-value viewing window and supports premium pricing without requiring oversized ad pods. Post-roll remains useful for lower-disruption campaigns and direct-response activity, but it does not match the scale or pricing of mid-stream inventory. In Europe, placement-level targeting is also shaped by consent rules for personalized ad delivery, which can narrow the addressable scale for both pre-roll and mid-roll impressions.
Video ads accounted for 66.54% of the ad format mix in 2025, reflecting that streaming environments are still built around long- and short-form video viewing rather than static display experiences. The format remains dominant because most brand advertisers already have television-ready creative assets, which lowers the operational friction of moving budgets from linear channels to streaming. Interactive ads are projected to expand at a 10.54% CAGR from 2026 to 2031, indicating that the OTT advertising market is moving beyond passive exposure toward measurable engagement. Display formats, including overlays, companion units, and pause-based placements, remain relevant because they add incremental impressions without always interrupting the viewing session. The overall mix now points to a market where advertisers want both reach and action, rather than treating those goals as separate media plans.
That shift is becoming clearer as commerce functionality moves into premium streaming environments. Disney Advertising expanded its shoppable and actionable ad capabilities in June 2025 by connecting retailer datasets from Kroger Precision Marketing and Walmart Connect to CTV ad exposures. This gives interactive units a stronger role in campaign planning, because advertisers can connect video exposure with product discovery and transaction intent more directly. Display formats benefit from the same trend when they support lightweight calls to action inside the viewing session. Even so, video remains the anchor of the OTT advertising industry because it aligns with viewer expectations, fits premium content environments, and still enjoys the broadest acceptance among buyers and publishers.
Complete Report Scope:
- By Ad Placement
- Pre-roll ads
- Mid-roll ads
- Post-roll ads
- By Ad Format
- Video Ads
- Display Ads
- Interactive Ads
- Other Ad Formats
- By Platform Type
- Smartphones and Tablets
- Smart TVs
- Laptops and Desktops
- Other Device Types
- By End User
- Media and Entertainment
- Retail and E-Commerce
- Automotive
- Healthcare and Pharmaceuticals
- Financial Services
- Travel and Hospitality
- Other End Users
- By Geography
- North America
- United States
- Canada
- Mexico
- South America
- Brazil
- Argentina
- Chile
- Rest of South America
- Europe
- Germany
- United Kingdom
- France
- Italy
- Spain
- Rest of Europe
- Asia-Pacific
- China
- Japan
- India
- South Korea
- Australia
- Rest of Asia-Pacific
- Middle East
- Saudi Arabia
- United Arab Emirates
- Qatar
- Rest of Middle East
- Africa
- South Africa
- Egypt
- Nigeria
- Rest of Africa
- North America
Geography Analysis
North America held 41.09% of the OTT advertising market share in 2025, making it the largest regional revenue base. The region remains the most mature environment for streaming advertising, with premium inventory, programmatic infrastructure, and authenticated audience data already established at scale. IAB reported that US CTV ad spend reached USD 26.5 billion in 2025 and is estimated at USD 29.3 billion in 2026, indicating continued momentum in the region's largest national market. North America also benefits from the concentration of major platform operators, including Amazon, Roku, Netflix, and Disney, which strengthens access to high-quality supply and first-party data. At the same time, privacy controls such as Global Privacy Control recognition and broader data governance standards are making audience activation more dependent on compliant identity infrastructure.
Asia-Pacific is the fastest-growing geography, projected to expand at a 10.37% CAGR from 2026 to 2031. The region combines very large streaming audiences with uneven monetization, so volume growth does not always translate into North America-level pricing. Mobile-first viewing habits remain a major feature across several Asia-Pacific markets, pushing advertisers to adapt campaign formats, pod lengths, and measurement expectations to smaller screens and lower CPMs. India and Southeast Asia continue to matter because ad-supported video consumption is expanding at scale and supports a broader base of reachable viewers than subscription-led models alone. Japan and South Korea remain important because premium content, advanced device adoption, and advertiser sophistication support stronger monetization than many other markets in the region.
Europe remains a meaningful revenue block for the over-the-top (OTT) advertising market, but growth is moderated by stricter consent standards and more limited flexibility around behavioral targeting. Google requires GDPR-compliant consent handling for personalized inventory in the EEA and UK, which reinforces the shift toward contextual approaches, first-party activation, and cleaner audience collaboration frameworks. South America is showing stronger momentum as connected television adoption, ad-supported streaming, and broader digital video habits continue to deepen across major markets. The Middle East and Africa remain earlier-stage regions, with Saudi Arabia, the UAE, and South Africa standing out because infrastructure quality, smartphone usage, and advertiser sophistication are higher than in many neighboring markets.
- Alphabet Inc.
- Amazon.com, Inc.
- The Trade Desk, Inc.
- Roku, Inc.
- Comcast Corporation
- Magnite, Inc.
- PubMatic, Inc.
- The Walt Disney Company
- Paramount Global
- Samsung Ads
- LG Ad Solutions
- Xandr, Inc.
- Viant Technology Inc.
- Index Exchange, Inc.
- OpenX Technologies, Inc.
- LiveRamp Holdings, Inc.
- Criteo S.A.
- Innovid Corp.
- AdTheorent Holding Company, Inc.
- Yahoo Inc.
Additional Benefits:
- The market estimate (ME) sheet in Excel format
- 3 months of analyst support
TABLE OF CONTENTS
1 INTRODUCTION
- 1.1 Study Assumptions and Market Definition
- 1.2 Scope of the Study
2 RESEARCH METHODOLOGY
3 EXECUTIVE SUMMARY
4 MARKET LANDSCAPE
- 4.1 Market Overview
- 4.2 Market Drivers
- 4.2.1 Rising Shift From Linear TV to Streaming Ad Budgets
- 4.2.2 Expansion of Ad-Supported Streaming Tiers and FAST Inventory
- 4.2.3 Programmatic Buying and Real-Time Bidding Adoption
- 4.2.4 Better First-Party Audience Targeting and Measurement
- 4.2.5 Retail Media and Commerce Data Collaboration in OTT Campaigns
- 4.2.6 Cross-Screen Frequency Management Across OTT, CTV, and Mobile
- 4.3 Market Restraints
- 4.3.1 Fragmented Measurement Across Devices and Publishers
- 4.3.2 Limited Inventory Transparency in Premium OTT Environments
- 4.3.3 Privacy and Consent Constraints on Audience Targeting
- 4.3.4 Ad Load Sensitivity and Viewer Churn Risk
- 4.4 Industry Value Chain Analysis
- 4.5 Industry Supply Chain Analysis
- 4.6 Regulatory Landscape
- 4.7 Technological Outlook
- 4.8 Impact of Macroeconomic Factors on the Market
- 4.9 Porter's Five Forces Analysis
- 4.9.1 Bargaining Power of Suppliers
- 4.9.2 Bargaining Power of Buyers
- 4.9.3 Threat of New Entrants
- 4.9.4 Threat of Substitutes
- 4.9.5 Intensity of Competitive Rivalry
5 MARKET SIZE AND GROWTH FORECASTS (VALUE)
- 5.1 By Ad Placement
- 5.1.1 Pre-roll ads
- 5.1.2 Mid-roll ads
- 5.1.3 Post-roll ads
- 5.2 By Ad Format
- 5.2.1 Video Ads
- 5.2.2 Display Ads
- 5.2.3 Interactive Ads
- 5.2.4 Other Ad Formats
- 5.3 By Platform Type
- 5.3.1 Smartphones and Tablets
- 5.3.2 Smart TVs
- 5.3.3 Laptops and Desktops
- 5.3.4 Other Device Types
- 5.4 By End User
- 5.4.1 Media and Entertainment
- 5.4.2 Retail and E-Commerce
- 5.4.3 Automotive
- 5.4.4 Healthcare and Pharmaceuticals
- 5.4.5 Financial Services
- 5.4.6 Travel and Hospitality
- 5.4.7 Other End Users
- 5.5 By Geography
- 5.5.1 North America
- 5.5.1.1 United States
- 5.5.1.2 Canada
- 5.5.1.3 Mexico
- 5.5.2 South America
- 5.5.2.1 Brazil
- 5.5.2.2 Argentina
- 5.5.2.3 Chile
- 5.5.2.4 Rest of South America
- 5.5.3 Europe
- 5.5.3.1 Germany
- 5.5.3.2 United Kingdom
- 5.5.3.3 France
- 5.5.3.4 Italy
- 5.5.3.5 Spain
- 5.5.3.6 Rest of Europe
- 5.5.4 Asia-Pacific
- 5.5.4.1 China
- 5.5.4.2 Japan
- 5.5.4.3 India
- 5.5.4.4 South Korea
- 5.5.4.5 Australia
- 5.5.4.6 Rest of Asia-Pacific
- 5.5.5 Middle East
- 5.5.5.1 Saudi Arabia
- 5.5.5.2 United Arab Emirates
- 5.5.5.3 Qatar
- 5.5.5.4 Rest of Middle East
- 5.5.6 Africa
- 5.5.6.1 South Africa
- 5.5.6.2 Egypt
- 5.5.6.3 Nigeria
- 5.5.6.4 Rest of Africa
- 5.5.1 North America
6 COMPETITIVE LANDSCAPE
- 6.1 Market Concentration
- 6.2 Strategic Moves
- 6.3 Vendor Positioning Analysis
- 6.4 Company Profiles (includes Global Level Overview, Market Level Overview, Core Segments, Financials as available, Strategic Information, Products and Services, Recent Developments)
- 6.4.1 Alphabet Inc.
- 6.4.2 Amazon.com, Inc.
- 6.4.3 The Trade Desk, Inc.
- 6.4.4 Roku, Inc.
- 6.4.5 Comcast Corporation
- 6.4.6 Magnite, Inc.
- 6.4.7 PubMatic, Inc.
- 6.4.8 The Walt Disney Company
- 6.4.9 Paramount Global
- 6.4.10 Samsung Ads
- 6.4.11 LG Ad Solutions
- 6.4.12 Xandr, Inc.
- 6.4.13 Viant Technology Inc.
- 6.4.14 Index Exchange, Inc.
- 6.4.15 OpenX Technologies, Inc.
- 6.4.16 LiveRamp Holdings, Inc.
- 6.4.17 Criteo S.A.
- 6.4.18 Innovid Corp.
- 6.4.19 AdTheorent Holding Company, Inc.
- 6.4.20 Yahoo Inc.
7 MARKET OPPORTUNITIES AND FUTURE OUTLOOK
- 7.1 White-Space and Unmet-Need Assessment