

|
시장보고서
상품코드
2118941
소매 개인화 서비스 시장 : 시장 점유율 분석, 업계 동향 및 통계, 성장 예측(2026-2031년)Retail Personalization Services - Market Share Analysis, Industry Trends & Statistics, Growth Forecasts (2026 - 2031) |
||||||
 Mordor Intelligence
소매 개인화 서비스 시장 규모는 2025년 55억 2,000만 달러로 평가되었고, 2026년 63억 2,000만 달러에서 2031년까지 138억 5,000만 달러로 확대될 것으로 예측되며, 2026-2031년 연평균 복합 성장률(CAGR)은 16.99%를 나타낼 전망입니다.
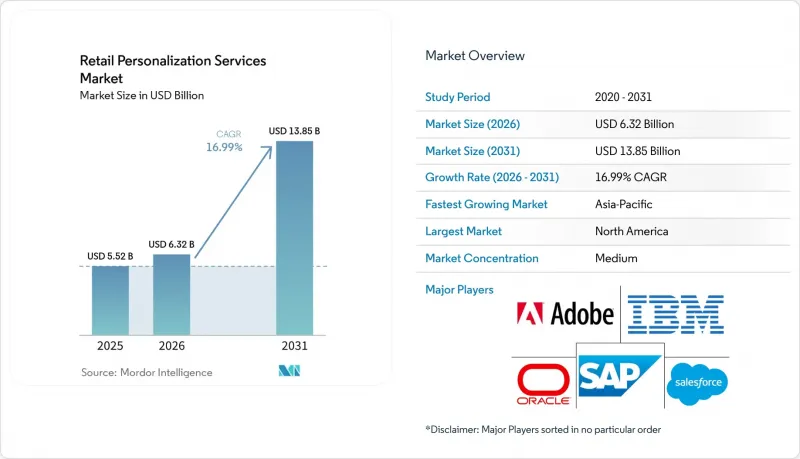
본 보고서는 용도별(상품 추천, 맞춤형 검색 및 머천다이징, 로열티 및 오퍼 맞춤화 등), 기업 규모별(대기업, 중소기업), 최종 사용자 산업별(패션 및 의류, 미용·퍼스널케어, 식료품·FMCG 등) 및 지역별로 분류되어 있습니다. 시장 예측은 금액(달러) 기준으로 제시되어 있습니다.
세계의 소매 개인화 서비스 시장 동향 및 인사이트
개별화된 옴니채널 쇼핑 경험에 대한 수요 증가
소매업체들은 매장, 웹사이트, 용도, 메시징 채널을 아우르는 원활한 경험을 점점 더 필요로 하고 있습니다. 이러한 접점에서 발생하는 행동 신호가 실용적인 고객 프로파일과 연계됨에 따라 소매업 맞춤형 서비스 시장은 혜택을 받게 됩니다. 이러한 프로파일을 통해 소매업체는 광범위한 캠페인 규칙에 의존하지 않고, 쇼핑객의 최근 활동에 따라 대응할 수 있게 됩니다. 또한, 연동된 프로파일 덕분에 쇼핑객이 디지털 채널과 오프라인 매장 채널 사이를 이동할 때도 일관된 서비스를 유지하기가 더 쉬워집니다. 소매업체가 더 풍부한 자사 데이터를 수집함에 따라, 해당 데이터의 품질은 개인화 엔진 자체보다 더 중요해지고 있습니다. 이에 따라, 동의를 얻은 데이터를 고객 대응 팀이 활용할 수 있도록 하는 시스템에 대한 수요가 증가하고 있습니다.
AI 주도 상품 발견 및 검색의 활용 확대
AI 주도형 상품 발견은 소매 검색을 단순한 키워드 매칭에서 구매 의도, 재고, 상품 속성 및 쇼핑객의 행동을 고려할 수 있는 프로세스로 변화시키고 있습니다. 사이트 내 검색은 구매 과정에서 구매 의향이 높은 지점인 경우가 많기 때문에 이는 소매 개인화 서비스 시장을 견인하고 있습니다. Algolia는 2026년 7월, 수동 설정 없이 검색 컨텍스트와 사용자 행동에 맞추어 상품 필터를 적용하는 ‘Dynamic Facets’를 출시했습니다. Coveo는 2026년 3월 ‘Conversational Product Discovery’를 도입하여 자연어 기반 상품 대화를 전자상거래 검색에 직접 통합했습니다. 신뢰할 수 있는 상품 정보와 최신 재고 피드를 보유한 소매업체는 불완전한 카탈로그 기록만 가진 업체보다 더 관련성 높은 검색 결과를 제공할 수 있습니다. 따라서 상품 데이터 거버넌스는 개인화 서비스의 비즈니스적 이점 중 하나가 됩니다.
데이터 개인정보 보호, 동의 및 국경을 초월한 데이터 규정 준수의 복잡성
데이터 개인정보 보호 및 알고리즘의 설명 책임에 관한 요건으로 인해, 여러 관할 구역에 걸쳐 개인화 프로그램을 전개하는 것이 어려워질 수 있습니다. 소매 개인화 서비스 시장은 소매업체가 동일한 프로그램에 대해 서로 다른 동의, 삭제, 공개, 감사 관행을 적용해야 하는 경우, 더욱 복잡해집니다. 2026년에 시행될 ‘캘리포니아 소비자 개인정보 보호법(CCPA)’은 캘리포니아주 내 소비자의 개인정보 보호 권리와 기업의 의무를 규정하고 있습니다. 유럽, 캘리포니아 및 걸프협력회의(GCC) 시장에 서비스를 제공하는 소매업체는 투명성 및 데이터 처리와 관련하여 개별적인 접근 방식이 필요할 수 있습니다. 이러한 부담은 대규모 법무팀이나 기술 규정 준수 팀을 보유하지 않은 소규모 브랜드에게 더욱 크게 다가옵니다. 플랫폼에 동의 관리 기능 및 감사 기능을 내장한 제공업체를 활용하면, 소매업체가 별도의 도구를 추가해야 할 필요성을 줄일 수 있습니다.
부문 분석
2025년, 상품 추천은 소매 개인화 서비스 시장 점유율의 25.27%를 차지하며 가장 큰 용도 부문이 되었습니다. 소매업체가 이 용도를 중시하는 이유는 추천 게시를 통한 매출을 대조군과 비교할 수 있다는 점에 있습니다. 개인화된 검색 및 머천다이징도 중요한 역할을 하고 있습니다. 이는 검색 행동이 즉각적인 구매 의향을 나타내는 경우가 많기 때문입니다. 로열티 및 오퍼의 개인화는 광범위한 할인 캠페인에서 벗어나는 데 도움을 주며, 고객 세분화 및 분석은 다른 용도에 필요한 고객층에 대한 이해를 제공합니다. 이러한 확립된 용도들이 소매 개인화 서비스 시장에 폭넓은 수요 기반을 마련해 주고 있습니다.
‘고객 여정 오케스트레이션’은 2026년부터 2031년까지 연평균 성장률(CAGR) 19.22%를 나타낼 것으로 예측되며, 이는 모든 용도 중 가장 높은 성장률입니다. 소매업체들은 실시간 행동을 기반으로 고객 데이터 플랫폼과 채널 도구를 연동하는 시스템을 원하고 있습니다. Bloomreach는 2026년 6월, 마케팅 에이전트 ‘Loomi’의 일반 제공을 시작했습니다. 이 제품은 마케팅 담당자의 지시를 세분화, 컨텐츠, 행동 기반 자동화 기능을 갖춘 워크플로로 변환하도록 설계되었습니다. ‘컨텐츠 개인화’는 여전히 정의된 용도 부문 중규모가 가장 작은 분야이지만, 생성형 AI를 활용함으로써 개별 컨텐츠 변형을 생성하는 데 필요한 시간을 단축할 수 있습니다. 용도의 구성은 개별 도구에서 연계된 고객 상호작용으로 전환되고 있습니다.
지역별 분석
2025년, 북미는 전 세계 소매 개인화 서비스 시장의 36.39%를 차지했습니다. 미국은 전자상거래 보급률이 높고, 대형 소매 기업이 집중되어 있으며, 고객 데이터 플랫폼을 조기에 도입한 덕분에 이러한 위치를 유지하고 있습니다. 캐나다와 멕시코는 미국에 비해 아직 발전 중인 시장이지만, 벤더 생태계와 해당 지역에서 사업을 전개하는 소매 그룹의 혜택을 받고 있습니다. 유럽은 2위 지역으로, 독일, 영국, 프랑스가 주도적인 역할을 하고 있습니다. 유럽 내 AI 주도형 개인화 서비스에 대한 수요는 크지만, 데이터 거주 요건 및 개인정보 보호 요건으로 인해 데이터 활용이 지연될 가능성이 있습니다.
아시아태평양은 2031년까지 연평균 성장률(CAGR) 20.23%를 나타낼 것으로 예측되며, 이는 소매 개인화 서비스 시장에서 가장 높은 지역 성장률입니다. 중국, 인도, 한국, 일본이 새로운 수요의 대부분을 창출할 것으로 전망됩니다. 이세탄 미츠코시는 전자상거래 사업에 개인화 AI 시스템을 도입한 후, 클릭률이 1.4배 개선되고, 장바구니 추가 건수가 1.4배 증가하며, 전환율이 1.3배 상승했다고 보고했습니다. 이러한 시장에서는 고도로 디지털화되고 모바일 중심의 소매 환경에서 작동하는 접근 방식이 선호됩니다.
남미, 중동 및 아프리카는 도입 경로가 다르며 여전히 초기 단계에 있는 지역입니다. 브라질은 대규모 전자상거래 기반을 바탕으로 남미에서 가장 큰 성장 기회를 제공합니다. 한편, 아르헨티나와 칠레의 소매업체들도 전자상거래의 확대에 따라 투자를 늘리고 있습니다. 아랍에미리트(UAE)와 사우디아라비아에서는 디지털에 적극적인 소비자들 수요가 높아지면서 스마트 리테일에 대한 투자도 증가하고 있습니다. 남아프리카, 이집트, 나이지리아 등 아프리카 시장에서는 모바일 커머스 인프라가 초기 도입을 뒷받침하고 있습니다. 이 지역 전반에 걸쳐 모바일 우선 커머스에서는 브라우저에 의존하는 개인화 엔진보다 메시징 도구나 앱 기반의 경험이 선호되는 경향이 있습니다.
기타 혜택 :
- 엑셀 형식 시장 예측(ME) 시트
- 3개월간 애널리스트 지원
자주 묻는 질문
목차
제1장 서론
제2장 조사 방법
제3장 주요 요약
제4장 시장 구도
제5장 시장 규모 및 성장 예측
제6장 경쟁 구도
제7장 시장 기회 및 향후 전망
AJY 26.09.03According to Mordor Intelligence, the retail personalization services market size is projected to expand from USD 5.52 billion in 2025 and USD 6.32 billion in 2026 to USD 13.85 billion by 2031, registering a CAGR of 16.99% between 2026 and 2031.
This report is Segmented by Application (Product Recommendations, Personalized Search and Merchandising, Loyalty and Offer Personalization, and More), Enterprise Size (Large Enterprises, and Small and Medium-Sized Enterprises), End-User Industry (Fashion and Apparel, Beauty and Personal Care, Grocery and FMCG, and More), and Geography. The Market Forecasts are Provided in Terms of Value (USD).
Global Retail Personalization Services Market Trends and Insights
Rising Demand for Individual Omnichannel Shopping Experiences
Retailers increasingly need connected experiences across stores, websites, applications, and messaging channels. The Retail Personalization Services Market benefits when behavioral signals from these touchpoints are linked to a usable customer profile. Such profiles allow retailers to respond to a shopper's recent activity rather than rely on broad campaign rules. Connected profiles also make it easier to maintain consistent service when a shopper moves between digital and physical channels. As retailers collect richer first-party data, the quality of that data becomes more important than the personalization engine alone. This increases demand for systems that can make consented data available to the teams responsible for customer interactions.
Expanding Use of AI-Led Product Discovery and Search
AI-led discovery is changing retail search from keyword matching to a process that can consider intent, inventory, product attributes, and shopper behavior. This supports the Retail Personalization Services Market because site search is often a high-intent point in the purchase path. Algolia launched Dynamic Facets in July 2026 to adapt product filters to search context and user behavior without manual configuration. Coveo introduced Conversational Product Discovery in March 2026, placing natural-language product dialogue directly within commerce search. Retailers with reliable product information and current inventory feeds can deliver more relevant search results than those with incomplete catalog records. Product data governance therefore becomes part of the commercial case for personalization services.
Data Privacy, Consent, and Cross-Border Data Compliance Complexity
Data privacy and algorithmic accountability requirements can make it harder to deploy personalization programs across multiple jurisdictions. The Retail Personalization Services Market faces added complexity when retailers must apply different consent, deletion, disclosure, and audit practices to the same program. The California Consumer Privacy Act, effective in 2026, establishes consumer privacy rights and business obligations in California. A retailer serving Europe, California, and Gulf Cooperation Council markets may need separate approaches to transparency and data handling. This burden is greater for smaller brands without large legal or technical compliance teams. Providers that embed consent controls and audit features into their platforms can reduce retailers' need to add separate tools.
Other drivers and restraints analyzed in the detailed report include:
- Growing Shift to First-Party Data and Retail Media Activation
- Need to Lift Conversion and Margin in Higher-Cost Acquisition Environments
- Integration Challenges Across Commerce, CRM, CDP, and POS Stacks
For complete list of drivers and restraints, kindly check the Table Of Contents.
Segment Analysis
Product Recommendations captured 25.27% of the Retail Personalization Services Market share in 2025, making it the largest application segment. Retailers value the application because sales from a recommendation placement can be compared with a control group. Personalized Search and Merchandising is also important because search activity often indicates immediate purchase interest. Loyalty and Offer Personalization supports a move away from broad discount campaigns, while Customer Segmentation and Analytics supplies the audience understanding needed by other applications. These established uses provide the Retail Personalization Services Market with a broad base of demand.
Customer Journey Orchestration is expected to grow at a CAGR of 19.22% from 2026 to 2031, the highest growth rate among applications. Retailers are seeking systems that coordinate customer data platforms and channel tools around real-time behavior. Bloomreach made its Loomi marketing agent generally available in June 2026, with the product designed to turn a marketer prompt into a workflow with segmentation, content, and behavior-based automation. Content Personalization remains the smallest defined application segment, but generative AI can reduce the time needed to produce individual content variants. The application mix is moving from separate tools toward coordinated customer interactions.
Complete Report Scope:
- By Application
- Product Recommendations
- Personalized Search and Merchandising
- Loyalty and Offer Personalization
- Customer Segmentation and Analytics
- Customer Journey Orchestration
- Content Personalization
- Other Applications
- By Enterprise Size
- Large Enterprises
- Small and Medium-sized Enterprises
- By End-User Industry
- Fashion and Apparel
- Beauty and Personal Care
- Grocery and FMCG
- Consumer Electronics
- Home Furnishings and Home Improvement
- Luxury and Specialty Retail
- Department Stores and Marketplaces
- By Geography
- North America
- United States
- Canada
- Mexico
- South America
- Brazil
- Argentina
- Chile
- Rest of South America
- Europe
- Germany
- United Kingdom
- France
- Italy
- Spain
- Rest of Europe
- Asia-Pacific
- China
- Japan
- India
- South Korea
- Australia
- Rest of Asia-Pacific
- Middle East
- United Arab Emirates
- Saudi Arabia
- Qatar
- Rest of Middle East
- Africa
- South Africa
- Egypt
- Nigeria
- Rest of Africa
- North America
Geography Analysis
North America held 36.39% of the global Retail Personalization Services Market in 2025. The United States supports this position through high e-commerce adoption, a large concentration of enterprise retailers, and early adoption of customer data platforms. Canada and Mexico remain earlier-stage markets relative to the United States, but benefit from vendor ecosystems and retail groups with regional operations. Europe is the second-largest geography, led by Germany, the United Kingdom, and France. European demand for AI-led personalization is substantial, but data residency and privacy requirements can slow data activation.
Asia-Pacific is projected to grow at a CAGR of 20.23% through 2031, the fastest regional rate in the Retail Personalization Services Market. China, India, South Korea, and Japan are expected to generate much of the new demand. Isetan Mitsukoshi reported a 1.4x improvement in click-through rate, a 1.4x increase in cart additions, and a 1.3x lift in conversion after deploying a personalization AI system in its e-commerce operations. These markets favor approaches that work within highly digital and mobile-led retail environments.
South America, the Middle East, and Africa remain earlier-stage geographies with different paths to adoption. Brazil is the leading South American opportunity because of its large e-commerce base, while retailers in Argentina and Chile are increasing investment as digital commerce expands. The United Arab Emirates and Saudi Arabia are seeing growing demand from digitally active consumers and smart retail investment. South Africa, Egypt, and Nigeria are among the African markets where mobile commerce infrastructure is supporting initial deployments. Across these regions, mobile-first commerce can favor messaging tools and application-based experiences over browser-dependent personalization engines.
- Adobe Inc.
- Salesforce, Inc.
- SAP SE
- Mastercard International Incorporated
- Bloomreach, Inc.
- Coveo Solutions Inc.
- Algolia, Inc.
- Nosto Solutions Ltd.
- Monetate, Inc.
- Insider by Sosyo Plus Bilgi Bilisim Tekn. Dan. Hiz. Tic. A.S.
- Braze, Inc.
- Klaviyo, Inc.
- Bluecore, Inc.
- Twilio Inc.
- Microsoft Corporation
- Google LLC
- Amazon Web Services, Inc.
- International Business Machines Corporation
- Sitecore A/S
- Optimizely North America Inc.
- PartnerCentric, Inc.
- Rise Interactive Holdings, LLC
Additional Benefits:
- The market estimate (ME) sheet in Excel format
- 3 months of analyst support
TABLE OF CONTENTS
1 INTRODUCTION
- 1.1 Study Assumptions and Market Definition
- 1.2 Scope of the Study
2 RESEARCH METHODOLOGY
3 EXECUTIVE SUMMARY
4 MARKET LANDSCAPE
- 4.1 Market Overview
- 4.2 Market Drivers
- 4.2.1 Rising Demand for 1:1 Omnichannel Shopping Experiences
- 4.2.2 Expanding Use of AI-Led Product Discovery and Search
- 4.2.3 Growing Shift to First-Party Data and Retail Media Activation
- 4.2.4 Need to Lift Conversion and Margin in Higher-Cost Acquisition Environments
- 4.2.5 Store Associate Copilots and Clienteling Linking Store and Digital Profiles
- 4.2.6 Generative AI Reducing the Cost of Long-Tail Content and Offer Personalization
- 4.3 Market Restraints
- 4.3.1 Data Privacy, Consent, and Cross-Border Data Compliance Complexity
- 4.3.2 Integration Challenges Across Commerce, CRM, CDP, and POS Stacks
- 4.3.3 Identity Fragmentation from Anonymous Traffic and Walled-Garden Checkout Paths
- 4.3.4 Content Operations Bottlenecks for High-Frequency Personalization Testing
- 4.4 Impact of Macroeconomic Factors on the Market
- 4.5 Industry Value-Chain Analysis
- 4.6 Technology Outlook
- 4.7 Regulatory Landscape
- 4.8 Porter's Five Forces Analysis
- 4.8.1 Threat of New Entrants
- 4.8.2 Bargaining Power of Suppliers
- 4.8.3 Bargaining Power of Buyers
- 4.8.4 Threat of Substitutes
- 4.8.5 Intensity of Competitive Rivalry
5 MARKET SIZE AND GROWTH FORECASTS (VALUE)
- 5.1 By Application
- 5.1.1 Product Recommendations
- 5.1.2 Personalized Search and Merchandising
- 5.1.3 Loyalty and Offer Personalization
- 5.1.4 Customer Segmentation and Analytics
- 5.1.5 Customer Journey Orchestration
- 5.1.6 Content Personalization
- 5.1.7 Other Applications
- 5.2 By Enterprise Size
- 5.2.1 Large Enterprises
- 5.2.2 Small and Medium-sized Enterprises
- 5.3 By End-User Industry
- 5.3.1 Fashion and Apparel
- 5.3.2 Beauty and Personal Care
- 5.3.3 Grocery and FMCG
- 5.3.4 Consumer Electronics
- 5.3.5 Home Furnishings and Home Improvement
- 5.3.6 Luxury and Specialty Retail
- 5.3.7 Department Stores and Marketplaces
- 5.4 By Geography
- 5.4.1 North America
- 5.4.1.1 United States
- 5.4.1.2 Canada
- 5.4.1.3 Mexico
- 5.4.2 South America
- 5.4.2.1 Brazil
- 5.4.2.2 Argentina
- 5.4.2.3 Chile
- 5.4.2.4 Rest of South America
- 5.4.3 Europe
- 5.4.3.1 Germany
- 5.4.3.2 United Kingdom
- 5.4.3.3 France
- 5.4.3.4 Italy
- 5.4.3.5 Spain
- 5.4.3.6 Rest of Europe
- 5.4.4 Asia-Pacific
- 5.4.4.1 China
- 5.4.4.2 Japan
- 5.4.4.3 India
- 5.4.4.4 South Korea
- 5.4.4.5 Australia
- 5.4.4.6 Rest of Asia-Pacific
- 5.4.5 Middle East
- 5.4.5.1 United Arab Emirates
- 5.4.5.2 Saudi Arabia
- 5.4.5.3 Qatar
- 5.4.5.4 Rest of Middle East
- 5.4.6 Africa
- 5.4.6.1 South Africa
- 5.4.6.2 Egypt
- 5.4.6.3 Nigeria
- 5.4.6.4 Rest of Africa
- 5.4.1 North America
6 COMPETITIVE LANDSCAPE
- 6.1 Market Concentration
- 6.2 Strategic Moves
- 6.3 Market Share Analysis
- 6.4 Company Profiles (includes Global Level Overview, Market Level Overview, Core Segments, Financials as available, Strategic Information, Market Rank/Share, Products and Services, Recent Developments)
- 6.4.1 Adobe Inc.
- 6.4.2 Salesforce, Inc.
- 6.4.3 SAP SE
- 6.4.4 Mastercard International Incorporated
- 6.4.5 Bloomreach, Inc.
- 6.4.6 Coveo Solutions Inc.
- 6.4.7 Algolia, Inc.
- 6.4.8 Nosto Solutions Ltd.
- 6.4.9 Monetate, Inc.
- 6.4.10 Insider by Sosyo Plus Bilgi Bilisim Tekn. Dan. Hiz. Tic. A.S.
- 6.4.11 Braze, Inc.
- 6.4.12 Klaviyo, Inc.
- 6.4.13 Bluecore, Inc.
- 6.4.14 Twilio Inc.
- 6.4.15 Microsoft Corporation
- 6.4.16 Google LLC
- 6.4.17 Amazon Web Services, Inc.
- 6.4.18 International Business Machines Corporation
- 6.4.19 Sitecore A/S
- 6.4.20 Optimizely North America Inc.
- 6.4.21 PartnerCentric, Inc.
- 6.4.22 Rise Interactive Holdings, LLC
7 MARKET OPPORTUNITIES AND FUTURE OUTLOOK
- 7.1 White-Space and Unmet-Need Assessment


