

|
시장보고서
상품코드
2121295
인도네시아의 태양에너지 : 시장 점유율 분석, 업계 동향과 통계, 성장 예측(2026-2031년)Indonesia Solar Energy - Market Share Analysis, Industry Trends & Statistics, Growth Forecasts (2026 - 2031) |
||||||
 Mordor Intelligence
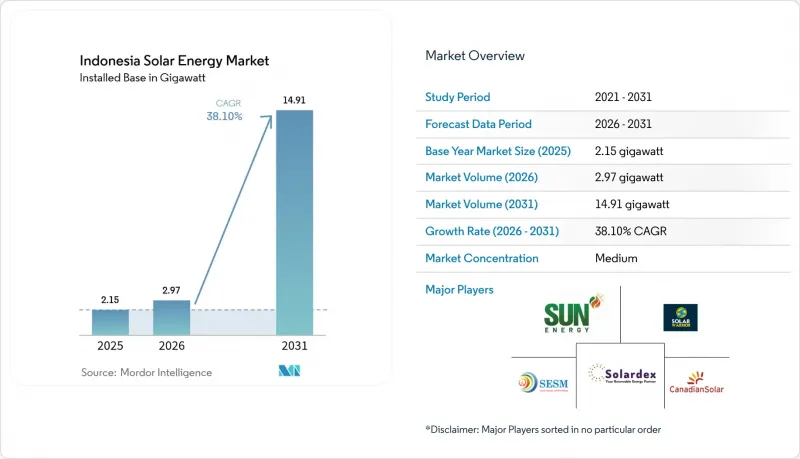
Mordor Intelligence에 따르면 인도네시아의 태양에너지 시장 규모는 2025년 2.15기가와트에서 2026년에는 2.97기가와트로 확대되고, 2026년부터 2031년까지 CAGR 38.10%를 기록하며 2031년에는 14.91기가와트에 달할 것으로 예측됩니다.
본 보고서는 기술별(태양광발전(PV), 집광형 태양열 발전(CSP)), 그리드 유형별(온그리드, 오프그리드), 최종사용자별(실용 규모, 상업·산업용, 주택)로 분류되어 있습니다. 시장 규모와 전망은 설치 용량(GW)으로 표시되어 있습니다.
인도네시아 태양에너지 시장의 동향 및 인사이트
정부의 옥상 설치 인센티브가 분산형 도입을 가속화
MEMR 규정 제2/2024호에 따라 넷 미터링이 폐지되고 5.746GW 할당제로 대체되었습니다. 이를 통해 계통연계 규정이 명확해져 PLN의 수익이 보호되는 동시에, 상업용 시스템에 대한 세제 혜택이 유지되고 있습니다. 자카르타 주지사 규정 제38/2024호에 따라, 500m²를 초과하는 신규 상업용 건물에 옥상 태양광발전 시스템 설치가 의무화되었습니다. 이러한 의무화 조치는 서자바 주와 발리 주에서도 유사하게 시행되고 있습니다. 이 조치와 할당량을 결합함으로써, 2028년까지 개발업자의 사업 전망이 명확해지는 투명성이 높은 파이프라인이 구축되었습니다. 이 제도는 잉여 발전 크레딧에 상한선을 설정함으로써 일반 가정을 자가 소비로 유도하는 한편, 주간 발전량을 흡수할 수 있는 대규모 기업용 설비의 도입을 촉진하고 있습니다. 각 개발사는 2027년 주택 부문이 재개될 때 신청 기간이 더욱 단축될 것으로 예상하여, 할당량을 조기에 확보하기 위해 설계 일정을 앞당기고 있습니다. 동시에, 지방자치단체의 과태료 및 허가 취득 인센티브로 인해 규정 준수율이 향상되면서, 인구 밀도가 높은 도시 지역의 인도네시아 태양에너지 시장이 확대되고 있습니다.
모듈의 평균 판매 가격(ASP) 하락으로 인해 균등화 발전 비용이 그리드 패리티를 밑돌게 되었습니다.
폴리실리콘 현물 가격은 2023년 30달러/kg에서 2024년 4분기에는 8달러/kg까지 하락하여, 결정질 실리콘 모듈의 평균 판매 가격(ASP)은 절반으로 줄었습니다. 이로 인해 최근 PLN(인도네시아 전력공사)의 입찰에서는 1kWh당 1,050루피아라는 저렴한 가격으로 EPC 입찰이 가능해졌습니다. 운임 정상화로 인해 중국산 Tier 1 모듈의 입고 비용이 추가로 15-20% 절감되었으며, 동누사텡가라주와 남칼리만탄주에서는 균등화 발전 비용이 석탄 발전의 벤치마크를 밑도는 수준이 되었습니다. 이에 따라 각 개발사들은 PLN이 2025-2034년까지 설정한 태양광발전 할당량 17.1GW를 이미 상회하는 자발적인 전력 구매 계약(PPA) 제안을 제출하고 있습니다. 그러나 제조사들이 고가의 재고를 처분하고 있어 이익률에 대한 압박은 여전히 남아 있으며, 인도네시아 기업들은 수주 시기를 신중하게 조정할 수밖에 없는 상황입니다. 선물 곡선에 따르면, 중국 공장의 가동률이 연간 600GW 이상을 유지한다면, 인도네시아 태양에너지 시장은 2026년까지 kWh당 0.07달러 이하의 전력 요금 혜택을 받게 될 것입니다.
TKDN(현지 조달률) 요건이 프로젝트의 경제성을 향상시킨다
MEMR(에너지광물자원부)의 정령 제191/2024호에 따라,TKDN(현지 조달률) 기준치는 20%로 하향 조정되었으나, 인도네시아에는 폴리실리콘 및 웨이퍼 제조 공장이 부족하기 때문에 개발사는 여전히 12-18% 높은 EPC 비용에 직면해 있습니다. 이로 인해 PT Len Industri의 600MW 생산 라인이 기준을 충족하는 주요 공급원이 되고 있습니다. 수주 대기 기간이 9개월에 달함에 따라, 실용 규모의 사업자들은 PPA(전력구매계약) 일정을 재협상하거나 일부 수입에 따른 벌금을 감수할 수밖에 없는 상황입니다. PLN은 여전히 요금 인상에 소극적이며, 그 결과 마진이 압박을 받고 있고, 이는 공급망 전체로 파급되고 있습니다. 현재 일부 IPP(독립 발전 사업자)는 20% 기준을 초과하기 위해 국내 공급업체의 BOS(밸런스 오브 시스템) 장비를 조합하고 있으나, 감사로 인해 상업 운전 개시 증명서 발급이 최대 90일 지연될 가능성이 있습니다. 2027년까지 새로운 기가와트급 발전소가 상업 운전을 시작하지 않는 한, TKDN 규제는 계속해서 인도네시아 태양에너지 시장의 발전을 저해할 것으로 보입니다.
부문별 분석
2025년 현재, 인도네시아 태양에너지 시장 규모의 100.00%를 태양광발전(Solar PV)이 차지하고 있으며, 2031년까지 연평균 성장률(CAGR) 38.10%로 확대될 것으로 예측됩니다. CSP는 여전히 상업적으로 수익성이 없습니다. 그 이유는 인도네시아의 대부분의 입지에서 DNI가 1,400-1,600kWh/m²에 그쳐, CSP가 경쟁력을 유지하기 위해 필요한 2,000kWh/m²라는 기준을 크게 밑돌기 때문입니다. 태양광발전(PV)의 설비 투자액은 1kW당 800-1,200달러인 반면, CSP는 4,000-6,000달러로 고가이기 때문에 투자자들은 결정질 실리콘 방식에 자본을 집중하고 있습니다. 토지가 제한적인 자바섬에서 개발업체들이 10-15%의 수율 향상을 목표로 하는 가운데, 2024년 수입량의 60%를 양면 수광형 및 TOPCon 모듈이 차지했습니다. IEC 61215 및 IEC 61730 규격 준수를 통해 가격 압박에도 불구하고 은행 대출의 신뢰성이 유지되고 있으며, 인도네시아 태양에너지 시장에서 태양광발전의 독점적 지위가 더욱 공고해지고 있습니다.
2세대 셀 기술로 발전량 향상이 가속화되었으며, 고정 할당량 내에서 정격 출력의 소형화를 가능하게함으로써 출력 억제 위험을 경감하고 있습니다. LONGi와 Trina는 2024년에 각각 500MW가 넘는 양면 수광형 모듈을 출하했으며, 그 대부분은 부유식 태양광발전소나 디젤 발전과 결합된 하이브리드 시설용이었습니다. 모듈의 에너지 밀도가 향상됨에 따라, 개발사들은 2027년까지 토지 요건이 7% 감소할 것으로 예측하고 있으며, 이로 인해 자바 섬의 도시 주변 지역에서 지역 사회의 수용성 장벽이 완화되는 동시에 프로젝트의 내부 수익률(IRR)도 향상될 것으로 보입니다.
기타 혜택
- 엑셀 형식의 시장 예측(ME) 시트
- 3개월간의 애널리스트 지원
자주 묻는 질문
목차
제1장 소개
제2장 조사 방법
제3장 주요 요약
제4장 시장 구도
제5장 시장 규모와 성장 예측
제6장 경쟁 구도
제7장 시장 기회와 향후 전망
KSM 26.09.03According to Mordor Intelligence, the Indonesia solar energy market size is expected to grow from 2.15 gigawatt in 2025 to 2.97 gigawatt in 2026 and is forecast to reach 14.91 gigawatt by 2031 at 38.10% CAGR over 2026-2031.
This report is Segmented by Technology (Solar Photovoltaic and Concentrated Solar Power), Grid Type (On-Grid and Off-Grid), and End-User (Utility-Scale, Commercial and Industrial, and Residential). The Market Sizes and Forecasts are Provided in Terms of Installed Capacity (GW).
Indonesia Solar Energy Market Trends and Insights
Government Rooftop Incentives Accelerate Distributed Adoption
MEMR Regulation 2/2024 ended net-metering and replaced it with a 5.746 GW quota, clarifying interconnection rules and protecting PLN revenues while sustaining tax allowances for commercial systems. Jakarta's Governor Regulation 38/2024 now obliges the installation of rooftop solar on new commercial buildings exceeding 500 m2, a mandate mirrored in West Java and Bali. Together with the quota, this delivers a transparent pipeline that boosts developer visibility until 2028. The mechanism caps excess-generation credits, steering households toward self-consumption yet unlocking larger corporate installations that can absorb daytime output. Developers have accelerated engineering timelines to secure quota allocations early, anticipating tighter windows once the residential segment restarts in 2027. At the same time, municipal fines and permitting incentives ensure higher compliance, thereby expanding the Indonesian solar energy market in densely populated urban districts.
Module ASP Declines Compress Levelized Costs Below Grid Parity
Polysilicon spot prices declined from USD 30/kg in 2023 to USD 8/kg by Q4 2024, halving crystalline-silicon module ASPs and enabling EPC bids as low as IDR 1,050 per kWh in recent PLN tenders. Normalized freight rates shaved another 15-20% off landed costs for Chinese Tier-1 modules, pushing levelized electricity costs beneath coal benchmarks in East Nusa Tenggara and South Kalimantan. Developers responded by lodging unsolicited PPA proposals that already exceed PLN's 17.1 GW solar allocation for 2025-2034. Yet margin pressure remains as manufacturers offload high-priced inventory, compelling Indonesian firms to hedge order timing. Forward curves indicate that if Chinese factory utilization stays above 600 GW annually, the Indonesian solar energy market will benefit from sub-USD 0.07 kWh tariffs through 2026.
TKDN Local-Content Mandate Elevates Project Economics
MEMR Decree 191/2024 trimmed the TKDN threshold to 20%, yet developers still face 12-18% higher EPC costs because Indonesia lacks polysilicon and wafer plants, leaving PT Len Industri's 600 MW line as the chief compliant source. Queue times stretch to nine months, compelling utility-scale sponsors to renegotiate PPA schedules or accept partial-import penalties. PLN remains reluctant to uplift tariffs, forcing margin compression that cascades through the supply chain. Several IPPs now bundle balance-of-system gear from domestic suppliers to surpass the 20% threshold, although audits can delay commercial-operation certificates by up to 90 days. Unless new gigawatt-scale factories reach commercial operation before 2027, the TKDN rule will continue to hinder the Indonesian solar energy market.
Other drivers and restraints analyzed in the detailed report include:
- RE100 Corporate Commitments Drive C&I PPA Volume
- Diesel Displacement in Eastern Archipelago Eases Fiscal Strain
- Grid-Absorption Constraints Trigger Curtailment Incidents
For complete list of drivers and restraints, kindly check the Table Of Contents.
Segment Analysis
Solar PV accounted for 100.00% of the Indonesian solar energy market size in 2025 and is forecast to advance at a 38.10% CAGR through 2031. CSP remains commercially unviable because most Indonesian sites record 1,400-1,600 kWh/m2 DNI, which is well below the 2,000 kWh/m2 threshold that CSP needs to remain competitive. PV capex of USD 800-1,200 kW undercuts CSP's USD 4,000-6,000 kW, so investors concentrate capital on crystalline-silicon routes. Bifacial and TOPCon modules captured 60% of 2024 imports as developers chase 10-15% yield gains in land-constrained Java. Compliance with IEC 61215 and IEC 61730 standards upholds bankability despite price compression, further reinforcing PV's exclusive status in the Indonesian solar energy market.
Second-generation cell technologies accelerate yield improvements, mitigating curtailment risks by enabling lower nameplate sizing for fixed quotas. LONGi and Trina each delivered over 500 MW of bifacial shipments in 2024, primarily for floating PV and hybrid diesel sites. As module energy density rises, developers forecast a 7% drop in land requirements by 2027, alleviating community-acceptance barriers in peri-urban Java while bolstering project IRRs.
Complete Report Scope:
- By Technology
- Solar Photovoltaic (PV)
- Concentrated Solar Power (CSP)
- By Grid Type
- On-Grid
- Off-Grid
- By End-User
- Utility-Scale
- Commercial and Industrial (C&I)
- Residential
- By Component (Qualitative Analysis)
- Solar Modules/Panels
- Inverters (String, Central, Micro)
- Mounting and Tracking Systems
- Balance-of-System and Electricals
- Energy Storage and Hybrid Integration
List of Companies Covered in this Report:
- PT Surya Utama Nuansa (SUN Energy)
- PT TotalEnergies Eren Indonesia
- PT Sumber Energi Sukses Makmur (SES)
- PT Sumber Energi Surya Nusantara (SESNA)
- PT Solardex Energy Indonesia
- Canadian Solar Inc.
- Trina Solar Co. Ltd.
- LONGi Green Energy Technology Co. Ltd.
- First Solar Inc.
- JA Solar Technology Co. Ltd.
- Risen Energy Co. Ltd.
- PT Len Industri (Persero)
- PT PLN Nusantara Power
- Akuo Energy Indonesia
- ACWA Power Indonesia
- Vena Energy Indonesia
- Masdar Indonesia
- PT Xurya Daya Indonesia
- Enernet Global Indonesia
Additional Benefits:
- The market estimate (ME) sheet in Excel format
- 3 months of analyst support
TABLE OF CONTENTS
1 Introduction
- 1.1 Study Assumptions & Market Definition
- 1.2 Scope of the Study
2 Research Methodology
3 Executive Summary
4 Market Landscape
- 4.1 Market Overview
- 4.2 Market Drivers
- 4.2.1 Government rooftop-net-metering incentives strengthened (2023)
- 4.2.2 Declining global module ASPs and shipping costs
- 4.2.3 Corporate RE-PPA demand from RE100 manufacturers
- 4.2.4 Diesel-hybrid swaps on remote islands cut PLN subsidy burden
- 4.2.5 Jakarta & provincial mandatory-rooftop by-laws
- 4.2.6 Sulawesi nickel-smelter self-generation requirement
- 4.3 Market Restraints
- 4.3.1 40 % TKDN local-content rule inflates costs
- 4.3.2 Grid-absorption quota & curtailment risk
- 4.3.3 Lack of sovereign guarantee for floating-PV PPAs
- 4.3.4 High IDR-FX hedging costs for IPPs
- 4.4 Supply-Chain Analysis
- 4.5 Regulatory Landscape
- 4.6 Technological Outlook
- 4.7 Porters Five Forces
- 4.7.1 Threat of New Entrants
- 4.7.2 Bargaining Power of Suppliers
- 4.7.3 Bargaining Power of Buyers
- 4.7.4 Threat of Substitutes
- 4.7.5 Industry Rivalry
- 4.8 PESTLE Analysis
5 Market Size & Growth Forecasts
- 5.1 By Technology
- 5.1.1 Solar Photovoltaic (PV)
- 5.1.2 Concentrated Solar Power (CSP)
- 5.2 By Grid Type
- 5.2.1 On-Grid
- 5.2.2 Off-Grid
- 5.3 By End-User
- 5.3.1 Utility-Scale
- 5.3.2 Commercial and Industrial (C&I)
- 5.3.3 Residential
- 5.4 By Component (Qualitative Analysis)
- 5.4.1 Solar Modules/Panels
- 5.4.2 Inverters (String, Central, Micro)
- 5.4.3 Mounting and Tracking Systems
- 5.4.4 Balance-of-System and Electricals
- 5.4.5 Energy Storage and Hybrid Integration
6 Competitive Landscape
- 6.1 Market Concentration
- 6.2 Strategic Moves (M&A, Partnerships, PPAs)
- 6.3 Market Share Analysis (Market Rank/Share for key companies)
- 6.4 Company Profiles (includes Global level Overview, Market level overview, Core Segments, Financials as available, Strategic Information, Products & Services, and Recent Developments)
- 6.4.1 PT Surya Utama Nuansa (SUN Energy)
- 6.4.2 PT TotalEnergies Eren Indonesia
- 6.4.3 PT Sumber Energi Sukses Makmur (SES)
- 6.4.4 PT Sumber Energi Surya Nusantara (SESNA)
- 6.4.5 PT Solardex Energy Indonesia
- 6.4.6 Canadian Solar Inc.
- 6.4.7 Trina Solar Co. Ltd.
- 6.4.8 LONGi Green Energy Technology Co. Ltd.
- 6.4.9 First Solar Inc.
- 6.4.10 JA Solar Technology Co. Ltd.
- 6.4.11 Risen Energy Co. Ltd.
- 6.4.12 PT Len Industri (Persero)
- 6.4.13 PT PLN Nusantara Power
- 6.4.14 Akuo Energy Indonesia
- 6.4.15 ACWA Power Indonesia
- 6.4.16 Vena Energy Indonesia
- 6.4.17 Masdar Indonesia
- 6.4.18 PT Xurya Daya Indonesia
- 6.4.19 Enernet Global Indonesia
7 Market Opportunities & Future Outlook
- 7.1 White-space & Unmet-Need Assessment


