

|
시장보고서
상품코드
2122500
IoT 분석 : 시장 점유율 분석, 업계 동향과 통계, 성장 예측(2026-2031년)IoT Analytics - Market Share Analysis, Industry Trends & Statistics, Growth Forecasts (2026 - 2031) |
||||||
 Mordor Intelligence
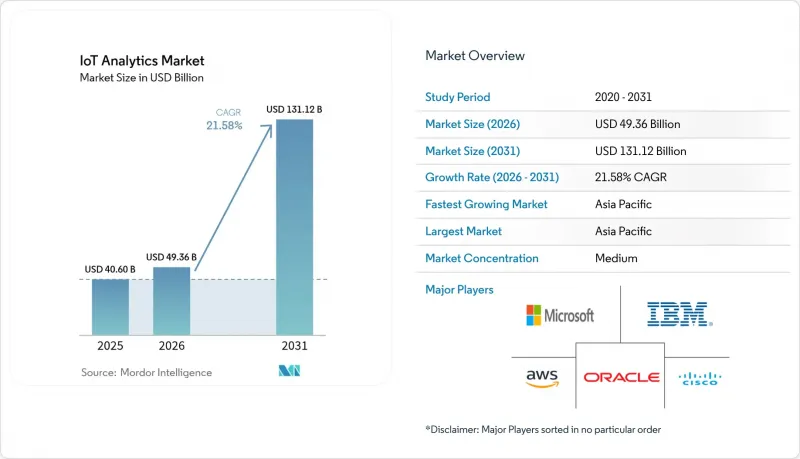
Mordor Intelligence에 의하면, IoT 분석 시장 규모는 2025년에 406억 달러로 평가되었고, 2026년493억 6,000만 달러에서 2031년까지 1,311억 2,000만 달러에 이를 것으로 예측되며, 예측 기간(2026년-2031년) CAGR은 21.58%를 기록할 전망입니다.
본 보고서는 구성 요소(솔루션 및 서비스),구축 형태(On-Premise 및 클라우드), 조직 규모(대기업 및 중소기업(SME)), 용도(예지 보전, 자산 성과 관리, 에너지 관리 등), 최종 사용자 산업(제조, 에너지·유틸리티, 운송 및 물류, 소매 및 전자상거래 등), 그리고 지역별로 분류되어 있습니다.
세계 IoT 분석 시장 동향 및 인사이트
엑사바이트 규모의 데이터를 생성하는 IoT 기기의 급증
연결된 기기의 수는 급증하고 있으며, 2025년까지 전 세계 IoT 엔드포인트가 연간 175제타바이트 이상의 데이터를 생성할 것으로 예측됩니다. 플랜트 수준의 센서 어레이는 이미 매일 테라바이트급의 데이터를 전송하고 있으며, 기업들은 클라우드로의 백홀 지연을 피하기 위해 엣지 측에 분석 엔진을 도입할 수밖에 없게 되었습니다. 이러한 ‘엣지 퍼스트’ 모델을 채택한 제조업체들은 클라우드 전용 환경에 비해 30% 더 높은 운영 효율을 기록하고 있습니다. 데이터의 급증은 구조화된 텔레메트리 데이터, 비구조화된 동영상, 로그 파일에 이르기까지 다양하며, 다양한 페이로드를 동시에 처리할 수 있는 멀티모달 분석 프레임워크에 대한 투자를 촉진하고 있습니다.
클라우드 네이티브 분석 플랫폼이 기업에서 점차 받아들여지고 있습니다.
Microsoft Azure IoT Operations와 같은 확장 가능한 종량제 서비스를 통해 기업은 하루에 수십억 건의 메시지를 처리하면서도 인프라 비용을 최대 60%까지 절감할 수 있습니다. 제로 트러스트 아키텍처와 내장된 위협 분석 기능 덕분에 보안에 대한 우려가 완화되면서, 제조 및 물류 분야의 완전한 클라우드 도입이 가속화되고 있습니다. 규제가 엄격한 산업에서는 클라우드와 On-Premise 처리를 결합하는 추세가 계속되고 있지만, 공급업체들이 규정 준수 툴킷을 확충함에 따라 전환의 기세는 여전히 강합니다.
데이터 개인정보 보호 및 국경을 초월한 규정 준수의 복잡성
GDPR(EU 개인정보보호규정)은 동의, 데이터 최소화 및 현지화에 관한 엄격한 규칙을 부과하고 있으며, 규정 위반 시 전 세계 매출의 4%에 해당하는 벌금이 부과될 수 있습니다. 국가마다 다른 법률로 인해 기업은 여러 지역의 데이터 저장소를 유지해야만 하며, 이로 인해 프로젝트 예산이 최대 25%까지 증가하게 됩니다. 국경을 넘는 실시간 분석의 경우, 주권 관련 요건을 충족하기 위해 정책 기반 라우팅을 통합해야 하는데, 이것이 기업의 도입을 지연시키고 있습니다.
부문 분석
솔루션 부문은 계속해서 시장을 주도할 것으로 보이며, 2025년에는 매출의 67.95%를 차지할 전망입니다. IoT 분석 솔루션 시장 규모는 꾸준히 확대될 것으로 예측되지만, 기업들이 관리형 전문 지식을 요구함에 따라 서비스 부문은 연평균 성장률(CAGR) 23.12%라는 더 빠른 속도로 성장할 전망입니다. 프로토콜 매핑, 엣지 스택 튜닝, 멀티 클라우드 통합 분야에서 전문 서비스에 대한 수요가 증가하고 있습니다.
인력 부족과 아키텍처의 복잡성이 심화되는 가운데, 외부 파트너의 활용이 주목받고 있습니다. 관리형 서비스 계약에서는 소프트웨어, 인프라, 성과 기반 SLA가 세트로 제공되는 경우가 많으며, 위험은 공급자 측으로 전가됩니다. 보안 분석 하위 부문은 연결된 기기와 관련된 공격 표면의 확대에 힘입어 성장하고 있습니다.
2025년에는 제어성, 지연 시간, 규제 요건을 반영하여 On-Premise 도입이 64.62%의 점유율을 차지했습니다. 그러나 하이퍼스케일러 기업들이 데이터 수집 파이프라인과 서버리스 분석 엔진을 결합함에 따라 클라우드 인스턴스는 연평균 성장률(CAGR) 23.30%로 성장하고 있습니다. 하이브리드 설계에서는 시간 제약이 있는 워크로드를 엣지 노드로 라우팅하는 동시에, 집계된 데이터를 클라우드로 전송하여 배치 AI 처리를 수행합니다.
마이크로소프트와 아마존은 조합형 솔루션으로 업계를 선도하고 있으며, 기업들은 이를 통해 디지털 트윈이나 대규모 모델 훈련을 몇 분 이내에 구축할 수 있게 되었습니다. 공급망의 변동과 에너지 가격의 급등락은 탄력적인 컴퓨팅의 필요성을 부각시키고 있으며, 이는 클라우드 도입을 더욱 가속화하고 있습니다.
지역별 분석
아시아태평양은 ‘중국 제조 2025’ 및 인도의 ‘스마트 시티 미션’과 같은 정부 프로그램의 혜택을 받아 2025년 매출의 35.86%를 차지했습니다. 이 지역의 연평균 성장률(CAGR)은 22.84%로, 산업의 디지털화, 5G 확산, 엣지 AI 시범 프로젝트의 규모를 여실히 보여줍니다. 중국의 공장에서는 비전 기반 품질 관리가 도입되고 있으며, 인도의 지자체에서는 센서 네트워크를 활용하여 폐기물 및 교통 관리를 수행하고 있습니다.
북미는 성숙한 클라우드 인프라와 AI의 조기 도입 덕분에 이를 근소한 차이로 뒤쫓고 있습니다. 기업들은 탄탄한 벤처 자금과 대학의 연구 파이프라인에 힘입어 스트리밍 분석을 디지털 운영 센터에 통합하고 있습니다. 이 지역은 자율 주행 및 정밀 농업 프로젝트의 시험장 역할을 계속해서 수행하고 있습니다.
유럽에서는 ESG 규정 준수가 실시간 배출량 모니터링을 촉진하며 꾸준한 성장을 보이고 있습니다. ‘유럽 그린 딜’에 기반한 노력으로, 유틸리티 및 제조업은 데이터 기반의 효율화로 나아가고 있습니다. 라틴아메리카와 중동의 신흥 시장에서는 통신 사업자들이 NB-IoT 및 5G 커버리지를 확대함에 따라 탄력을 받고 있으며, 물류, 석유, 공공 안전 분야에서의 신규 도입이 가능해졌습니다.
기타 혜택:
- 엑셀 형식 시장 예측(ME) 시트
- 3개월간의 애널리스트 지원
자주 묻는 질문
목차
제1장 서론
제2장 조사 방법
제3장 주요 요약
제4장 시장 구도
제5장 시장 규모와 성장 예측
제6장 경쟁 구도
제7장 시장 기회와 향후 전망
LSH 26.09.03According to Mordor Intelligence, the IoT analytics market size was valued at USD 40.60 billion in 2025 and estimated to grow from USD 49.36 billion in 2026 to reach USD 131.12 billion by 2031, at a CAGR of 21.58% during the forecast period (2026-2031).
This report is Segmented by Component (Solutions and Services), Deployment (On-Premise and Cloud), Organization Size (Large Enterprises and Small and Medium Enterprises (SMEs)), Application (Predictive Maintenance, Asset Performance Management, Energy Management, and More), End-User Industry (Manufacturing, Energy and Utilities, Transportation and Logistics, Retail and E-Commerce, and More), and Geography.
Global IoT Analytics Market Trends and Insights
Proliferation of IoT Devices Generating Exabyte-Scale Data
Connected-device counts are rising sharply, with global IoT endpoints expected to produce more than 175 zettabytes of data annually by 2025. Plant-level sensor arrays already emit terabytes each day, forcing enterprises to deploy analytics engines at the edge to avoid cloud-backhaul delays. Manufacturers adopting this edge-first model record 30% higher operational efficiency versus cloud-only setups. The data surge spans structured telemetry, unstructured video, and log files, prompting investment in multimodal analytic frameworks that can handle diverse payloads concurrently.
Cloud-Native Analytics Platforms Gaining Enterprise Acceptance
Scalable, pay-as-you-go services such as Microsoft Azure IoT Operations allow firms to ingest billions of daily messages while cutting infrastructure outlays by up to 60%. Zero-trust architectures and built-in threat analytics lessen security concerns, accelerating full-cloud adoption in manufacturing and logistics. Highly regulated verticals continue to blend cloud and local processing, but migration momentum remains strong as providers extend compliance toolkits.
Data-Privacy and Cross-Border Compliance Complexity
GDPR imposes stringent consent, minimization, and localization rules; non-compliance can cost 4% of global turnover. Divergent national laws force firms to maintain multiple regional data stores, inflating project budgets by up to 25%. Real-time analytics crossing borders must incorporate policy-aware routing to satisfy sovereignty mandates, slowing enterprise rollouts.
Other drivers and restraints analyzed in the detailed report include:
- Predictive-Maintenance Demand Across Asset-Intensive Industries
- Edge-AI Accelerators Enabling Sub-Second Analytics
- Shortage of IoT Data-Science Talent Pool
For complete list of drivers and restraints, kindly check the Table Of Contents.
Segment Analysis
Solutions continued to dominate, accounting for 67.95% revenue in 2025. The IoT analytics market size for solutions is forecast to increase steadily, yet the services category is set to expand faster at 23.12% CAGR as firms seek managed expertise. Professional services are in high demand for protocol mapping, edge-stack tuning, and multi-cloud integration.
The talent shortfall and rising architectural complexity make external partners attractive. Managed-service contracts often bundle software, infrastructure, and outcome-based SLAs, shifting risk to providers. Security-analytics sub-segments are buoyed by expanding attack surfaces tied to connected devices.
On-premise installations held 64.62% share in 2025, reflecting control, latency, and regulatory needs. Yet cloud instances are growing at 23.30% CAGR as hyperscalers couple ingestion pipelines with serverless analytic engines. Hybrid designs route time-critical workloads to edge nodes while sending aggregated data to the cloud for batch AI.
Microsoft and Amazon lead with composable offerings, enabling enterprises to spin up digital twins and large-scale model training within minutes. Supply-chain volatility and energy-price swings underline the need for elastic compute, further pushing cloud uptake.
Complete Report Scope:
- By Component
- Solutions
- Network Management
- Security Analytics
- Real-time Streaming Analytics
- Data Management and Storage Analytics
- Visualization and Dashboard
- Services
- Professional Services
- Managed Services
- Solutions
- By Deployment
- On-premise
- Cloud
- By Organisation Size
- Large Enterprises
- Small and Medium Enterprises (SMEs)
- By Application
- Predictive Maintenance
- Asset Performance Management
- Energy Management
- Supply-Chain and Logistics Optimisation
- Other Applications
- By End-User Industry
- Manufacturing
- Energy and Utilities
- Transportation and Logistics
- Retail and E-Commerce
- Healthcare and Life Sciences
- Other End-User Industries
- By Geography
- North America
- United States
- Canada
- Mexico
- Europe
- Germany
- United Kingdom
- France
- Italy
- Spain
- Russia
- Rest of Europe
- Asia-Pacific
- China
- Japan
- India
- South Korea
- Australia and New Zealand
- Rest of Asia-Pacific
- South America
- Brazil
- Argentina
- Rest of South America
- Middle East and Africa
- Middle East
- Saudi Arabia
- United Arab Emirates
- Turkey
- Rest of Middle East
- Africa
- South Africa
- Nigeria
- Rest of Africa
- Middle East
- North America
Geography Analysis
Asia-Pacific delivered 35.86% of 2025 revenue, benefiting from government programs such as "Made in China 2025" and India's Smart Cities Mission. Regional CAGR of 22.84% underscores the scale of industrial digitization, 5G rollout, and edge-AI pilots. Chinese factories deploy vision-based quality control, while Indian municipalities apply sensor networks to manage waste and traffic.
North America follows closely, with mature cloud infrastructure and early AI adoption. Enterprises integrate streaming analytics with digital-operations centers, aided by robust venture funding and university research pipelines. The region remains a test-bed for autonomous-mobility and precision-agriculture projects.
Europe posts steady growth as ESG compliance drives real-time emissions monitoring. Initiatives under the European Green Deal push utilities and manufacturers toward data-driven efficiency. Emerging markets in Latin America and the Middle East gain momentum as telecom operators extend NB-IoT and 5G coverage, enabling greenfield deployments in logistics, oil, and public safety.
- Microsoft Corporation
- Amazon Web Services, Inc.
- IBM Corporation
- Google LLC
- Cisco Systems, Inc.
- Oracle Corporation
- SAP SE
- Dell Technologies Inc.
- The Hewlett Packard Enterprise Company
- Teradata Corporation
- Salesforce, Inc.
- Accenture plc
- PTC Inc.
- Hitachi Vantara LLC
- Cloudera, Inc.
- Software AG
- SAS Institute Inc.
- Splunk Inc.
- C3.ai, Inc.
- Uptake Technologies Inc.
- GE Digital
- QlikTech International AB
Additional Benefits:
- The market estimate (ME) sheet in Excel format
- 3 months of analyst support
TABLE OF CONTENTS
1 INTRODUCTION
- 1.1 Study Assumptions and Market Definition
- 1.2 Scope of the Study
2 RESEARCH METHODOLOGY
3 EXECUTIVE SUMMARY
4 MARKET LANDSCAPE
- 4.1 Market Overview
- 4.2 Market Drivers
- 4.2.1 Proliferation of IoT devices generating exabyte-scale data
- 4.2.2 Cloud-native analytics platforms gaining enterprise acceptance
- 4.2.3 Predictive-maintenance demand across asset-intensive industries
- 4.2.4 Edge-AI accelerators enabling sub-second analytics at the edge
- 4.2.5 Enterprise data-fabric architectures unifying siloed IoT streams
- 4.2.6 ESG-driven sustainability monitoring mandates
- 4.3 Market Restraints
- 4.3.1 Data-privacy and cross-border compliance complexity
- 4.3.2 Shortage of IoT data-science talent pool
- 4.3.3 Industrial-protocol fragmentation hindering interoperability
- 4.3.4 Rising telemetry bandwidth costs for high-frequency sensors
- 4.4 Value Chain Analysis
- 4.5 Regulatory Landscape
- 4.6 Technological Outlook
- 4.7 Porter's Five Forces Analysis
- 4.7.1 Bargaining Power of Suppliers
- 4.7.2 Bargaining Power of Buyers
- 4.7.3 Threat of New Entrants
- 4.7.4 Threat of Substitutes
- 4.7.5 Intensity of Competitive Rivalry
- 4.8 Investment Analysis
- 4.9 Assessment of the Impact of Macroeconomic Trends on the Market
5 MARKET SIZE AND GROWTH FORECASTS (VALUE)
- 5.1 By Component
- 5.1.1 Solutions
- 5.1.1.1 Network Management
- 5.1.1.2 Security Analytics
- 5.1.1.3 Real-time Streaming Analytics
- 5.1.1.4 Data Management and Storage Analytics
- 5.1.1.5 Visualization and Dashboard
- 5.1.2 Services
- 5.1.2.1 Professional Services
- 5.1.2.2 Managed Services
- 5.1.1 Solutions
- 5.2 By Deployment
- 5.2.1 On-premise
- 5.2.2 Cloud
- 5.3 By Organisation Size
- 5.3.1 Large Enterprises
- 5.3.2 Small and Medium Enterprises (SMEs)
- 5.4 By Application
- 5.4.1 Predictive Maintenance
- 5.4.2 Asset Performance Management
- 5.4.3 Energy Management
- 5.4.4 Supply-Chain and Logistics Optimisation
- 5.4.5 Other Applications
- 5.5 By End-User Industry
- 5.5.1 Manufacturing
- 5.5.2 Energy and Utilities
- 5.5.3 Transportation and Logistics
- 5.5.4 Retail and E-Commerce
- 5.5.5 Healthcare and Life Sciences
- 5.5.6 Other End-User Industries
- 5.6 By Geography
- 5.6.1 North America
- 5.6.1.1 United States
- 5.6.1.2 Canada
- 5.6.1.3 Mexico
- 5.6.2 Europe
- 5.6.2.1 Germany
- 5.6.2.2 United Kingdom
- 5.6.2.3 France
- 5.6.2.4 Italy
- 5.6.2.5 Spain
- 5.6.2.6 Russia
- 5.6.2.7 Rest of Europe
- 5.6.3 Asia-Pacific
- 5.6.3.1 China
- 5.6.3.2 Japan
- 5.6.3.3 India
- 5.6.3.4 South Korea
- 5.6.3.5 Australia and New Zealand
- 5.6.3.6 Rest of Asia-Pacific
- 5.6.4 South America
- 5.6.4.1 Brazil
- 5.6.4.2 Argentina
- 5.6.4.3 Rest of South America
- 5.6.5 Middle East and Africa
- 5.6.5.1 Middle East
- 5.6.5.1.1 Saudi Arabia
- 5.6.5.1.2 United Arab Emirates
- 5.6.5.1.3 Turkey
- 5.6.5.1.4 Rest of Middle East
- 5.6.5.2 Africa
- 5.6.5.2.1 South Africa
- 5.6.5.2.2 Nigeria
- 5.6.5.2.3 Rest of Africa
- 5.6.5.1 Middle East
- 5.6.1 North America
6 COMPETITIVE LANDSCAPE
- 6.1 Market Concentration
- 6.2 Strategic Moves
- 6.3 Market Share Analysis
- 6.4 Company Profiles (includes Global level Overview, Market level overview, Core Segments, Financials as available, Strategic Information, Market Rank/Share for key companies, Products and Services, and Recent Developments)
- 6.4.1 Microsoft Corporation
- 6.4.2 Amazon Web Services, Inc.
- 6.4.3 IBM Corporation
- 6.4.4 Google LLC
- 6.4.5 Cisco Systems, Inc.
- 6.4.6 Oracle Corporation
- 6.4.7 SAP SE
- 6.4.8 Dell Technologies Inc.
- 6.4.9 The Hewlett Packard Enterprise Company
- 6.4.10 Teradata Corporation
- 6.4.11 Salesforce, Inc.
- 6.4.12 Accenture plc
- 6.4.13 PTC Inc.
- 6.4.14 Hitachi Vantara LLC
- 6.4.15 Cloudera, Inc.
- 6.4.16 Software AG
- 6.4.17 SAS Institute Inc.
- 6.4.18 Splunk Inc.
- 6.4.19 C3.ai, Inc.
- 6.4.20 Uptake Technologies Inc.
- 6.4.21 GE Digital
- 6.4.22 QlikTech International AB
7 MARKET OPPORTUNITIES AND FUTURE OUTLOOK
- 7.1 White-space and Unmet-Need Assessment


