

|
시장보고서
상품코드
2123100
위험물 물류 시장 : 점유율 분석, 산업 동향 및 통계 데이터, 성장 예측(2026-2031년)Hazardous Goods Logistics - Market Share Analysis, Industry Trends & Statistics, Growth Forecasts (2026 - 2031) |
||||||
 Mordor Intelligence
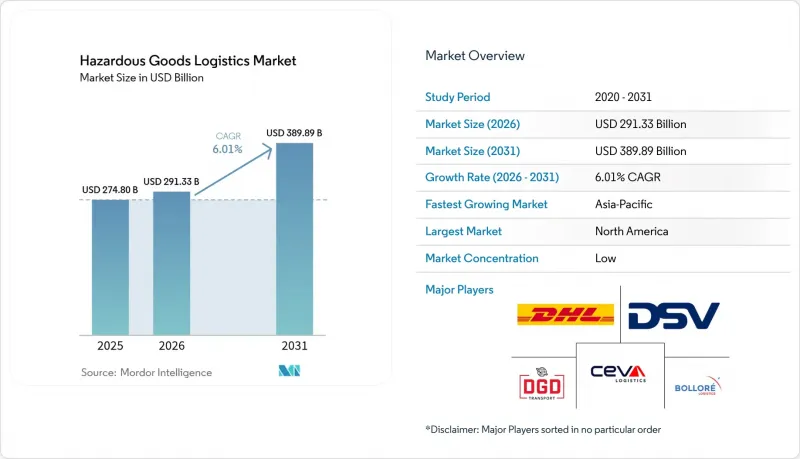
Mordor Intelligence에 의하면, 위험물 물류 시장 규모는 2025년 2,748억 달러에서 2026년에는 2,913억 3,000만 달러로 확대되어 2026년부터 2031년까지 CAGR 6.01%로 성장을 지속하여, 2031년에는 3,898억 9,000만 달러에 이를 것으로 예측됩니다.
본 보고서는 서비스별(운송, 창고·유통, 기타), 목적지별(국내, 국제/크로스보더), 최종 사용자 산업별(석유 및 가스,광업 및 금속, 에너지 및 유틸리티, 제조업(전자기기, 자동차 등), 기타), 지역별(북미, 남미, 아시아태평양, 기타)로 분류되어 있습니다. 시장 예측은 금액(달러) 기준으로 제시되어 있습니다.
전 세계 위험물 물류 시장 동향 및 인사이트
전 세계 화학제품 및 석유 제품 무역 확대
현재 전 세계 제조업체들은 등급별 특정 포장, 환기 및 분리가 필요한 특수 화학제품, 비료, 정제 제품을 더 대량으로 운송하고 있습니다. 2024년에는 미국에서만 하루 평균 120만 건의 위험물 화물이 처리될 것으로 예상되며, 이는 전체 화물 톤마일의 12%에 해당합니다. 2024년 위험물 물류 시장의 총 수익 중 화학제품이 36%를 차지하고 있으며, 이는 가압 탱크차 및 ISO 탱크 컨테이너와 같은 대규모 운송 자산의 필요성을 보여줍니다. 클래스 3 가연성 액체 및 클래스 8 부식성 물질이 철도 운송의 대부분을 차지하고 있으며, 운송업체들은 99.99%라는 사고 제로 배송 실적을 내세우고 있어, 이는 일반 시민과 규제 당국으로부터의 신뢰 유지에 기여하고 있습니다. 파이프라인, 터미널, 철도 사업자들은 적재 주기를 45분으로 단축하는 적재 센서 도입을 가속화하고 있으며, 안전성을 저해하지 않으면서 처리 능력을 향상시키고 있습니다. 멕시코만 연안 및 아시아태평양 항만의 처리 능력 확충이 지속되고 있으며, 화주들은 부가가치 서비스 계약을 통해 위험 액체 벌크 화물과 컨테이너화된 위험물을 조합하여 운송하도록 권장받고 있습니다. 이러한 요인들이 복합적으로 작용하여 위험물 물류 시장의 잠재적 수요를 확대시키고 있습니다.
엄격해지는 복합 운송 안전 규제 및 감사
각국 정부는 규제 위반에 대한 처벌을 강화하고 있으며, 이로 인해 물류 사업자들은 인증된 장비에 대한 투자와 직원 교육 실시를 불가피하게 하고 있습니다. PHMSA(미국 파이프라인 및 위험물 안전국)는 2025년에 민사 벌금을 1일당 10만 달러 이상으로 인상할 예정이며,또한 철도 사업자는 FAST법(긴급 대응법) 규정에 따라 긴급 대응 요원에게 열차 편성 데이터를 전자적으로 제공해야 할 의무가 있으며, 이에 따른 10년간의 비용은 1,770만 달러로 추정됩니다. 유엔 모델 규약과의 국경을 초월한 조화를 통해 화주는 행정 처리 부담을 피함으로써 연간 5,000만-1억 3,000만 달러의 비용 절감을 실현하는 동시에, 클래스 7 방사성 물질의 통관 시간을 단축하고 있습니다. 유럽의 ADR 2023에서는 테트라메틸암모늄 수산화물 및 재활용 플라스틱으로 제작된 IBC(중간 벌크 용기)에 대한 더 엄격한 규정이 추가되어, 운송 사업자는 컨테이너의 내장재 및 개스킷을 업그레이드해야만 합니다. 주요 제조업체들이 도입한 위성 추적 시스템과 ATEX 인증 센서를 통해 규정 준수가 더욱 지원되고 있으며, 700개의 탱크 컨테이너에 대한 온도 및 압력의 지속적인 기록이 보장되고 있습니다. 감독이 강화되는 가운데, 위험물 관리 프로토콜을 도입한 기업들은 위험물 물류 시장 전반에서 경쟁 우위를 확보하고 있습니다.
관할 구역을 넘나드는 규정 준수 복잡성
국가마다 서로 다른 규제가 뒤섞여 존재하기 때문에 운송업체는 여러 서류 제도, 교육 일정, 포장 규정을 숙지할 수밖에 없습니다. 미국은 유엔 기준을 준수하는 한편, 자국 고유의 탱크차 사양을 유지하고 있어, 이로 인해 외국 운송업체에는 추가 개조 비용이 발생합니다. 중국의 GB 6944-2012 분류는 ADR과 다르기 때문에 심천에서 로테르담으로 화물을 운송할 때는 포장을 변경해야 합니다. 유럽에서 검토 중인 PFAS 규제는 기업들이 대체 화학 물질을 서둘러 찾아야 하게 만들므로, 반도체나 PCB 공급망에 차질을 빚을 가능성이 있습니다. 위험물 취급 면허의 유효 기간, 서류 언어 규정, 비상 연락 절차 등이 지역마다 다르기 때문에 체류료 발생 및 완충 재고 증가로 이어지고 있습니다. 이에 따라 물류 사업자들은 여러 개의 규정 준수 팀을 병행하여 운영하고 있으며, 이는 간접비를 증가시켜 위험물 물류 시장에서 새로운 무역 경로의 개설을 지연시키고 있습니다.
부문 분석
운송은 여전히 핵심을 차지하고 있으며, 2025년 위험물 물류 시장의 매출의 66.42%를 차지하고 있습니다. 사업자들은 전용 도로 탱크로리, 스테인리스제 ISO 탱크, 내압 규격을 충족하는 철도 화물차 및 특수 화물기를 운영하고 있으며, 이를 조합함으로써 제1류 폭발물, 제2류 가스, 제3류 가연물의 운송을 거의 완벽한 안전 실적으로 보장하고 있습니다. 수송량 증가세는 견조하지만, 화주 측에서는 단순한 지점 간 수송에 그치지 않는 통합 서비스에 대한 요구가 높아지고 있습니다. 이러한 변화에 따라 부가가치 서비스 부문은 2031년까지 연평균 성장률(CAGR) 7.56%를 나타낼 것으로 예측되며, 이는 현장에서의 라벨 부착, 키트 조립, 통관 대행, 규제 관련 컨설팅에 대한 수요를 반영한 것입니다. 예를 들어, 의료 관련 기업은 GDP(적정 유통 기준)의 검사 요건을 충족하는 데이터 로거를 통한 기록 관리를 완벽하게 갖춘 종단 간 콜드체인 경로를 필요로 합니다. 마찬가지로, 화학 제조업체들도 SDS(안전 데이터 시트) 업데이트 및 다국어 위험물 관련 문서 작성을 외부에 위탁함으로써 핵심 생산 업무에 집중할 수 있게 되었습니다. IoT 센서 패키지, 블록체인 기반 타임스탬프, AI 리스크 스코어링 엔진은 프리미엄 계약에 포함되어 가시성 향상과 예방적 예외 관리를 실현하고 있습니다. 구획화된 베이, 방폭 사양의 공조 설비, 불활성 가스 소화 시스템을 갖춘 전문 창고에 대한 투자를 통해 반응성 화물의 보관 기간 연장이 실현되고 있습니다. 이러한 기능을 종합적으로 활용함으로써 고객 유지율을 높이고, 위험물 물류 시장에서의 지속적인 수익 성장을 뒷받침하고 있습니다.
창고 및 유통 서비스는 호환되지 않는 품목을 동일한 시설 내에서 규정을 준수하는 형태로 보관함으로써 운송 업무를 보완하고 있습니다. 현재 시설에는 불꽃 발생을 방지하기 위해 LIDAR를 탑재한 로봇 팔레트 운반기가 도입되어 있으며, 실시간 가스 감지기가 증기 농도가 OSHA 기준치에 근접하면 자동으로 환기를 가동하는 시스템으로 운영되고 있습니다. 지역 배송 모델은 라스트 마일 거리를 단축하며, 이는 좁은 온도 허용 범위를 필요로 하는 바이오의약품에 필수적입니다. 운송업체는 예측 분석을 활용하여 수요가 집중되는 지역 근처에 재고를 배치함으로써, 품질 저하 위험을 줄이고 리드타임을 단축하고 있습니다. 철도 회사는 탱크차 도착과 중간 벌크 컨테이너로의 재충전을 연결하는 벌크 환적 허브를 추진하고 있으며, 이를 통해 불필요한 장거리 도로 운송 구간을 제거하고 있습니다. 고객이 Scope 3 탄소 감축 목표를 추구하는 가운데, 물류 제공업체들은 제조 단계부터 출하 단계에 이르는 내재된 배출량을 정량화하는 생애주기 평가(LCA) 대시보드를 도입하고 있습니다. 이러한 지표들은 지속가능성 보고서에 반영되며, 공급업체 선정 기준에도 영향을 미치고 있습니다. 이 모든 동향이 결합되어 부가가치 서비스의 성장을 뒷받침하며, 위험물 물류 시장이 단순한 운송 업무에서 고수익률의 데이터 기반 솔루션으로 계속 진화할 수 있도록 보장하고 있습니다.
지역별 분석
북미는 330만 마일에 달하는 규제 대상 파이프라인, 통합된 철도망, 그리고 첨단 비상 대응 인프라의 혜택을 받아 위험물 물류 시장에서 가장 큰 점유율을 차지하고 있습니다. BNSF 및 유니온 퍼시픽과 같은 주요 철도 회사는 99.999%라는 무사고 위험물 운송 실적을 지속적으로 기록하고 있으며, 이는 안전에 대한 투자와 예방적 유지보수를 중시하는 기업 문화를 뒷받침하고 있습니다. 미국-캐나다 간 운송 노선에서는 조화로운 표지판 규정과 공유 데이터 포털을 활용하여 통관 절차를 신속하게 처리하고 있습니다. 한편, 미국-멕시코 간 노선에서는 3개국 간 무역 원활화 프로그램 하에 우선적인 인프라 구축이 진행되고 있습니다. 운송업체들은 선로변 결함 감지 장치, 예측 유지보수 AI, 그리고 연방철도청(FRA)이 승인한 제동 상태 분석 시스템에 자동화 예산을 배정하고 있으며, 이를 종합적으로 활용하여 가동 중단 시간을 줄이고 있습니다. 입법자들은 항만 내 무공해 드레이지 트럭에 대한 보조금을 지원하고 있으며, 이를 통해 화주들은 위험물 운송에 필요한 규제 준수 동력을 희생하지 않고도 탄소 발자국을 줄일 수 있게 되었습니다.
유럽은 엄격한 ADR(유럽 위험물 운송 규정)의 규정과 저탄소 복합 운송 회랑을 위한 정책 추진에 의해 형성되어, 규모 면에서 2위를 차지하는 지역으로 뒤를 잇고 있습니다. 철도 화물 사업자들은 번거로운 행정 절차 없이 국경을 넘어 기관차를 환승할 수 있게 해주는 ‘단일 유럽 철도권(SERA)’ 이니셔티브를 활용하고 있습니다. 로테르담이나 앤트워프 등의 항구에서는 클래스 7 동위원소 전용 벙커가 제공되고 있으며, 내륙 수로에서는 증기 회수 장치를 갖춘 이중 선체 바지선으로 클래스 3 액체를 운송하고 있습니다. ‘유럽 그린딜’은 도로에서 철도 및 내륙 수로로 운송 수단을 전환하도록 장려하고 있으며, 운송사들은 이에 대응하여 두 운송 수단 모두에 대응 가능한 45피트 스왑 바디에 대한 투자를 추진하고 있습니다. DSV의 143억 유로(157억 8,000만 달러) 규모 쉔커(Schenker) 인수는 90개국에 걸친 네트워크의 밀도를 높여, 다국적 화주에게 광범위한 서비스 제공을 보장하고 있습니다. 또한, 각 사업자는 유로 VII 규제안 준수를 목표로 수소 연료 구동 간선 운송용 트럭의 시범 운행을 실시하고 있으며, 위험물 물류 시장에서 유럽의 기술 인큐베이터로서의 역할을 입증하고 있습니다.
아시아태평양은 중국, 동남아시아, 인도의 산업 확장에 힘입어 가장 빠른 성장 속도를 기록하고 있습니다. 중국은 규제 체제의 현대화를 지속하고 있으며, 클래스 2 실린더 적재 트럭에 텔레매틱스 탑재를 의무화하고, 위험물 운송 노선을 따라 분리된 휴게소를 건설하고 있습니다. 인도는 체류 시간을 단축하고, 전기 견인 장치를 갖춘 위험물 수송 열차를 수용할 수 있는 전용 화물 회랑에 투자하고 있습니다. 일본의 항만에서는 방폭형 배터리를 탑재한 무인 운반차(AGV)가 도입되어 선박의 턴어라운드 시간이 단축되고 있습니다. 각 제조업체는 공급 거점을 다각화하고 있으며, 전자기기 및 배터리 생산의 일부를 베트남과 태국으로 이전하고 있습니다. 이에 따라 규제를 준수하는 물류에 대한 지역적 수요가 가속화되고 있습니다. 호주와 한국에서는 화학 산업단지의 개보수가 진행되고 있으며, 부지 내에 소방대를 배치하거나 디지털 트윈을 활용한 시뮬레이션을 도입하는 등 재난 대비를 강화하고 있습니다. 이러한 노력들이 어우러져 아시아태평양 사업자들의 경쟁력이 강화되고 있으며, 위험물 물류 시장에 대한 총 수익 기여도가 확대되고 있습니다.
기타 혜택:
- Excel 형식 시장 예측(ME) 시트
- 3개월간의 애널리스트 지원
자주 묻는 질문
목차
제1장 서론
제2장 분석 방법
제3장 주요 요약
제4장 시장 구도
제5장 시장 규모와 성장 예측
제6장 경쟁 구도
제7장 시장 기회와 향후 전망
JHS 26.09.09According to Mordor Intelligence, the hazardous goods logistics market size is expected to grow from USD 274.80 billion in 2025 to USD 291.33 billion in 2026 and is forecast to reach USD 389.89 billion by 2031 at 6.01% CAGR over 2026-2031.
This report is Segmented by Service (Transportation, Warehousing & Distribution and More), by Destination (Domestic and Cross-border/International), by End User Industry (Oil & Gas, Mining & Metals, Energy & Utilities, Manufacturing (Electronics, Automotive, Etc. ), and More), by Geography (North America, South America, Asia Pacific, and More). The Market Forecasts are Provided in Terms of Value (USD).
Global Hazardous Goods Logistics Market Trends and Insights
Expansion of Global Chemical & Petro-Product Trade
Global manufacturers now move larger volumes of specialty chemicals, fertilizers, and refined products that require class-specific packaging, ventilation, and segregation. The United States alone handled 1.2 million daily hazmat consignments in 2024, equal to 12% of all freight ton-miles . Chemicals represented 36% of overall 2024 revenues inside the Hazardous Goods Logistics market, demonstrating the need for scale assets such as pressurized tank cars and ISO tank containers. Class 3 flammable liquids and Class 8 corrosives dominate rail traffic, and carriers cite a 99.99% incident-free delivery rate that helps maintain public and regulatory confidence. Pipeline, terminal, and rail operators are accelerating load-sensor adoption that cuts loading cycles to 45 minutes, facilitating greater throughput without compromising safety. Capacity upgrades across Gulf Coast and Asia-Pacific ports continue, encouraging shippers to bundle hazardous liquid bulk with containerized dangerous goods inside value-added service contracts. These combined forces collectively expand addressable demand inside the Hazardous Goods Logistics market.
Tightening Multi-Modal Safety Regulations & Audits
Governments are elevating penalties for non-compliance, which compels logistics providers to invest in certified equipment and staff training. PHMSA raised civil fines above USD 100,000 per day in 2025, and railroads must now deliver electronic consist data to first responders under FAST Act mandates, a ten-year outlay estimated at USD 17.7 million. Cross-border harmonization with UN Model Regulations saves shippers USD 50-130 million annually in avoided paperwork while shrinking clearance times for Class 7 radioactive materials. Europe's ADR 2023 added stricter provisions for tetramethylammonium hydroxide and recycled-plastic IBCs, forcing fleets to upgrade container linings and gaskets. Compliance is further supported by satellite tracking and ATEX-certified sensors rolled out by major producers, ensuring continuous temperature and pressure logging on 700 tank containers. As oversight deepens, companies that embed risk-management protocols gain a competitive edge across the Hazardous Goods Logistics market.
Compliance Complexity Across Jurisdictions
A patchwork of national regulations compels carriers to master multiple documentation regimes, training schedules, and packaging codes. The United States aligns with UN standards yet retains country-specific tank car specifications that add retrofit costs for foreign fleets. China's GB 6944-2012 classification diverges from ADR, necessitating packaging conversions when shipments transit from Shenzhen to Rotterdam. Europe's pending PFAS restrictions could interrupt semiconductor and PCB supply chains as firms scramble for substitute chemistries. Varying driver-hazmat endorsement hours, document language rules, and emergency-contact protocols lead to detention fees and higher buffer inventories. Logistics providers therefore maintain parallel compliance teams, which inflates overhead and slows onboarding of new trade lanes inside the Hazardous Goods Logistics market.
Other drivers and restraints analyzed in the detailed report include:
- Rapid Growth of B2B E-Commerce Platforms for Hazmat
- Blockchain-Enabled Chain-of-Custody Solutions Gain Traction
- Escalating Insurance & Liability Premiums
For complete list of drivers and restraints, kindly check the Table Of Contents.
Segment Analysis
Transportation remains the backbone, responsible for 66.42% of 2025 revenues inside the Hazardous Goods Logistics market. Operators run dedicated road tankers, stainless ISO tanks, pressure-rated railcars, and specialized cargo aircraft that together guarantee arrival of Class 1 explosives, Class 2 gases, and Class 3 flammables with near-perfect safety statistics. While transport volume growth is steady, shippers increasingly request integrated services that extend beyond point-to-point haulage. This shift explains why the value-added segment posts a 7.56% CAGR to 2031, reflecting demand for on-site labeling, kit assembly, customs brokerage, and regulatory consulting. Healthcare firms, for example, require end-to-end cold chain pathways, complete with data-logger archiving that satisfies GDP inspections. Chemical producers similarly outsource SDS updates and multi-language hazard documentation, allowing them to focus on core production tasks. IoT sensor packages, blockchain timestamping, and AI risk-scoring engines are embedded into premium contracts, conferring enhanced visibility and proactive exception management. Investment in specialized warehouses equipped with segregated bays, explosion-proof HVAC, and inert-gas fire suppression supports longer dwell times for reactive cargoes. Together, these capabilities broaden customer stickiness and underpin sustained revenue momentum inside the Hazardous Goods Logistics market.
Warehouse and distribution services complement transportation by providing compliant storage for incompatible classes under one roof. Facilities now feature robotic pallet movers fitted with LIDAR to avoid spark generation, while real-time gas detectors trigger automated ventilation when vapor thresholds near OSHA limits. Regional distribution models shorten final-mile distances, which is essential for biologics requiring narrow temperature tolerances. Carriers tap predictive analytics to place inventory closer to demand clusters, thus lowering spoilage risks and shrinking lead times. Railroads promote bulk transload hubs that connect tank-car arrivals to intermediate bulk container refills, eliminating redundant long-haul road legs. As clients pursue scope 3 carbon-reduction targets, logistics providers roll out lifecycle assessment dashboards that quantify embedded emissions from cradle-to-gate. Those metrics feed sustainability reports and influence vendor selection criteria. All these trends collectively sustain growth in value-added offerings, ensuring the Hazardous Goods Logistics market continues to evolve from transactional hauling toward high-margin, data-rich solutions.
Complete Report Scope:
- By Service (Value)
- Transportation
- Road
- Rail
- Air
- Sea and Inland Waterways
- Warehousing & Distribution
- Value-added Services (Labelling, Kitting, Consulting)
- Transportation
- By Destination (Value)
- Domestic
- International / Cross-border
- By End-use Industry (Value)
- Oil & Gas
- Chemicals & Petrochemicals
- Healthcare & Pharma
- Agriculture & Fertilizers
- Mining & Metals
- Energy & Utilities
- Manufacturing (Electronics, Automotive, etc.)
- Waste Management & Recycling
- Others
- Geography (Value)
- North America
- United States
- Canada
- Mexico
- South America
- Brazil
- Peru
- Chile
- Argentina
- Rest of South America
- Asia Pacific
- India
- China
- Japan
- Australia
- South Korea
- South East Asia (Singapore, Malaysia, Thailand, Indonesia, Vietnam, and Philippines)
- Rest of Asia-Pacific
- Europe
- United Kingdom
- Germany
- France
- Spain
- Italy
- BENELUX (Belgium, Netherlands, and Luxembourg)
- NORDICS (Denmark, Finland, Iceland, Norway, and Sweden)
- Rest of Europe
- Middle East And Africa
- United Arab of Emirates
- Saudi Arabia
- South Africa
- Nigeria
- Rest of Middle East And Africa
- North America
Geography Analysis
North America constitutes the largest share of the Hazardous Goods Logistics market, benefiting from 3.3 million miles of regulated pipelines, an integrated rail network, and sophisticated emergency-response infrastructure. Major railroads such as BNSF and Union Pacific continue to record 99.999% incident-free hazmat deliveries, underlining a culture of safety investment and proactive maintenance. The US-Canada corridor leverages harmonized placard codes and shared data portals that expedite customs clearance, while the US-Mexico lane earns priority upgrades under trilateral trade facilitation programs. Carriers allocate automation budgets to wayside defect detectors, predictive maintenance AI, and FRA-approved brake-health analytics that collectively reduce downtime. Legislators channel grants toward zero-emission drayage trucks at ports, helping shippers shrink carbon footprints without sacrificing compliant power for hazardous cargo.
Europe follows as the second-largest region, shaped by stringent ADR provisions and a policy push toward low-carbon multimodal corridors. Rail freight operators capitalize on Single European Railway Area initiatives that enable cross-border locomotive shifts without extensive administrative stops. Ports such as Rotterdam and Antwerp offer dedicated Class-7 isotope bunkers, while inland waterways handle Class 3 liquids on double-hulled barges fitted with vapor-recovery units. The European Green Deal incentivizes modal shifts from road to rail and inland waterway, and carriers respond by investing in 45-foot swap bodies compatible with both platforms. DSV's EUR 14.3 billion (USD 15.78 billion) acquisition of Schenker bolsters network density across 90 countries, ensuring broad service coverage for multinational shippers. Operators also trial hydrogen-powered line-haul trucks to comply with Euro VII proposals, demonstrating Europe's role as a technology incubator within the Hazardous Goods Logistics market.
Asia-Pacific delivers the fastest growth pace, propelled by industrial expansion in China, Southeast Asia, and India. China continues modernizing its regulatory regime, rolling out compulsory telematics on Class 2 cylinder trucks and constructing segregated service areas along hazardous routes. India invests in dedicated freight corridors that accommodate hazmat trains with reduced dwell times and electrified traction. Japanese ports host automated guided vehicles equipped with explosion-proof batteries, shortening vessel turnaround. Manufacturers diversify supply bases, redirecting some electronics and battery production toward Vietnam and Thailand, which in turn accelerates regional demand for compliant logistics. Australia and South Korea upgrade chemical parks with on-premise firefighting brigades and digital twin simulations that enhance preparedness. Collectively, these initiatives strengthen the competitive positioning of Asia-Pacific participants, expanding overall revenue contributions to the Hazardous Goods Logistics market.
- Deutsche Post DHL Group
- DSV
- CEVA Logistics
- Bollore Logistics
- DGD Transport
- Toll Group
- YRC Worldwide (USF HazMat)
- Hellmann Worldwide Logistics
- Kuehne + Nagel
- XPO Logistics
- GEODIS
- Rhenus Logistics
- FedEx Custom Critical
- UPS Healthcare / Hazmat
- C.H. Robinson
- Nippon Express
- Sinotrans
- Kintetsu World Express
- GXO Logistics
- SNCF Geodis Rail Freight*
Additional Benefits:
- The market estimate (ME) sheet in Excel format
- 3 months of analyst support
TABLE OF CONTENTS
1 Introduction
- 1.1 Study Assumptions & Market Definition
- 1.2 Scope of the Study
2 Research Methodology
3 Executive Summary
4 Market Landscape
- 4.1 Market Overview
- 4.2 Market Drivers
- 4.2.1 Expansion of global chemical & petro-product trade
- 4.2.2 Tightening multi-modal safety regulations & audits
- 4.2.3 Rapid growth of B2B e-commerce platforms for hazmat
- 4.2.4 Blockchain-enabled chain-of-custody solutions gain traction
- 4.2.5 Low-carbon intermodal rail-water corridors for hazmat shipments
- 4.2.6 Reverse-logistics demand from on-site industrial recycling
- 4.3 Market Restraints
- 4.3.1 Compliance complexity across jurisdictions
- 4.3.2 Escalating insurance & liability premiums
- 4.3.3 Shortage of Euro VI / zero-emission hazmat vehicles
- 4.3.4 Cyber-vulnerabilities in e-Dangerous Goods Declaration systems
- 4.4 Value / Supply-Chain Analysis
- 4.5 Regulatory Landscape
- 4.6 Technological Outlook
- 4.7 Stakeholder Mapping (3PLs, GHA, Carriers, Advisors)
- 4.8 Documentation & Permit Requirements
- 4.9 Equipment & Accessories (IBC, UN drums, track-&-trace sensors)
- 4.10 Risk Assessment in Hazmat Shipments
- 4.11 Packaging Insights
- 4.12 Impact of Geo-Political Events in the Market
- 4.13 Porter's Five Forces
- 4.13.1 Bargaining Power of Suppliers
- 4.13.2 Bargaining Power of Buyers
- 4.13.3 Threat of New Entrants
- 4.13.4 Threat of Substitutes
- 4.13.5 Intensity of Competitive Rivalry
5 Market Size & Growth Forecasts
- 5.1 By Service (Value)
- 5.1.1 Transportation
- 5.1.1.1 Road
- 5.1.1.2 Rail
- 5.1.1.3 Air
- 5.1.1.4 Sea and Inland Waterways
- 5.1.2 Warehousing & Distribution
- 5.1.3 Value-added Services (Labelling, Kitting, Consulting)
- 5.1.1 Transportation
- 5.2 By Destination (Value)
- 5.2.1 Domestic
- 5.2.2 International / Cross-border
- 5.3 By End-use Industry (Value)
- 5.3.1 Oil & Gas
- 5.3.2 Chemicals & Petrochemicals
- 5.3.3 Healthcare & Pharma
- 5.3.4 Agriculture & Fertilizers
- 5.3.5 Mining & Metals
- 5.3.6 Energy & Utilities
- 5.3.7 Manufacturing (Electronics, Automotive, etc.)
- 5.3.8 Waste Management & Recycling
- 5.3.9 Others
- 5.4 Geography (Value)
- 5.4.1 North America
- 5.4.1.1 United States
- 5.4.1.2 Canada
- 5.4.1.3 Mexico
- 5.4.2 South America
- 5.4.2.1 Brazil
- 5.4.2.2 Peru
- 5.4.2.3 Chile
- 5.4.2.4 Argentina
- 5.4.2.5 Rest of South America
- 5.4.3 Asia Pacific
- 5.4.3.1 India
- 5.4.3.2 China
- 5.4.3.3 Japan
- 5.4.3.4 Australia
- 5.4.3.5 South Korea
- 5.4.3.6 South East Asia (Singapore, Malaysia, Thailand, Indonesia, Vietnam, and Philippines)
- 5.4.3.7 Rest of Asia-Pacific
- 5.4.4 Europe
- 5.4.4.1 United Kingdom
- 5.4.4.2 Germany
- 5.4.4.3 France
- 5.4.4.4 Spain
- 5.4.4.5 Italy
- 5.4.4.6 BENELUX (Belgium, Netherlands, and Luxembourg)
- 5.4.4.7 NORDICS (Denmark, Finland, Iceland, Norway, and Sweden)
- 5.4.4.8 Rest of Europe
- 5.4.5 Middle East And Africa
- 5.4.5.1 United Arab of Emirates
- 5.4.5.2 Saudi Arabia
- 5.4.5.3 South Africa
- 5.4.5.4 Nigeria
- 5.4.5.5 Rest of Middle East And Africa
- 5.4.1 North America
6 Competitive Landscape
- 6.1 Market Concentration
- 6.2 Strategic Moves
- 6.3 Market Share Analysis
- 6.4 Company Profiles (includes Global level Overview, Market level overview, Core Segments, Financials as available, Strategic Information, Market Rank/Share, Products & Services, Recent Developments)
- 6.4.1 Deutsche Post DHL Group
- 6.4.2 DSV
- 6.4.3 CEVA Logistics
- 6.4.4 Bollore Logistics
- 6.4.5 DGD Transport
- 6.4.6 Toll Group
- 6.4.7 YRC Worldwide (USF HazMat)
- 6.4.8 Hellmann Worldwide Logistics
- 6.4.9 Kuehne + Nagel
- 6.4.10 XPO Logistics
- 6.4.11 GEODIS
- 6.4.12 Rhenus Logistics
- 6.4.13 FedEx Custom Critical
- 6.4.14 UPS Healthcare / Hazmat
- 6.4.15 C.H. Robinson
- 6.4.16 Nippon Express
- 6.4.17 Sinotrans
- 6.4.18 Kintetsu World Express
- 6.4.19 GXO Logistics
- 6.4.20 SNCF Geodis Rail Freight*


